Advanced Techniques for MATLAB to Read Excel Data: Case Studies and Best Practices
发布时间: 2024-09-15 15:29:57 阅读量: 7 订阅数: 16 
# Advanced Techniques for MATLAB to Read Excel Data: Case Analysis and Best Practices
MATLAB is a powerful technical computing language that provides a wide array of functions for reading and processing Excel data. Understanding the theoretical underpinnings of these functions is crucial for effectively utilizing MATLAB in data analysis.
**1.1 The Structure of Excel Files**
本质上,Excel文件是电子表格,由工作簿和工作表组成。工作簿包含多个工作表,每个工作表是一个二维数组,行和列表示数据。MATLAB可以通过其专用的函数读取和操作这些结构。
Excel files are essentially electronic spreadsheets composed of workbooks and worksheets. A workbook contains multiple worksheets, each of which is a two-dimensional array where rows and columns represent data. MATLAB can read and manipulate these structures through its specialized functions.
**1.2 Data Types and Formats**
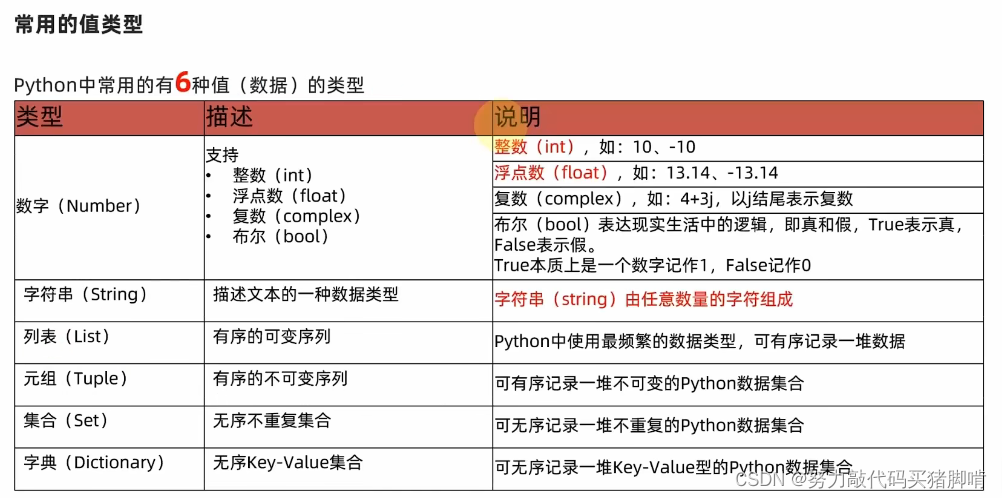
Excel supports a variety of data types, including numbers, text, dates, and times. MATLAB can recognize these data types and convert them into its corresponding data types. Moreover, MATLAB can handle various data formats used in Excel, such as numeric formats, date formats, and text formats.
# 2. Practical Tips for MATLAB to Read Excel Data
### 2.1 Data Import and Export
#### 2.1.1 Using readtable and writetable Functions
The **readtable function** is used for reading data from an Excel file. It takes a file path or file object as input and returns a MATLAB table containing the extracted data.
```
% Importing Excel file
data = readtable('data.xlsx');
```
The **writetable function** is used to write a MATLAB table into an Excel file. It accepts a MATLAB table and a file path or file object as input and writes the table data into an Excel file.
```
% Writing MATLAB table into an Excel file
writetable(data, 'output.xlsx');
```
#### 2.1.2 Importing and Exporting Different Data Types
The readtable and writetable functions support importing and exporting various data types, including:
| Data Type | MATLAB Data Type |
|---|---|
| Numeric | double |
| String | cell |
| Date and Time | datetime |
| Logical Values | logical |
| Missing Values | NaN |
### 2.2 Data Processing and Transformation
#### 2.2.1 Data Cleaning and Preprocessing
Before analyzing data, it often needs to be cleaned and preprocessed to handle missing values, outliers, and inconsistencies.
**Handling Missing Values:**
```
% Finding missing values
missingData = isnan(data);
% Deleting columns or rows with missing values
data = data(~any(missingData, 1), :);
data = data(:, ~any(missingData, 2));
```
**Handling Outliers:**
```
% Identifying outliers
outliers = data > 3 * std(data);
% Replacing outliers with NaN
data(outliers) = NaN;
```
#### 2.2.2 Data Type Conversion and Formatting
Data within a MATLAB table can be converted to different data types to meet analytical needs.
```
% Converting string data type to numeric data type
data.Age = str2double(data.Age);
% Formatting date and time data
data.Date = datestr(data.Date, 'yyyy-mm-dd');
```
#### 2.2.3 Data Merging and Joining
MATLAB tables can be merged and joined to combine data from different sources or files.
```
% Horizontally merging two tables
combinedData = [table1, table2];
% Vertically merging two tables
combinedData = vertcat(table1, table2);
```
### 2.3 Data Visualization and Analysis
#### 2.3.1 Using plot, scatter, and histogram Functions
MATLAB provides a suite of functions for visualizing and analyzing data, including:
The **plot function** is used for drawing line plots and scatter plots.
```
% Drawing a line plot
plot(data.Time, data.Value);
% Drawing a scatter plot
scatter(data.X, data.Y);
```
The **scatter function** is used for drawing scatter plots where the size and color of each point can represent other data attributes.
```
% Drawing a scatter plot with point size indicating values
scatter(data.X, data.Y, 50, data.Value);
% Drawing a scatter plot with point color indicating categories
scatter(data.X, data.Y, 50, data.Category, 'filled');
```
The **histogram function** is used for creating histograms, showing data distribution.
```
% Creating a histogram
histogram(data.Value);
```
#### 2.3.2 Creating Interactive Charts and Dashboards
MATLAB allows creating interactive charts and dashboards for exploration and analysis of data.
```
% Creating an interactive line plot
figure;
plot(data.Time, data.Value);
xlabel('Time');
ylabel('Value');
title('Interactive Line Plot');
% Adding interactive tools
interactiveLegend;
interactivePanAndZoom;
```
# 3. Case Analysis of MATLAB Reading E

 百万级
高质量VIP文章无限畅学
百万级
高质量VIP文章无限畅学
 千万级
优质资源任意下载
千万级
优质资源任意下载
 C知道
免费提问 ( 生成式Al产品 )
C知道
免费提问 ( 生成式Al产品 )
0
0
相关推荐

专栏目录
最低0.47元/天 解锁专栏
送3个月
百万级
高质量VIP文章无限畅学
千万级
优质资源任意下载
C知道
免费提问 ( 生成式Al产品 )
最新推荐
【Python字符串转列表进阶技巧】:不同场景下的最佳实践
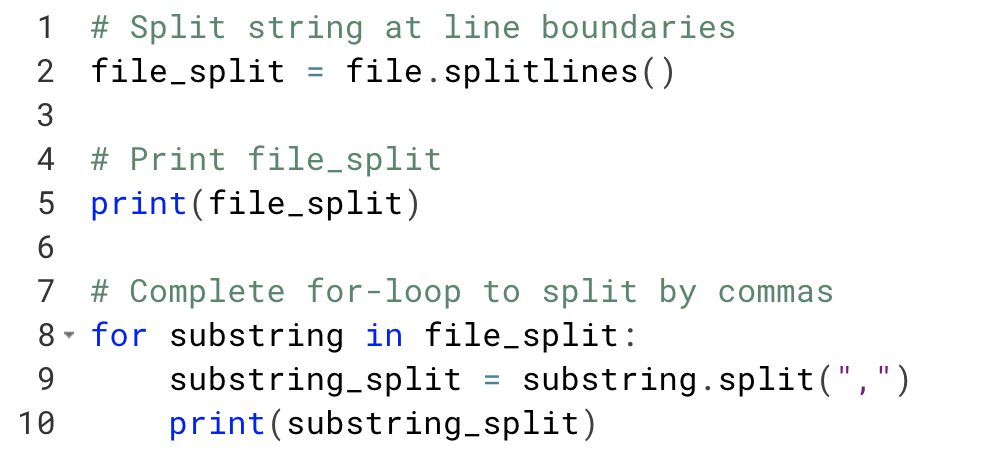
# 1. 字符串转列表基础概念和需求
## 1.1 字符串与列表的基本定义
在编程领域,字符串是字符的序列,它可以表示文本信息。列表是一种数据结构,用于存储一系列的有序元素。在实际应用中,常常需要将字符串转换为列表,以便进行进一步的数据处理和分析。这种转换是许多高级操作如排序、搜索、过滤等的基础。
## 1.2 转换的需求场景
字符串转列表的
【Python调试技巧】:使用字符串进行有效的调试
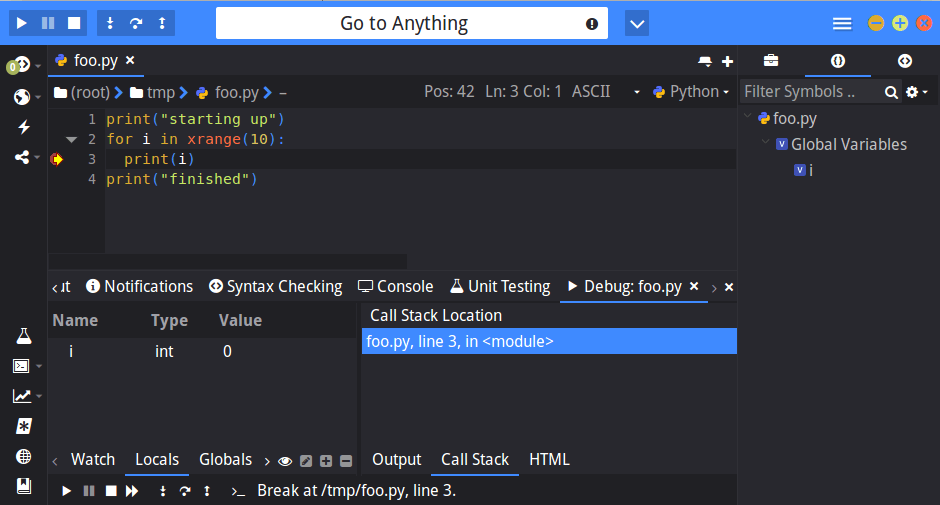
# 1. Python字符串与调试的关系
在开发过程中,Python字符串不仅是数据和信息展示的基本方式,还与代码调试紧密相关。调试通常需要从程序运行中提取有用信息,而字符串是这些信息的主要载体。良好的字符串使用习惯能够帮助开发者快速定位问题所在,优化日志记录,并在异常处理时提供清晰的反馈。这一章将探讨Python字符串与调试之间的关系,并展示如何有效地利用字符串进行代码调试。
# 2. P
Python字符串编码解码:Unicode到UTF-8的转换规则全解析
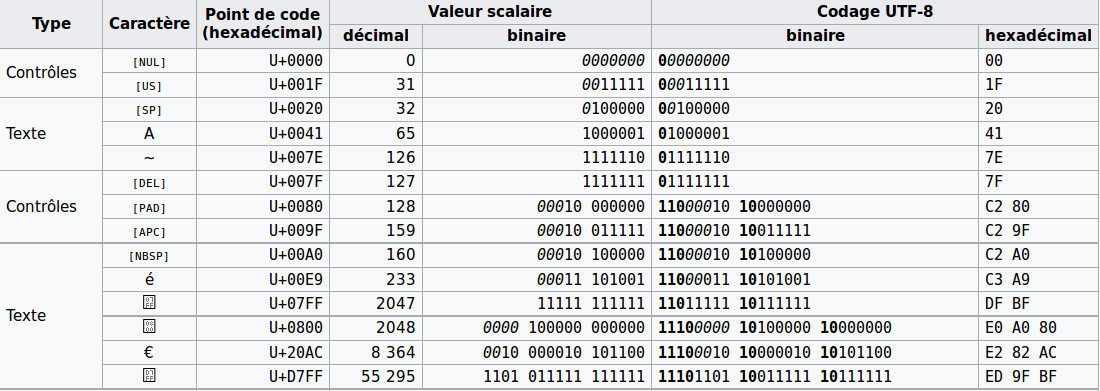
# 1. 字符串编码基础与历史回顾
## 1.1 早期字符编码的挑战
在计算机发展的初期阶段,字符编码并不统一,这造成了很多兼容性问题。由于不同的计算机制造商使用各自的编码表,导致了数据交换的困难。例如,早期的ASCII编码只包含128个字符,这对于表示各种语言文字是远远不够的。
## 1.2 字符编码的演进
随着全球化的推进,需要一个统一的字符集来支持
【持久化存储】:将内存中的Python字典保存到磁盘的技巧

# 1. 内存与磁盘存储的基本概念
在深入探讨如何使用Python进行数据持久化之前,我们必须先了解内存和磁盘存储的基本概念。计算机系统中的内存指的
【Python排序与异常处理】:优雅地处理排序过程中的各种异常情况
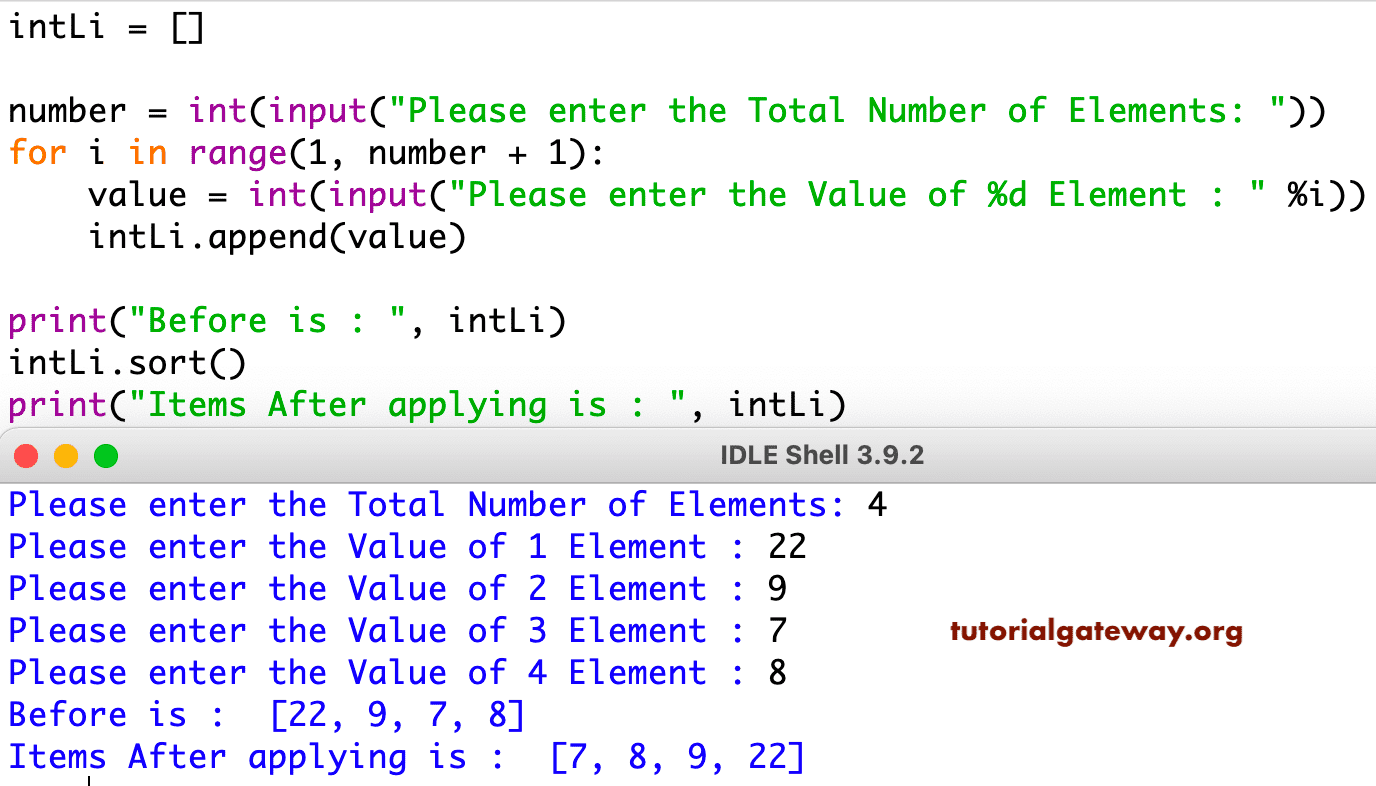
# 1. Python排序算法概述
排序算法是计算机科学中的基础概念之一,无论是在学习还是在实际工作中,都是不可或缺的技能。Python作为一门广泛使用的编程语言,内置了多种排序机制,这些机制在不同的应用场景中发挥着关键作用。本章将为读者提供一个Python排序算法的概览,包括Python内置排序函数的基本使用、排序算法的复杂度分析,以及高级排序技术的探
Python测试驱动开发(TDD)实战指南:编写健壮代码的艺术
# 1. 测试驱动开发(TDD)简介
测试驱动开发(TDD)是一种软件开发实践,它指导开发人员首先编写失败的测试用例,然后编写代码使其通过,最后进行重构以提高代码质量。TDD的核心是反复进行非常短的开发周期,称为“红绿重构”循环。在这一过程中,"红"代表测试失败,"绿"代表测试通过,而"重构"则是在测试通过后,提升代码质量和设计的阶段。TDD能有效确保软件质量,促进设计的清晰度,以及提高开发效率。尽管它增加了开发初期的工作量,但长远来
Python并发控制:在多线程环境中避免竞态条件的策略

# 1. Python并发控制的理论基础
在现代软件开发中,处理并发任务已成为设计高效应用程序的关键因素。Python语言因其简洁易读的语法和强大的库支持,在并发编程领域也表现出色。本章节将为读者介绍并发控制的理论基础,为深入理解和应用Python中的并发工具打下坚实的基础。
## 1.1 并发与并行的概念区分
首先,理解并发和并行之间的区别至关重要。并发(Concurre
Python列表的函数式编程之旅:map和filter让代码更优雅
# 1. 函数式编程简介与Python列表基础
## 1.1 函数式编程概述
函数式编程(Functional Programming,FP)是一种编程范式,其主要思想是使用纯函数来构建软件。纯函数是指在相同的输入下总是返回相同输出的函数,并且没有引起任何可观察的副作用。与命令式编程(如C/C++和Java)不同,函数式编程
Python在语音识别中的应用:构建能听懂人类的AI系统的终极指南

# 1. 语音识别与Python概述
在当今飞速发展的信息技术时代,语音识别技术的应用范围越来越广,它已经成为人工智能领域里一个重要的研究方向。Python作为一门广泛应用于数据科学和机器学习的编程语言,因其简洁的语法和强大的库支持,在语音识别系统开发中扮演了重要角色。本章将对语音识别的概念进行简要介绍,并探讨Python在语音识别中的应用和优势。
语音识别技术本质上是计算机系统通过算法将人类的语音信号转换
Python索引的局限性:当索引不再提高效率时的应对策略

# 1. Python索引的基础知识
在编程世界中,索引是一个至关重要的概念,特别是在处理数组、列表或任何可索引数据结构时。Python中的索引也不例外,它允许我们访问序列中的单个元素、切片、子序列以及其他数据项。理解索引的基础知识,对于编写高效的Python代码至关重要。
## 理解索引的概念
Python中的索引从0开始计数。这意味着列表中的第一个元素
资源上传下载、课程学习等过程中有任何疑问或建议,欢迎提出宝贵意见哦~我们会及时处理!
点击此处反馈


专栏目录
最低0.47元/天 解锁专栏
送3个月
百万级
高质量VIP文章无限畅学
千万级
优质资源任意下载
C知道
免费提问 ( 生成式Al产品 )