【CART决策树算法秘籍】:入门到实战,轻松掌握决策树精髓
发布时间: 2024-08-20 23:58:20 阅读量: 31 订阅数: 35 

java+sql server项目之科帮网计算机配件报价系统源代码.zip
# 1. CART决策树算法概述**
CART(分类与回归树)是一种广泛应用于机器学习中的决策树算法。它通过递归地将数据集划分为更小的子集,构建一棵二叉树,从而对数据进行分类或回归。CART算法以其易于理解、解释性和预测准确性而著称。它在各种领域中得到了广泛应用,包括数据挖掘、医疗诊断和金融预测。
# 2. CART决策树算法理论基础
### 2.1 决策树基本概念和分类
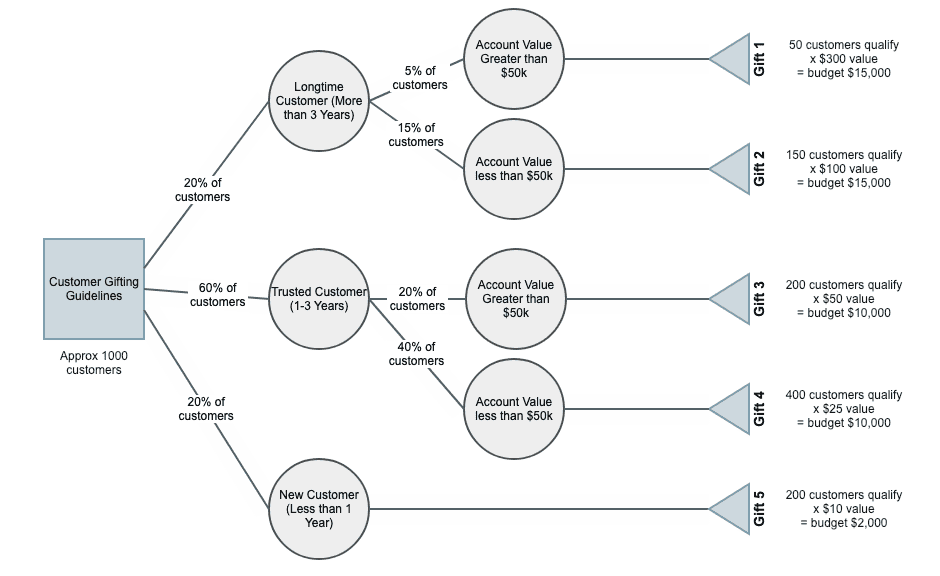
决策树是一种监督学习算法,它通过构建一个树形结构来对数据进行分类或回归。决策树的每个内部节点代表一个特征,每个分支代表该特征的一个可能值。叶节点代表最终的分类或回归结果。
决策树可以分为两类:
- **分类树:**用于预测离散的目标变量,例如客户的类别(好或坏)。
- **回归树:**用于预测连续的目标变量,例如房屋的价格。
### 2.2 CART算法的工作原理
CART(Classification and Regression Tree)算法是一种流行的决策树算法,它使用基尼系数或信息增益作为特征选择准则。
#### 2.2.1 基尼系数和信息增益
**基尼系数:**衡量数据集不纯度的指标,范围为0到1。0表示数据集完全纯净(所有样本属于同一类别),1表示数据集完全不纯(每个类别都有样本)。
**信息增益:**衡量特征对数据集纯度的影响。信息增益越大,表示该特征对分类或回归任务越重要。
#### 2.2.2 决策树的构建过程
CART算法通过以下步骤构建决策树:
1. **选择根节点:**使用基尼系数或信息增益选择具有最高不纯度的特征作为根节点。
2. **分裂节点:**对于每个内部节点,使用基尼系数或信息增益选择最佳分裂点,将数据集分成两个子集。
3. **递归:**对每个子集重复步骤1和2,直到达到停止准则(例如,数据集纯净或达到最大深度)。
4. **生成叶节点:**叶节点代表最终的分类或回归结果。
### 2.3 CART算法的优缺点
**优点:**
- 易于理解和解释
- 不需要特征缩放或归一化
- 可以处理缺失值
- 可以处理高维数据集
**缺点:**
- 可能产生过拟合
- 对噪声数据敏感
- 容易受到特征顺序的影响
# 3.1 CART算法的实现
### 3.1.1 Python中的CART算法库
在Python中,有许多库可以用来实现CART算法,其中最流行的是scikit-learn。scikit-learn提供了一个名为`DecisionTreeClassifier`的类,它可以用来构建CART分类树,以及一个名为`DecisionTreeRegressor`的类,它可以用来构建CART回归树。
```python
# 导入scikit-learn库
from sklearn.tree import DecisionTreeClassifier
# 创建一个CART分类树
clf = DecisionTreeClassifier()
# 拟合数据
clf.fit(X_train, y_train)
# 预测新数据
y_pred = clf.predict(X_test)
```
### 3.1.2 CART算法的代码示例
以下是一个简单的CART算法的代码示例,它使用Python中的`DecisionTreeClassifier`类来构建一个分类树:
```python
# 导入必要的库
import numpy as np
import pandas as pd
from sklearn.tree import DecisionTreeClassifier
# 加载数据
data = pd.read_csv('data.csv')
# 特征和目标变量
X = data.iloc[:, :-1]
y = data.iloc[:, -1]
# 分割数据
X_train, X_test, y_train, y_test = train_test_split(X, y, test_size=0.2)
# 创建一个CART分类树
clf = DecisionTreeClassifier()
# 拟合数据
clf.fit(X_train, y_train)
# 预测新数据
y_pred = clf.predict(X_test)
# 评估模型
print(classification_report(y_test, y_pred))
```
**代码逻辑分析:**
1. 导入必要的库,包括NumPy、Pandas和scikit-learn。
2. 加载数据并将其分成特征(X)和目标变量(y)。
3. 将数据分成训练集和测试集。
4. 创建一个CART分类树对象。
5. 使用训练数据拟合CART分类树。
6. 使用测试数据预测目标变量。
7. 使用分类报告评估模型的性能。
**参数说明:**
* `train_test_split()`函数:用于将数据分成训练集和测试集,`test_size`参数指定测试集的大小。
* `DecisionTreeClassifier()`类:用于创建CART分类树。
* `fit()`方法:用于拟合数据到CART分类树。
* `predict()`方法:用于预测新数据的目标变量。
* `classification_report()`函数:用于评估模型的性能。
# 4. CART决策树算法进阶
### 4.1 CART算法的调优
#### 4.1.1 剪枝技术
剪枝技术是通过删除决策树中不重要的分支来减少过拟合的一种方法。常用的剪枝技术有:
- **预剪枝:**在决策树构建过程中,如果一个节点的信息增益低于某个阈值,则停止分裂该节点。
- **后剪枝:**在决策树构建完成后,从底向上剪除不重要的分支。
#### 4.1.2 超参数优化
CART算法的超参数包括:
- **最大树深度:**决策树的最大深度。
- **最小样本分裂数:**一个节点分裂所需的最小样本数。
- **最小信息增益:**一个节点分裂所需的信息增益阈值。
超参数优化可以通过网格搜索或贝叶斯优化等方法进行,以找到最佳超参数组合。
### 4.2 CART算法的扩展
#### 4.2.1 多分类问题
对于多分类问题,CART算法可以使用以下方法扩展:
- **一对一(One-vs-One):**将多分类问题分解为多个二分类问题。
- **一对多(One-vs-All):**将多分类问题分解为多个二分类问题,每个问题将一个类别与其他所有类别进行比较。
#### 4.2.2 缺失值处理
对于缺失值处理,CART算法可以使用以下方法:
- **忽略缺失值:**将缺失值视为一个单独的类别。
- **用平均值或中位数填充缺失值:**用训练数据中相应特征的平均值或中位数填充缺失值。
- **使用缺失值指示变量:**创建一个指示变量来表示缺失值,然后将其作为决策树中的一个特征。
### 代码示例
#### 剪枝技术
```python
from sklearn.tree import DecisionTreeClassifier
from sklearn.tree import DecisionTreePruner
# 构建决策树
clf = DecisionTreeClassifier(max_depth=5)
clf.fit(X_train, y_train)
# 预剪枝
clf_pre = DecisionTreePruner(clf, max_depth=3)
clf_pre.prune()
# 后剪枝
clf_post = DecisionTreePruner(clf)
clf_post.prune(X_test, y_test)
```
#### 超参数优化
```python
from sklearn.model_selection import GridSearchCV
# 定义超参数网格
param_grid = {'max_depth': [3, 5, 7],
'min_samples_split': [2, 5, 10],
'min_info_gain': [0.0, 0.1, 0.2]}
# 网格搜索
grid_search = GridSearchCV(DecisionTreeClassifier(), param_grid, cv=5)
grid_search.fit(X_train, y_train)
# 获取最佳超参数
best_params = grid_search.best_params_
```
#### 多分类问题
```python
from sklearn.tree import DecisionTreeClassifier
from sklearn.tree import OneVsOneClassifier
# 构建一对一决策树
clf = OneVsOneClassifier(DecisionTreeClassifier(max_depth=3))
clf.fit(X_train, y_train)
```
#### 缺失值处理
```python
from sklearn.tree import DecisionTreeClassifier
from sklearn.impute import SimpleImputer
# 忽略缺失值
clf = DecisionTreeClassifier(missing_values='ignore')
clf.fit(X_train, y_train)
# 用平均值填充缺失值
imputer = SimpleImputer(strategy='mean')
X_train_filled = imputer.fit_transform(X_train)
clf = DecisionTreeClassifier()
clf.fit(X_train_filled, y_train)
```
# 5. CART决策树算法实战案例
### 5.1 信用风险评估
**5.1.1 数据预处理**
信用风险评估是一个常见的机器学习应用,其目的是预测借款人违约的可能性。在开始构建模型之前,需要对数据进行预处理,包括:
- **缺失值处理:**使用均值或中位数填充缺失值。
- **数据标准化:**将特征值缩放至相同范围,以避免某些特征对模型的影响过大。
- **特征选择:**使用卡方检验或信息增益等方法选择与信用风险相关的特征。
**5.1.2 模型训练和评估**
数据预处理完成后,可以使用CART算法训练模型。以下代码示例展示了如何使用Python中的scikit-learn库训练CART分类器:
```python
from sklearn.tree import DecisionTreeClassifier
# 训练数据
X_train, y_train = ...
# 创建CART分类器
clf = DecisionTreeClassifier()
# 训练模型
clf.fit(X_train, y_train)
```
训练完成后,可以使用交叉验证或保留数据集评估模型的性能。以下代码示例展示了如何使用交叉验证:
```python
from sklearn.model_selection import cross_val_score
# 交叉验证
scores = cross_val_score(clf, X_train, y_train, cv=5)
# 计算平均准确率
accuracy = scores.mean()
```
### 5.2 客户流失预测
**5.2.1 数据收集和清洗**
客户流失预测旨在识别可能流失的客户,从而采取措施挽留他们。数据收集和清洗是关键步骤,包括:
- **数据收集:**从CRM系统、交易记录和客户调查中收集数据。
- **数据清洗:**删除重复数据、处理缺失值和异常值。
- **特征工程:**创建新特征,例如客户活跃度和购买频率。
**5.2.2 模型构建和部署**
数据准备完成后,可以使用CART算法构建模型。以下代码示例展示了如何使用Python中的xgboost库训练CART回归器:
```python
import xgboost as xgb
# 训练数据
X_train, y_train = ...
# 创建CART回归器
regressor = xgb.XGBRegressor()
# 训练模型
regressor.fit(X_train, y_train)
```
训练完成后,模型可以部署到生产环境中,用于预测客户流失的可能性。部署过程通常涉及将模型打包为Web服务或移动应用程序。
# 6. CART决策树算法总结与展望**
CART决策树算法作为一种经典的机器学习算法,在数据挖掘和预测建模领域有着广泛的应用。其优点包括:
* **易于理解和解释:**决策树的结构直观,可以清晰地展示决策过程和规则。
* **不需要特征缩放:**CART算法对特征的缩放不敏感,简化了数据预处理。
* **能够处理缺失值:**CART算法提供了缺失值处理机制,可以避免数据丢失。
然而,CART算法也存在一些局限性:
* **容易过拟合:**决策树容易过拟合数据,导致模型泛化能力较差。
* **对异常值敏感:**异常值可能导致决策树的结构发生较大变化,影响模型的稳定性。
* **无法处理非线性关系:**CART算法只能捕捉线性关系,对于非线性数据可能表现不佳。
**展望**
为了克服CART算法的局限性,研究人员提出了多种改进方法,包括:
* **集成学习:**将多个决策树集成在一起,提高模型的泛化能力。
* **正则化:**通过添加正则化项来惩罚过拟合,提高模型的稳定性。
* **非线性决策树:**开发能够处理非线性关系的决策树算法,如随机森林和梯度提升树。
随着机器学习技术的不断发展,CART决策树算法仍将继续发挥重要作用,并不断得到改进和扩展,以满足更复杂的建模需求。

 百万级
高质量VIP文章无限畅学
百万级
高质量VIP文章无限畅学
 千万级
优质资源任意下载
千万级
优质资源任意下载
 C知道
免费提问 ( 生成式Al产品 )
C知道
免费提问 ( 生成式Al产品 )
0
0
相关推荐

专栏简介
本专栏深入解析 CART 决策树算法,从入门到实战,全面讲解其原理和应用。
专栏内容涵盖:
* CART 决策树算法的入门指南,帮助初学者快速理解基本概念。
* 算法原理的深入剖析,揭示其背后的数学基础和决策过程。
* 实战案例的详细演示,指导读者应用算法解决实际问题。
* 算法优缺点的全面分析,帮助读者了解其适用场景和局限性。
通过阅读本专栏,读者将全面掌握 CART 决策树算法,并能够将其应用于各种数据分析和决策制定任务。
专栏目录
最低0.47元/天 解锁专栏
买1年送3月
百万级
高质量VIP文章无限畅学
千万级
优质资源任意下载
C知道
免费提问 ( 生成式Al产品 )
最新推荐
【硬件实现】:如何构建性能卓越的PRBS生成器

# 摘要
本文全面探讨了伪随机二进制序列(PRBS)生成器的设计、实现与性能优化。首先,介绍了PRBS生成器的基本概念和理论基础,重点讲解了其工作原理以及相关的关键参数,如序列长度、生成多项式和统计特性。接着,分析了PRBS生成器的硬件实现基础,包括数字逻辑设计、FPGA与ASIC实现方法及其各自的优缺点。第四章详细讨论了基于FPGA和ASIC的PRBS设计与实现过程,包括设计方法和验
NUMECA并行计算核心解码:掌握多节点协同工作原理
# 摘要
NUMECA并行计算是处理复杂计算问题的高效技术,本文首先概述了其基础概念及并行计算的理论基础,随后深入探讨了多节点协同工作原理,包括节点间通信模式以及负载平衡策略。通过详细说明并行计算环境搭建和核心解码的实践步骤,本文进一步分析了性能评估与优化的重要性。文章还介绍了高级并行计算技巧,并通过案例研究展示了NUMECA并行计算的应用。最后,本文展望了并行计
提升逆变器性能监控:华为SUN2000 MODBUS数据优化策略

# 摘要
逆变器作为可再生能源系统中的关键设备,其性能监控对于确保系统稳定运行至关重要。本文首先强调了逆变器性能监控的重要性,并对MODBUS协议进行了基础介绍。随后,详细解析了华为SUN2000逆变器的MODBUS数据结构,阐述了数据包基础、逆变器的注册地址以及数据的解析与处理方法。文章进一步探讨了性能数据的采集与分析优化策略,包括采集频率设定、异常处理和高级分析技术。
小红书企业号认证必看:15个常见问题的解决方案

# 摘要
本文系统地介绍了小红书企业号的认证流程、准备工作、认证过程中的常见问题及其解决方案,以及认证后的运营和维护策略。通过对认证前准备工作的详细探讨,包括企业资质确认和认证材料
FANUC面板按键深度解析:揭秘操作效率提升的关键操作
# 摘要
FANUC面板按键作为工业控制中常见的输入设备,其功能的概述与设计原理对于提高操作效率、确保系统可靠性及用户体验至关重要。本文系统地介绍了FANUC面板按键的设计原理,包括按键布局的人机工程学应用、触觉反馈机制以及电气与机械结构设计。同时,本文也探讨了按键操作技巧、自定义功能设置以及错误处理和维护策略。在应用层面,文章分析了面板按键在教育培训、自动化集成和特殊行业中的优化策略。最后,本文展望了按键未来发展趋势,如人工智能、机器学习、可穿戴技术及远程操作的整合,以及通过案例研究和实战演练来提升实际操作效率和性能调优。
# 关键字
FANUC面板按键;人机工程学;触觉反馈;电气机械结构
【UML类图与图书馆管理系统】:掌握面向对象设计的核心技巧
# 摘要
本文旨在探讨面向对象设计中UML类图的应用,并通过图书馆管理系统的需求分析、设计、实现与测试,深入理解UML类图的构建方法和实践。文章首先介绍了UML类图基础,包括类图元素、关系类型以及符号规范,并详细讨论了高级特性如接口、依赖、泛化以及关联等。随后,文章通过图书馆管理系统的案例,展示了如何将UML类图应用于需求分析、系统设计和代码实现。在此过程中,本文强调了面向对象设计原则,评价了UML类图在设计阶段
【虚拟化环境中的SPC-5】:迎接虚拟存储的新挑战与机遇
# 摘要
本文旨在全面介绍虚拟化环境与SPC-5标准,深入探讨虚拟化存储的基础理论、存储协议与技术、实践应用案例,以及SPC-5标准在虚拟化环境中的应用挑战。文章首先概述了虚拟化技术的分类、作用和优势,并分析了不同架构模式及SPC-5标准的发展背景。随后
硬件设计验证中的OBDD:故障模拟与测试的7大突破
# 摘要
OBDD(有序二元决策图)技术在故障模拟、测试生成策略、故障覆盖率分析、硬件设计验证以及未来发展方面展现出了强大的优势和潜力。本文首先概述了OBDD技术的基础知识,然后深入探讨了其在数字逻辑故障模型分析和故障检测中的应用。进一步地,本文详细介绍了基于OBDD的测试方法,并分析了提高故障覆盖率的策略。在硬件设计验证章节中,本文通过案例分析,展示了OBDD的构建过程、优化技巧及在工业级验证中的应用。最后,本文展望了OBDD技术与机器学习等先进技术的融合,以及OBDD工具和资源的未来发展趋势,强调了OBDD在AI硬件验证中的应用前景。
# 关键字
OBDD技术;故障模拟;自动测试图案生成
海康威视VisionMaster SDK故障排除:8大常见问题及解决方案速查
# 摘要
本文全面介绍了海康威视VisionMaster SDK的使用和故障排查。首先概述了SDK的特点和系统需求,接着详细探讨了
资源上传下载、课程学习等过程中有任何疑问或建议,欢迎提出宝贵意见哦~我们会及时处理!
点击此处反馈


专栏目录
最低0.47元/天 解锁专栏
买1年送3月
百万级
高质量VIP文章无限畅学
千万级
优质资源任意下载
C知道
免费提问 ( 生成式Al产品 )