重采样:机器学习中数据增强的核心技术,深入理解数据增强
发布时间: 2024-07-08 00:32:08 阅读量: 116 订阅数: 33 

# 1. 重采样:数据增强的核心技术**
重采样是一种强大的数据增强技术,通过对现有数据集进行有目的的采样,生成新的数据集。它在机器学习中至关重要,可以有效解决数据不足和过拟合问题。重采样技术包括随机重采样和自助重采样,它们具有不同的原理和统计学意义。
随机重采样是一种有放回的采样方法,这意味着每个样本都有可能被多次选中。它可以生成与原始数据集大小相同的新的数据集,并保留原始数据的分布。自助重采样是一种无放回的采样方法,这意味着每个样本只能被选中一次。它通常用于生成比原始数据集更小的新的数据集,但可以提供更稳定的结果。
# 2. 重采样理论基础
### 2.1 重采样的原理和类型
重采样是一种从原始数据集中有放回或无放回地随机抽取样本的技术。它旨在创建新的数据集,这些数据集具有与原始数据集相似的统计特性,但又具有不同的个体数据点。
#### 2.1.1 随机重采样
随机重采样是一种有放回的抽样方法,这意味着每个数据点都有可能被多次选择到新的数据集中。这会导致新的数据集与原始数据集具有相同的样本量和分布。
#### 2.1.2 自助重采样
自助重采样是一种无放回的抽样方法,这意味着每个数据点只能被选择一次到新的数据集中。这会导致新的数据集的样本量小于原始数据集,并且分布略有不同。
### 2.2 重采样的统计学意义
重采样在统计学中具有重要的意义,因为它可以用于:
#### 2.2.1 置信区间和假设检验
重采样可以用来计算置信区间和进行假设检验。通过从原始数据集中重复抽取样本,我们可以估计总体参数(如均值或方差)的分布。
#### 2.2.2 样本分布和抽样误差
重采样还可以帮助我们了解样本分布和抽样误差。通过观察从原始数据集中抽取的不同样本,我们可以评估样本统计量(如均值或方差)的变异性。
# 3.1 数据增强原理
#### 3.1.1 数据扩充和多样化
重采样在机器学习中主要用于数据增强,其原理是通过对现有数据集进行有目的的采样,生成新的数据样本,从而扩充和多样化数据集。数据增强可以有效解决机器学习模型训练过程中数据不足的问题,提高模型的泛化能力。
#### 3.1.2 过拟合和欠拟合的缓解
过拟合是指机器学习模型在训练集上表现良好,但在新数据上表现不佳。欠拟合是指模型在训练集和新数据上都表现不佳。重采样可以通过生成

 百万级
高质量VIP文章无限畅学
百万级
高质量VIP文章无限畅学
 千万级
优质资源任意下载
千万级
优质资源任意下载
 C知道
免费提问 ( 生成式Al产品 )
C知道
免费提问 ( 生成式Al产品 )
0
0
相关推荐

专栏简介
重采样专栏深入探讨了重采样在机器学习中的重要性,作为一种数据增强技术,它可以提升模型性能和泛化能力。专栏涵盖了重采样的基础知识、应用、挑战、误区和最佳实践,并提供了实际案例和高级应用,展示了重采样在解决数据不平衡、提升模型可解释性和可扩展性方面的强大作用。此外,专栏还探讨了重采样在机器学习中的自动化、集成和优化,为读者提供了全面了解重采样在机器学习中应用的指南。
专栏目录
最低0.47元/天 解锁专栏
买1年送1年
百万级
高质量VIP文章无限畅学
千万级
优质资源任意下载
C知道
免费提问 ( 生成式Al产品 )
最新推荐
R语言在遗传学研究中的应用:基因组数据分析的核心技术
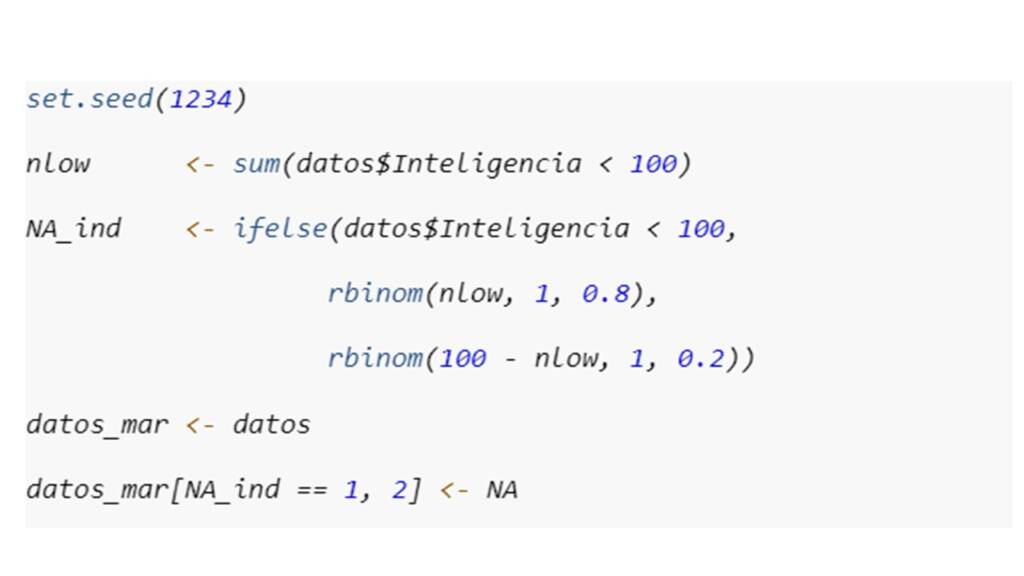
# 1. R语言概述及其在遗传学研究中的重要性
## 1.1 R语言的起源和特点
R语言是一种专门用于统计分析和图形表示的编程语言。它起源于1993年,由Ross Ihaka和Robert Gentleman在新西兰奥克兰大学创建。R语言是S语言的一个实现,具有强大的计算能力和灵活的图形表现力,是进行数据分析、统计计算和图形表示的理想工具。R语言的开源特性使得它在全球范围内拥有庞大的社区支持,各种先
【R语言热力图解读实战】:复杂热力图结果的深度解读案例
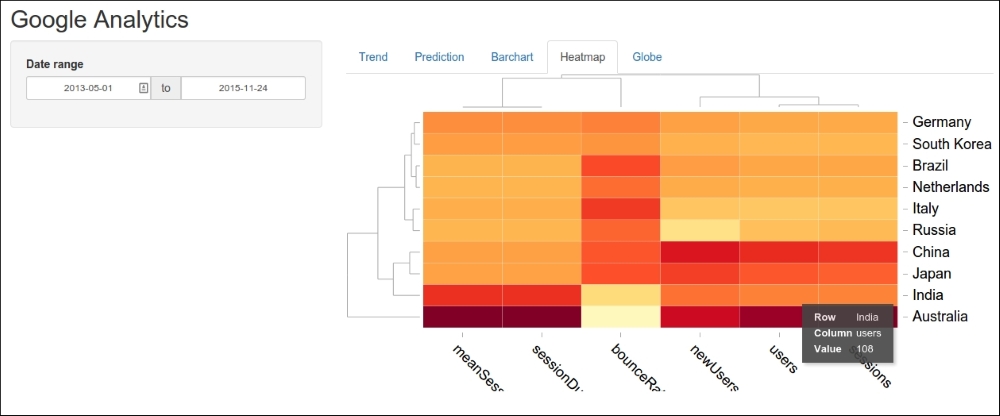
# 1. R语言热力图概述
热力图是数据可视化领域中一种重要的图形化工具,广泛用于展示数据矩阵中的数值变化和模式。在R语言中,热力图以其灵活的定制性、强大的功能和出色的图形表现力,成为数据分析与可视化的重要手段。本章将简要介绍热力图在R语言中的应用背景与基础知识,为读者后续深入学习与实践奠定基础。
热力图不仅可以直观展示数据的热点分布,还可以通过颜色的深浅变化来反映数值的大小或频率的高低,
【R语言高级用户必读】:rbokeh包参数设置与优化指南
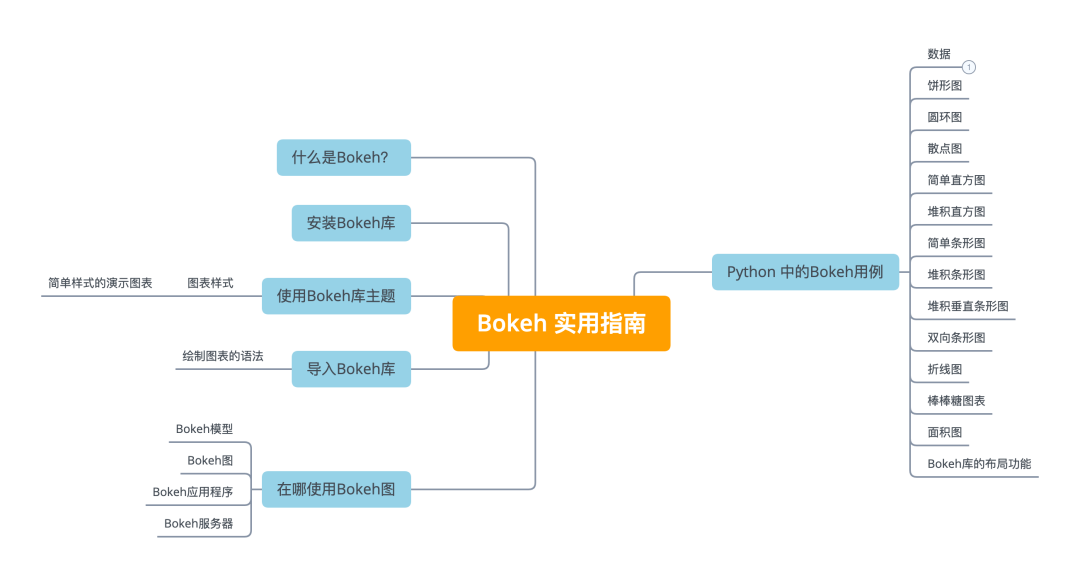
# 1. R语言和rbokeh包概述
## 1.1 R语言简介
R语言作为一种免费、开源的编程语言和软件环境,以其强大的统计分析和图形表现能力被广泛应用于数据科学领域。它的语法简洁,拥有丰富的第三方包,支持各种复杂的数据操作、统计分析和图形绘制,使得数据可视化更加直观和高效。
## 1.2 rbokeh包的介绍
rbokeh包是R语言中一个相对较新的可视化工具,它为R用户提供了一个与Python中Bokeh库类似的
【R语言图表演示】:visNetwork包,揭示复杂关系网的秘密

# 1. R语言与visNetwork包简介
在现代数据分析领域中,R语言凭借其强大的统计分析和数据可视化功能,成为了一款广受欢迎的编程语言。特别是在处理网络数据可视化方面,R语言通过一系列专用的包来实现复杂的网络结构分析和展示。
visNetwork包就是这样一个专注于创建交互式网络图的R包,它通过简洁的函数和丰富
【R语言与Hadoop】:集成指南,让大数据分析触手可及

# 1. R语言与Hadoop集成概述
## 1.1 R语言与Hadoop集成的背景
在信息技术领域,尤其是在大数据时代,R语言和Hadoop的集成应运而生,为数据分析领域提供了强大的工具。R语言作为一种强大的统计计算和图形处理工具,其在数据分析领域具有广泛的应用。而Hadoop作为一个开源框架,允许在普通的
Highcharter包创新案例分析:R语言中的数据可视化,新视角!

# 1. Highcharter包在数据可视化中的地位
数据可视化是将复杂的数据转化为可直观理解的图形,使信息更易于用户消化和理解。Highcharter作为R语言的一个包,已经成为数据科学家和分析师展示数据、进行故事叙述的重要工具。借助Highcharter的高级定制
【R语言网络图数据过滤】:使用networkD3进行精确筛选的秘诀
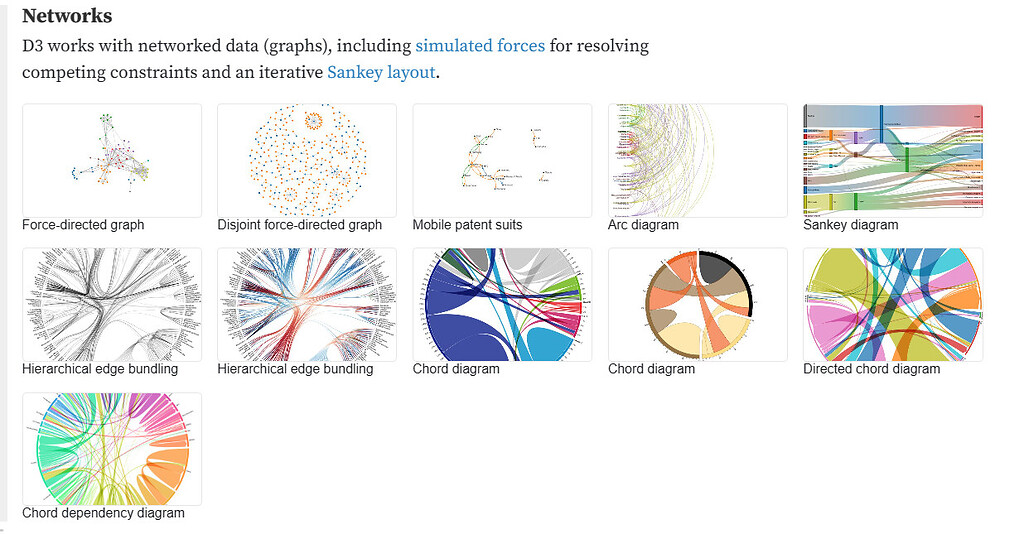
# 1. R语言与网络图分析的交汇
## R语言与网络图分析的关系
R语言作为数据科学领域的强语言,其强大的数据处理和统计分析能力,使其在研究网络图分析上显得尤为重要。网络图分析作为一种复杂数据关系的可视化表示方式,不仅可以揭示出数据之间的关系,还可以通过交互性提供更直观的分析体验。通过将R语言与网络图分析相结合,数据分析师能够更
【大数据环境】:R语言与dygraphs包在大数据分析中的实战演练
# 1. R语言在大数据环境中的地位与作用
随着数据量的指数级增长,大数据已经成为企业与研究机构决策制定不可或缺的组成部分。在这个背景下,R语言凭借其在统计分析、数据处理和图形表示方面的独特优势,在大数据领域中扮演了越来越重要的角色。
## 1.1 R语言的发展背景
R语言最初由罗伯特·金特门(Robert Gentleman)和罗斯·伊哈卡(Ross Ihaka)在19
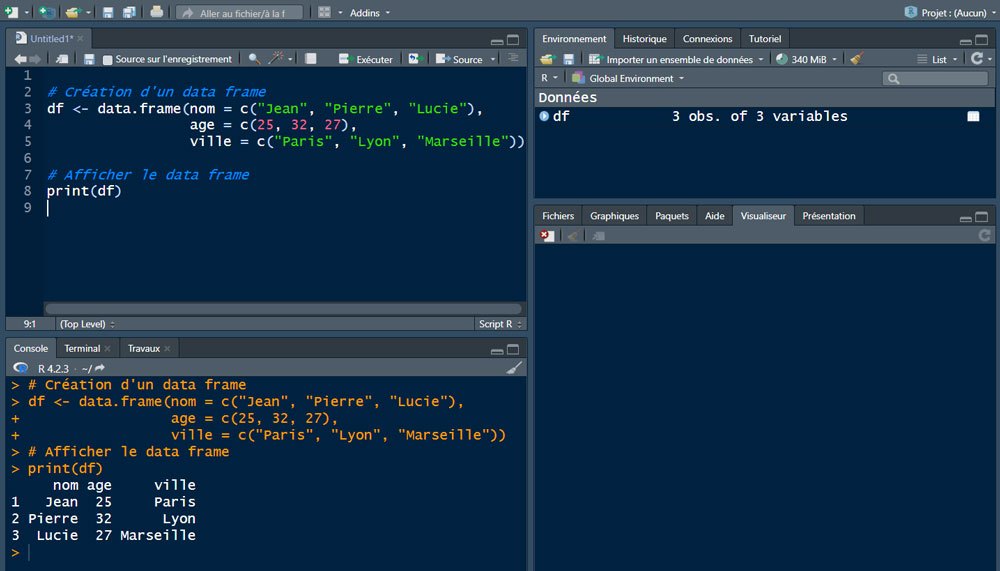
【R语言交互式数据探索】:DataTables包的实现方法与实战演练

# 1. R语言交互式数据探索简介
在当今数据驱动的世界中,R语言凭借其强大的数据处理和可视化能力,已经成为数据科学家和分析师的重要工具。本章将介绍R语言中用于交互式数据探索的工具,其中重点会放在DataTables包上,它提供了一种直观且高效的方式来查看和操作数据框(data frames)。我们会
【R语言交互式应用开发】:shiny包使用全攻略,构建个性化web应用
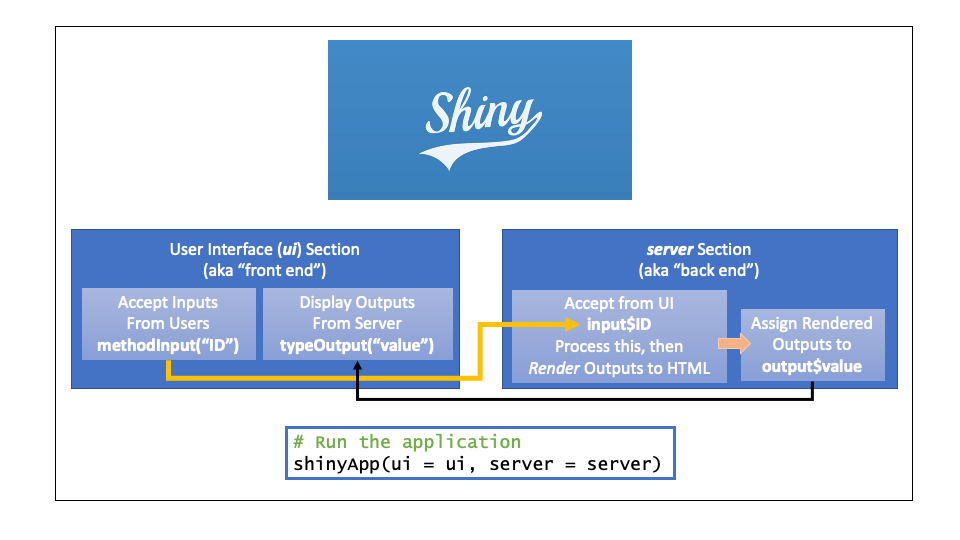
# 1. Shiny包概述与安装配置
Shiny是R语言的一个强大的Web应用框架,允许开发者以R语言来快速构建交互式的数据可视化Web应用。本章节将介绍Shiny的基本概念,并指导如何在您的系统上进行安装配置。
## 1.1 Shiny简介
Shiny的出现极大地简化了R语言用户发布Web应用的流程。无论是在数据科学领域还是统计分析领域,Shiny都扮演着至关重要的角色。它提
资源上传下载、课程学习等过程中有任何疑问或建议,欢迎提出宝贵意见哦~我们会及时处理!
点击此处反馈


专栏目录
最低0.47元/天 解锁专栏
买1年送1年
百万级
高质量VIP文章无限畅学
千万级
优质资源任意下载
C知道
免费提问 ( 生成式Al产品 )