Python图形化网络数据可视化:拓扑工具使用手册
发布时间: 2024-09-11 16:06:44 阅读量: 203 订阅数: 81 
# 1. Python图形化网络数据可视化的概念和作用
## 1.1 图形化网络数据可视化的概述
在信息技术不断进步的今天,数据可视化已成为一个重要的研究和应用领域。图形化网络数据可视化是将抽象的网络数据以直观、形象的方式展现出来,帮助用户快速理解数据所蕴含的信息。Python,作为一种广泛使用的编程语言,提供了一系列图形化工具,如Matplotlib、Seaborn等,这些工具可以将复杂的数据转换为易于理解的图表和图形,大大提高了数据分析的效率。
## 1.2 图形化网络数据可视化的重要性
网络数据往往具有高度的复杂性和动态性,传统的数据分析方法很难直观展现其内在的模式和关联。图形化网络数据可视化技术的作用在于,它不仅能够揭示数据的结构,还可以辅助发现数据中的异常、趋势和相关性,为网络管理和安全决策提供科学依据。此外,它在提升用户体验、辅助科研发现和商业决策等方面都起到了不可替代的作用。
## 1.3 Python在图形化网络数据可视化中的优势
Python在图形化网络数据可视化方面的优势主要体现在其强大的社区支持和丰富的第三方库。这些库不仅功能全面,涵盖了数据处理、图表绘制和交互式可视化等多个方面,还能够轻松地与其他系统和库进行集成。另外,Python简洁易学的语法和广泛的应用场景使其成为数据科学家和开发者的首选。通过使用Python进行网络数据可视化,用户能够以较低的学习成本实现高效的可视化解决方案。
# 2. Python图形化工具的理论基础
### 2.1 Python图形化工具的基本语法和命令
#### 2.1.1 Python图形化工具的基本语法
Python作为一门强大的编程语言,在其众多库中,Tkinter库是实现图形化用户界面(GUI)的首选工具之一。Tkinter拥有丰富的小部件(widgets),例如按钮、标签、输入框等,它们可以通过简单的语法组合成复杂的用户界面。
下面是一个简单的Tkinter程序示例:
```python
import tkinter as tk
def say_hello():
print("Hello, world!")
root = tk.Tk()
root.title("Tkinter 示例")
btn_hello = tk.Button(root, text="点击我", command=say_hello)
btn_hello.pack()
root.mainloop()
```
在这个示例中,我们首先导入了`tkinter`模块,然后创建了一个简单的窗口(通过`Tk()`)并给这个窗口设置了标题。接着,我们创建了一个按钮(`Button`),并指定了按钮上显示的文本,以及点击按钮时要调用的函数(`command=say_hello`)。使用`pack()`方法将按钮添加到窗口中,并通过`mainloop()`启动事件循环。
在构建图形化界面时,通常需要定义窗口、小部件、布局及事件处理等元素,Python通过其简洁的语法能够使得这一过程变得相对简单。
#### 2.1.2 Python图形化工具的常用命令
在Python的Tkinter库中,我们常用的一些命令包括用于创建小部件的命令,如`Button`、`Label`、`Entry`等。除此之外,还有一系列用于管理小部件布局的几何管理器命令,例如`pack()`、`grid()`和`place()`。
- `pack()`:通过将小部件打包进容器来进行布局,它会自动处理对齐和边距。
- `grid()`:使用网格来组织小部件,提供了更大的灵活性来控制小部件的位置。
- `place()`:以绝对坐标的方式定位小部件,允许开发者指定小部件的确切位置。
此外,每个小部件都有其特定的属性设置方法,例如设置背景色、字体等,这些都是通过命令形式的函数来实现的。
### 2.2 Python图形化工具的数据处理
#### 2.2.1 数据的读取和解析
在Python图形化工具中,数据的读取和解析是前期准备工作的重要部分。通常,数据可以从文件、网络或数据库等多种来源获取。一旦获取数据,下一步就是解析这些数据以供可视化使用。
以下是一个从CSV文件中读取数据并解析的示例:
```python
import csv
# 打开CSV文件
with open('data.csv', mode='r') as ***
* 创建CSV阅读器
reader = csv.reader(file)
# 跳过标题行
next(reader)
# 读取每一行数据
for row in reader:
# 解析数据
print(row)
```
在这个例子中,我们使用Python的内置`csv`模块来打开和读取一个CSV文件。首先,我们创建了一个CSV阅读器,然后跳过标题行,最后循环读取每一行数据,并将其打印出来。
#### 2.2.2 数据的转换和处理
在实际应用中,通常需要对原始数据进行一些转换和处理才能用于可视化。数据处理包括数据清洗、类型转换、数据汇总和聚合等多种操作。
假设我们需要对上述CSV文件中读取的数据进行统计分析,可以使用Python的`collections`模块中的`Counter`类来计算数据的频率:
```python
from collections import Counter
# 假设CSV文件的某列包含需要计数的数据
with open('data.csv', mode='r') as ***
***
*** 跳过标题行
data = [row[1] for row in reader] # 选择第二列数据
counter = Counter(data)
print(counter)
```
在这段代码中,我们从CSV文件的第二列提取数据,并使用`Counter`对数据中的元素出现频率进行计数,最后打印出每个元素的频率。
### 2.3 Python图形化工具的网络数据可视化
#### 2.3.1 网络数据可视化的原理
网络数据可视化是对网络结构和网络流量等抽象数据的图形表示。可视化可以揭示模式、趋势和异常等特征,帮助人们理解和分析数据。网络数据可视化通常基于图论的原理,图由节点和边组成,节点代表实体,边代表实体间的某种关系。
在Python中,我们可以利用图论库如`networkx`来创建和操作图对象,然后使用图形库如`matplotlib`来进行可视化。
下面是一个生成一个简单的网络图并可视化的例子:
```python
import networkx as nx
import matplotlib.pyplot as plt
# 创建一个图对象
G = nx.Graph()
# 添加节点
G.add_node(1)
G.add_node(2)
G.add_node(3)
# 添加边
G.add_edge(1, 2)
G.add_edge(1, 3)
# 绘制图形
nx.draw(G, with_labels=True)
plt.show()
```
这个例子创建了一个简单的无向图,并用`networkx`库来定义图的结构,然后用`matplotlib`库来绘制图。
#### 2.3.2 网络数据可视化的实现方法
实现网络数据可视化,除了使用`networkx`和`matplotlib`之外,还可以使用专门的可视化库如`Graphviz`、`Gephi`或`Cytoscape`等,它们提供了更多的定制化选项。
下面是一个使用`Graphviz`进行网络数据可视化的例子:
首先安装Graphviz库:
```bash
pip install graphviz
```
然后编写代码创建一个网络图并保存为图像文件:
```python
from graphviz import Digraph
dot = Digraph(comment='The Test Table')
dot.node('A', 'Alice')
dot.node('B', 'Bob')
dot.node('C', 'Charlie')
dot.edges(['AB', 'AC'])
dot.render('test-output/test-table.gv', view=True)
```
上述代码创建了一个有向图,并将图渲染为一个图像文件。`render`方法会调用Graphviz的可执行文件,将图输出为PNG格式的图像。
### 2.3.3 网络数据可视化的实现方法
网络数据可视化涉及数据的采集、处理、分析,最终转换成可视化的图形。这里,我们将探讨使用Python进行网络数据可视化的几种主要方法。
1. **使用`networkx`和`matplotlib`**
`networkx`是一个功能强大的图论和网络分析工具,它提供了创建、操作以及绘制网络图的接口。与`matplotlib`结合,`networkx`可以将复杂的数据关系以图形的形式直观展现出来。
```python
import networkx as nx
import matplotlib.pyplot as plt
G = nx.Graph() # 创建一个空的无向图
G.add_edge(1, 2)
G.add_edge(1, 3)
G.add_edge(2, 4)
G.add_edge(3, 4)
pos = nx.spring_layout(G) # 获得图形布局
nx.draw(G, pos, with_labels=True, node_color='skyblue', edge_color='black') # 绘制图形
plt.show() # 显示图形
```
2. **使用`Graphviz`**
`Graphviz` 是一个图形可视化软

 百万级
高质量VIP文章无限畅学
百万级
高质量VIP文章无限畅学
 千万级
优质资源任意下载
千万级
优质资源任意下载
 C知道
免费提问 ( 生成式Al产品 )
C知道
免费提问 ( 生成式Al产品 )
0
0
相关推荐

专栏简介
本专栏深入探讨了 Python 中的拓扑图数据结构,提供了一系列全面的文章,涵盖从基础概念到高级应用。通过深入浅出的讲解和丰富的案例分析,读者可以掌握拓扑数据结构的原理、构建方法、算法应用和实际场景中的运用。从网络可视化到流网络建模,从树和森林的实现到网络拓扑优化,专栏全面剖析了拓扑图数据结构的各个方面,为读者提供了一份宝贵的学习资源。此外,专栏还介绍了图数据库 Neo4j 与 Python 的结合,以及 Python 拓扑数据结构在并发处理和动态网络分析中的应用,帮助读者拓展对这一重要数据结构的理解和应用范围。
专栏目录
最低0.47元/天 解锁专栏
买1年送3月
百万级
高质量VIP文章无限畅学
千万级
优质资源任意下载
C知道
免费提问 ( 生成式Al产品 )
最新推荐
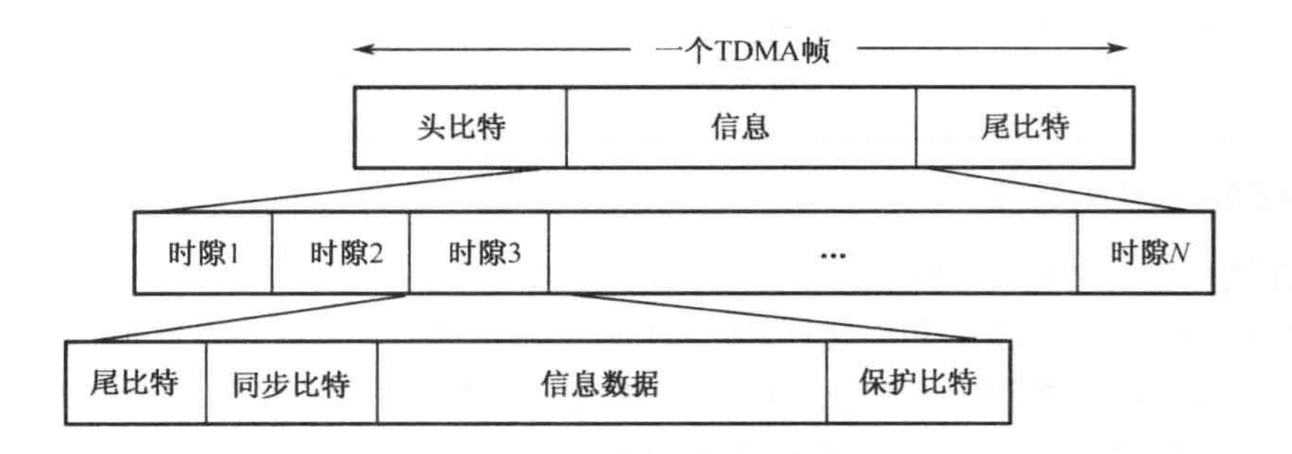
GSM中TDMA调度挑战全解:技术细节与应对策略
# 摘要
本文全面概述了时分多址(TDMA)技术在GSM网络中的应用与机制,并深入探讨了其调度角色,包括TDMA调度原理、GSM网络中的实施细节,频谱效率及网络容量问题。同时,针对TDMA调度面临的技术挑战,如信号干扰、移动性管理、安全性及隐私问题进行了详细分析。通过案例分析,本文还展示了TDMA调度的实际部署和优化策略,并探讨了未来的展望。
单播传输局限性大破解:解决方法与优化技巧全揭秘
# 摘要
单播传输虽然在数据通信中广泛使用,但其局限性在大规模网络应用中逐渐显现,如带宽利用率低和资源消耗大。多播传输技术作为一种有效的替代方案,能够优化网络资源使用,提高带宽利用率和传输效率,降低网络延迟和成本。本文详细探讨了多播传输的原理、优势、部署、配置技巧以及优化策略,强调了其在实际应用中的成功案例,并对多播技术的未来发展趋势进行了展望,包括新兴技术的应用和跨域多播的挑战。同时,本文还关注了多播安全
SX-DSV03244_R5_0C参数调优实战:专家级步骤与技巧

# 摘要
SX-DSV03244_R5_0C参数调优是提高系统性能与响应速度、优化资源利用的关键技术。本文首先概述了参数调优的目标与重要性,随后详细探讨了相关理论基础,包括性能评估指标、调优方法论及潜在风险。接着,本文
Unicode编码表维护秘籍:如何应对更新与兼容性挑战

# 摘要
Unicode编码作为全球文本信息统一表示的基础,对信息交换和存储有着深远的影响。本文首先介绍了Unicode编码的基本概念、历史发展,然后深入探讨了Unicode编码表的理论基础,包括其结构、分类、更新机制以及兼容性问题。接着,本文详细描述了Unicode编码表的维护实践,涉及更新工具、兼容性测试
【Python效率提升】:优化你的日期计算代码,让它飞起来
# 摘要
本文全面介绍了Python日期时间模块的使用、性能优化以及高级处理技巧。首先概述了日期时间模块的基本构成和功能,随后深入探讨了日期时间对象
【云原生安全终极指南】:构建坚不可摧的云环境的15个必备技巧

# 摘要
随着云计算的普及,云原生安全问题日益凸显,成为行业关注的焦点。本文首先概述了云原生安全的总体框架,随后深入探讨了云安全的理论基础,包括架构原则、关键概念以及云服务模型的安全考量。接着,本文详细介绍了云原生安全实践中的安全配置管理、身份验证与访问控制、数据加密与密钥管理等方面。此外,本文还对云原
【双闭环直流电机控制系统:全攻略】:从原理到应用,掌握PID调速核心
# 摘要
双闭环直流电机控制系统是现代工业自动化领域中不可或缺的一部分,其精确控制与稳定性对工业生产质量及效率具有重大影响。本论文首先介绍了双闭环直流电机控制系统的基本概念及其与单闭环控制系统的对比。接着,深入探讨了直流电机的工作原理、数学模型以及控制理论基础,包括系统稳定性分析和PID控制器的原理与应用。在设计与实现方面,论文详细阐述了双闭环控制系
欧陆590直流调速器故障快速诊断与排除指南:实用技巧大公开

# 摘要
本文系统介绍了欧陆590直流调速器的基本结构、故障诊断基础及实用技巧。首先概述了欧陆590直流调速器的硬件组成与软件配置,并对电气、机械以及控制系统常见故障进行了分类分析。接着,详细介绍了故障诊断工具的选择使用、故障代码解读、信号追踪分析以及参数设置对于故障排除的重要性。通过对典型故障案例的分析,分享了现场快速处理技巧和预防措施。文章最后探讨了高级故障排除技术,包括
倒计时线报机制深度解析:秒杀活动公平性的技术保障

# 摘要
倒计时线报机制作为在线秒杀等高并发场景的关键技术,确保了公平性和一致性,对于提升用户体验和系统性能至关重要。本文首先介绍了倒计时线报机制的理论基础,包括其定义、原理、公平性保障以及与一致性模型的关系。接着,详细探讨了该机制的技术实现,涵盖实时更新同步、请求处理与流量控制、数据一致性保障
【性能优化实战】:Linux环境下IBM X3850服务器性能调优全攻略

# 摘要
本文系统地介绍了Linux服务器性能调优的方法和实践,涵盖了从硬件资源监控到应用程序优化的多个层面。首先概述了Linux服务器性能调优的重要性,随后详细分析了硬件监控、系统负载分析及优化策略。在系统级性能调优策略章节,本研究深入探讨了内核参数调整、系统服务管理及文件系
资源上传下载、课程学习等过程中有任何疑问或建议,欢迎提出宝贵意见哦~我们会及时处理!
点击此处反馈


专栏目录
最低0.47元/天 解锁专栏
买1年送3月
百万级
高质量VIP文章无限畅学
千万级
优质资源任意下载
C知道
免费提问 ( 生成式Al产品 )