聚类分析在机器学习中的作用与挑战:全面解读与应对策略
发布时间: 2024-09-07 13:27:40 阅读量: 164 订阅数: 83 

机器学习与算法及源码:聚类分析.zip
# 1. 聚类分析的理论基础
聚类分析是数据挖掘中的一种重要技术,旨在将数据集中的样本划分为若干个类别,使得同一类中的样本相似度较高,而不同类的样本相似度较低。本章将从聚类的定义和类型出发,详细介绍聚类分析的理论基础。
## 1.1 聚类分析的定义和类型
聚类分析,又称为群集分析,是通过分析数据的内部结构,将相似的数据点聚集到一起的一种无监督学习方法。它的核心是根据数据之间的相似性(或距离)将它们分组成不同的群集。聚类分析的类型主要分为硬聚类和软聚类。硬聚类中,每个数据点只属于一个聚类,例如K-means算法;软聚类则允许一个数据点属于多个聚类,具有一定的隶属度,比如模糊C均值算法。
## 1.2 聚类分析的应用场景
聚类分析广泛应用于多个领域,包括市场细分、社交网络分析、图像分割、生物学分类等。例如,在市场分析中,聚类可以帮助企业识别不同的客户群体,为精准营销提供基础;在生物学中,聚类可用于组织各类生物样本,理解物种的演化关系。
## 1.3 聚类分析的评价指标
聚类分析的效果通常通过聚类的内部和外部指标来评估。内部指标如轮廓系数可以衡量样本与其所在聚类的紧密程度及与其他聚类的分离程度;外部指标如Rand Index则需要预先给定数据的“真实”分类,评价聚类结果与“真实”分类的一致性。通过这些指标,研究人员可以对聚类算法进行比较和优化。
# 2. 聚类算法的深入探讨
聚类分析是数据挖掘中的一项核心任务,它试图将一组样本根据某些特征划分为若干个类别(或称为簇),使得同一类别中的样本相似度高,而不同类别中的样本相似度低。随着应用场景的复杂化和技术的发展,对聚类算法的研究愈发深入,产生了多种不同的聚类技术。本章节将深入探讨层次聚类方法、部分聚类方法以及高维聚类面临的挑战和策略。
## 2.1 层次聚类方法
层次聚类方法试图根据数据点之间的相似度构建一个层次的分解,最终形成一个数据点的树状结构(即层次结构)。层次聚类可以分为凝聚方法和分裂方法。
### 2.1.1 聚类的基本思想和过程
层次聚类首先将每个数据点视作一个单独的簇,然后逐步地按照某种策略合并簇,直到所有的数据点都被合并到一个簇为止,或者达到预先设定的簇的数量为止。合并的标准通常基于簇之间最不相似的成员之间的距离,例如使用最短距离法(Single Linkage)或最长距离法(Complete Linkage)。
### 2.1.2 聚类中的距离度量
距离度量是决定层次聚类效果的关键因素之一。常见的距离度量方法包括欧几里得距离、曼哈顿距离、杰卡德距离和余弦相似度等。每种度量方法对于数据空间中的距离有不同的解释,因此在实际应用中需要根据数据特性选择合适的度量方法。
### 2.1.3 层次聚类的算法实现
层次聚类算法的实现流程如下:
1. 初始化:假设每个数据点自身就是一个簇。
2. 计算距离:计算所有簇对之间的距离。
3. 合并簇:根据距离度量和合并策略,找出距离最近的簇对并合并。
4. 更新距离矩阵:更新合并后的簇距离矩阵。
5. 重复步骤2到4,直到达到预定的簇数量或所有数据点合并为一个簇。
```python
from scipy.cluster.hierarchy import dendrogram, linkage, fcluster
import matplotlib.pyplot as plt
# 示例数据集
data = [[x_i] for x_i in range(10)]
# 计算层次聚类
Z = linkage(data, method='single')
# 绘制树状图
plt.figure(figsize=(25, 10))
plt.title('Hierarchical Clustering Dendrogram')
dendrogram(Z, labels=data)
plt.show()
# 根据预设的簇数量进行划分
clusters = fcluster(Z, t=3, criterion='maxclust')
print(clusters)
```
## 2.2 部分聚类方法
部分聚类方法,如K-means和密度聚类,相较于层次聚类在处理大数据集时具有更高的效率。它们通常会预先设定簇的数量,然后迭代地寻找最佳的聚类结果。
### 2.2.1 K-means算法原理与优化
K-means算法是最常用的部分聚类方法之一。它的核心思想是:首先随机选取K个数据点作为初始簇中心,然后按照最近邻原则将每个数据点分配到最近的簇中心,最后计算每个簇内所有点的均值,更新簇中心。重复上述过程直到满足收敛条件。
```python
from sklearn.cluster import KMeans
import numpy as np
# 示例数据集
X = np.array([[1, 2], [1, 4], [1, 0],
[10, 2], [10, 4], [10, 0]])
# K-means算法实现
kmeans = KMeans(n_clusters=2, random_state=0).fit(X)
labels = kmeans.labels_
centroids = kmeans.cluster_centers_
print(labels)
print(centroids)
```
在实际应用中,K-means算法有许多优化策略,例如:K-means++选择初始中心、使用不同的距离度量以及尝试不同的初始中心等等。此外,K-means对于初始中心的选取非常敏感,不同的初始中心可能导致结果的巨大差异。
### 2.2.2 密度聚类的原理与应用
密度聚类算法,如DBSCAN(Density-Based Spatial Clustering of Applications with Noise),依据数据点的邻域密度来进行聚类。在DBSCAN中,核心点是被其他点密集包围的点;边界点是指在核心点邻域内,但同时也在稀疏区域的点;噪声点则不被任何核心点的邻域包含。
```python
from sklearn.cluster import DBSCAN
from sklearn.datasets import make_moons
import matplotlib.pyplot as plt
# 生成示例数据集
X, _ = make_moons(n_samples=300, noise=0.05, random_state=42)
# DBSCAN聚类实现
dbscan = DBSCAN(eps=0.2, min_samples=5).fit(X)
labels = dbscan.labels_
# 绘制结果
plt.scatter(X[:, 0], X[:, 1], c=labels, cmap='viridis', marker='o')
plt.title('DBSCAN Clustering')
plt.show()
```
### 2.2.3 模型和基于图的聚类技术
模型聚类方法,如Gaussian Mixture Model(GMM),通过假设簇服从某种分布(如正态分布),然后根据概率密度来分配簇。基于图的聚类技术将数据点映射到图结构上,然后通过图划分来实现聚类。
## 2.3 高维聚类挑战与策略
在处理高维数据时,传统的聚类算法往往会遇到效率低和性能下降的问题,这是因为高维空间的稀疏性和距离度量失效等问题导致的。
### 2.3.1 高维空间数据的聚类问题
高维数据通常会导致距离度量失效,

 百万级
高质量VIP文章无限畅学
百万级
高质量VIP文章无限畅学
 千万级
优质资源任意下载
千万级
优质资源任意下载
 C知道
免费提问 ( 生成式Al产品 )
C知道
免费提问 ( 生成式Al产品 )
0
0
相关推荐

专栏简介
本专栏深入探讨了聚类分析技术,提供了一系列全面的文章,涵盖了聚类算法的精髓、基础知识和实用技巧。专栏内容包括 K-means 算法、层次聚类、DBSCAN、高斯混合模型、谱聚类等算法的详细介绍和实战指南。此外,专栏还探讨了聚类算法的性能比较、大数据聚类分析、异常检测与聚类分析融合、聚类结果评估等重要方面。通过实战技巧和案例分享,专栏展示了聚类分析在社交网络分析、生物信息学、图像处理、推荐系统、客户细分和群体行为研究等领域的广泛应用。本专栏旨在为读者提供全面深入的聚类分析知识,助力其在实际应用中有效利用该技术。
专栏目录
最低0.47元/天 解锁专栏
买1年送3月
百万级
高质量VIP文章无限畅学
千万级
优质资源任意下载
C知道
免费提问 ( 生成式Al产品 )
最新推荐
【QT基础入门】:QWidgets教程,一步一个脚印带你上手
# 摘要
本文全面介绍了Qt框架的安装配置、Widgets基础、界面设计及进阶功能,并通过一个综合实战项目展示了这些知识点的应用。首先,文章提供了对Qt框架及其安装配置的简要介绍。接着,深入探讨了Qt Widgets,包括其基本概念、信号与槽机制、布局管理器等,为读者打下了扎实的Qt界面开发基础。文章进一步阐述了Widgets在界面设计中的高级用法,如标准控件的深入使用、资源文件和样式表的应用、界面国际化处理。进阶功能章节揭示了Qt对话框、多文档界面、模型/视图架构以及自定义控件与绘图的强大功能。最后,实战项目部分通过需求分析、问题解决和项目实现,展示了如何将所学知识应用于实际开发中,包括项目
数学魔法的揭秘:深度剖析【深入理解FFT算法】的关键技术

# 摘要
快速傅里叶变换(FFT)是信号处理领域中一项关键的数学算法,它显著地降低了离散傅里叶变换(DFT)的计算复杂度。本文从FFT算法的理论基础、实现细节、在信号处理中的应用以及编程实践等多方面进行了详细讨论。重点介绍了FFT算法的数学原理、复杂度分析、频率域特性,以及常用FFT变体和优化技术。同时,本文探讨了FFT在频谱分析、数字滤波器设计、声音和图像处理中的实
MTK-ATA技术入门必读指南:从零开始掌握基础知识与专业术语

# 摘要
MTK-ATA技术作为一种先进的通信与存储技术,已经在多个领域得到广泛应用。本文首先介绍了MTK-ATA技术的概述和基础理论,阐述了其原理、发展以及专业术语。随后,本文深入探讨了MTK-ATA技术在通信与数据存储方面的实践应用,分析了其在手机通信、网络通信、硬盘及固态存储中的具体应用实例。进一步地,文章讲述了MTK-ATA技术在高
优化TI 28X系列DSP性能:高级技巧与实践(性能提升必备指南)

# 摘要
本文系统地探讨了TI 28X系列DSP性能优化的理论与实践,涵盖了从基础架构性能瓶颈分析到高级编译器技术的优化策略。文章深入研究了内存管理、代码优化、并行处理以及多核优化,并展示了通过调整电源管理和优化RTOS集成来进一步提升系统级性能的技巧。最后,通过案例分析和性能测试验证了优化
【提升响应速度】:MIPI接口技术在移动设备性能优化中的关键作用

# 摘要
移动设备中的MIPI接口技术是实现高效数据传输的关键,本论文首先对MIPI接口技术进行了概述,分析了其工作原理,包括MIPI协议栈的基础、信号传输机制以及电源和时钟管理。随后探讨了MIPI接口在移动设备性能优化中的实际应用,涉及显示和摄像头性能提升、功耗管理和连接稳定性。最后,本文展望了MIPI技术的未来趋势,分析了新兴技术标准的进展、性能优化的创新途径以及当前面临的技术挑战。本论文旨在为移动
PyroSiM中文版高级特性揭秘:精通模拟工具的必备技巧(专家操作与界面布局指南)

# 摘要
PyroSiM是一款功能强大的模拟软件,其中文版提供了优化的用户界面、高级模拟场景构建、脚本编程、自动化工作流以及网络协作功能。本文首先介绍了PyroSiM中文版的基础配置和概览,随后深入探讨了如何构建高级模拟场景,包括场景元素组合、模拟参数调整、环境动态交互仿真、以及功能模块的集成与开发。第三章关注用户界面的优化
【云计算优化】:选择云服务与架构设计的高效策略
# 摘要
本文系统地探讨了云计算优化的各个方面,从云服务类型的选择到架构设计原则,再到成本控制和业务连续性规划。首先概述了云计算优化的重要性和云服务模型,如IaaS、PaaS和SaaS,以及在选择云服务时应考虑的关键因素,如性能、安全性和成本效益。接着深入探讨了构建高效云架构的设计原则,包括模块化、伸缩性、数据库优化、负载均衡策略和自动化扩展。在优化策
性能飙升指南:Adam's CAR性能优化实战案例
# 摘要
随着软件复杂性的增加,性能优化成为确保应用效率和响应速度的关键环节。本文从理论基础出发,介绍了性能优化的目的、指标及技术策略,并以Adam's CAR项目为例,详细分析了项目性能需求及优化目标。通过对性能分析与监控的深入探讨,本文提出了性能瓶颈识别和解决的有效方法,分别从代码层面和系统层面展示了具体的优化实践和改进措施。通过评估优化效果,本文强调了持续监控和分析的重要性,以实现性能的持续改进和提升。
#
【Oracle服务器端配置】:5个步骤确保PLSQL-Developer连接稳定性
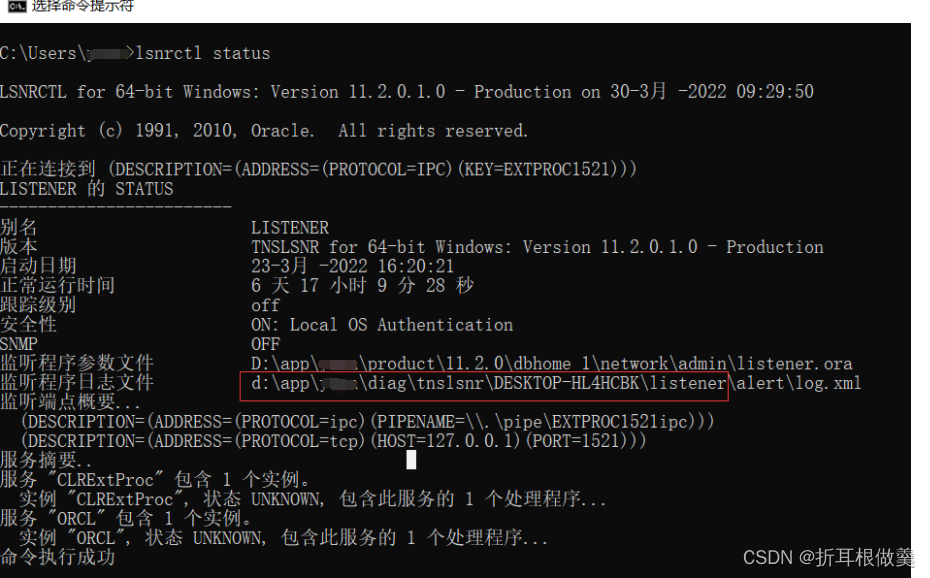
# 摘要
本文对Oracle数据库服务器端配置进行了详细阐述,涵盖了网络环境、监听器优化和连接池管理等方面。首先介绍
资源上传下载、课程学习等过程中有任何疑问或建议,欢迎提出宝贵意见哦~我们会及时处理!
点击此处反馈


专栏目录
最低0.47元/天 解锁专栏
买1年送3月
百万级
高质量VIP文章无限畅学
千万级
优质资源任意下载
C知道
免费提问 ( 生成式Al产品 )