非监督学习的评估方法:评估聚类算法的性能
发布时间: 2024-09-02 10:26:06 阅读量: 33 订阅数: 51 

聚类算法性能评估指标:轮廓系数与SSE解析.md
# 1. 非监督学习与聚类算法简介
聚类分析是数据挖掘和机器学习领域中一种重要的非监督学习方法,旨在将数据集中的样本根据其相似性分组成多个类别。非监督学习与监督学习不同,它不需要预先标记的训练数据来指导学习过程。聚类算法为处理大量未标记数据提供了解决方案,广泛应用于客户细分、市场分析、社交网络分析、生物信息学等多个领域。
聚类算法的基本思想是将样本点归入彼此间相似度高而与其他类中样本点相似度低的类别。算法根据不同的距离度量标准,如欧几里得距离、曼哈顿距离或余弦相似性,将样本点分组。聚类方法可以分为层次聚类、基于划分的聚类、基于密度的聚类、基于网格的聚类等。
由于聚类是一个无指导的过程,因此没有统一的"正确答案"。不同的聚类算法可能会产生不同的结果,而且如何评价聚类结果的有效性一直是一个挑战。因此,深入了解和掌握聚类算法的评估方法对于优化聚类模型,提高聚类结果的准确性和可靠性至关重要。
# 2. 聚类算法的性能评估理论
在探索聚类算法的世界中,我们不可避免地需要一些工具来衡量我们的工作。这就是为什么性能评估在聚类算法的发展中扮演着不可或缺的角色。本章将深入探讨聚类算法性能评估的理论,分析如何评价聚类结果的好坏以及如何判断聚类算法的稳定性。
## 2.1 聚类算法的性能评估指标
当我们谈到性能评估,不可避免地要从评估指标说起。聚类算法的性能评估指标大致可以分为三类:内部指标、外部指标和相对指标。这三类指标从不同的角度提供了评估聚类结果的手段。
### 2.1.1 内部指标:轮廓系数与Davies-Bouldin指数
内部指标是指只用到数据本身的信息来评估聚类结果的质量。在这里,我们将详细讨论两个常用的内部指标:轮廓系数和Davies-Bouldin指数。
#### 轮廓系数
轮廓系数(Silhouette Coefficient)是评估聚类结果好坏的一个指标,它的取值范围在-1到1之间。轮廓系数接近1表示聚类效果很好,接近-1则表示聚类效果很差。轮廓系数的计算公式为:
\[ s = \frac{1}{n} \sum_{i=1}^{n} \frac{b(i) - a(i)}{\max \{a(i), b(i)\}} \]
这里,\( a(i) \)是样本\( i \)到同簇中其他样本的平均距离,而\( b(i) \)是样本\( i \)到最近簇中所有样本的平均距离。轮廓系数考虑了簇的紧凑度和分离度。
```python
from sklearn.metrics import silhouette_score
from sklearn.cluster import KMeans
import numpy as np
# 假设 data 是我们用来聚类的数据集
# 使用 KMeans 进行聚类
kmeans = KMeans(n_clusters=3, random_state=42)
clusters = kmeans.fit_predict(data)
# 计算轮廓系数
silhouette_avg = silhouette_score(data, clusters)
print(f"The average silhouette_score is : {silhouette_avg}")
```
#### Davies-Bouldin指数
Davies-Bouldin指数(Davies-Bouldin Index)是另一种广泛使用的内部指标,它基于类间的离散度和类内的紧凑度的比值。该指数的值越小表示聚类结果越好。其计算方式为:
\[ DB = \frac{1}{n} \sum_{i=1}^{n} \max_{j \neq i} \left( \frac{\sigma_i + \sigma_j}{d(c_i, c_j)} \right) \]
其中,\( \sigma_i \) 是簇\( i \)的样本到簇中心的平均距离,\( d(c_i, c_j) \)是两个簇中心之间的距离。
接下来,我们通过一个例子来展示如何在Python中使用Davies-Bouldin指数:
```python
from sklearn.metrics import davies_bouldin_score
from sklearn.cluster import KMeans
# 假设 data 是我们用来聚类的数据集
# 使用 KMeans 进行聚类
kmeans = KMeans(n_clusters=3, random_state=42)
kmeans.fit(data)
# 计算Davies-Bouldin指数
db_index = davies_bouldin_score(data, kmeans.labels_)
print(f"The Davies-Bouldin index is : {db_index}")
```
### 2.1.2 外部指标:Rand指数与Jaccard系数
与内部指标不同,外部指标需要一个参考标签(通常是真实的分类标签)来评估聚类结果。在本小节,我们将探讨两种常用的外部指标:Rand指数和Jaccard系数。
#### Rand指数
Rand指数(Rand Index)是衡量聚类结果与参考标签相似度的指标。它的计算公式如下:
\[ RI = \frac{a+b}{a+b+c+d} \]
其中,\( a \) 是两个样本在同一簇中的次数,\( b \) 是两个样本在不同簇中的次数,\( c \) 是两个样本在同一簇但不在同一参考簇中的次数,\( d \) 是两个样本在不同簇且不在同一参考簇中的次数。
接下来我们给出如何在Python中实现Rand指数的示例:
```python
from sklearn.metrics import rand_score
# 假设 true_labels 是真实的分类标签,clusters 是我们的聚类结果
# rand_score 是用来计算Rand指数的函数
rand_index = rand_score(true_labels, clusters)
print(f"The Rand index is : {rand_index}")
```
#### Jaccard系数
Jaccard系数是另一个衡量聚类结果与参考标签相似度的指标,它在聚类问题中尤其有用,因为它主要关注簇之间的交集。其计算公式为:
\[ J = \frac{|X \cap Y|}{|X \cup Y|} \]
其中,\( X \) 和 \( Y \) 分别是聚类结果和参考标签中的簇。
下面是用Python来实现Jaccard系数的代码示例:
```python
from sklearn.metrics import jaccard_similarity_score
# 假设 clusters 是聚类结果,true_labels 是真实的分类标签
# jaccard_similarity_score 用来计算Jaccard系数
jaccard_score = jaccard_similarity_score(true_labels, clusters)
print(f"The Jaccard similarity score is : {jaccard_score}")
```
### 2.1.3 相对指标:调整兰德系数与Dice系数
相对指标是介于内部指标和外部指标之间的一种评估方式。它们试图综合参考标签的信息和聚类算法的性质。本小节中,我们将分析调整兰德系数和Dice系数。
#### 调整兰德系数
调整兰德系数(Adjusted Rand Index, ARI)是Rand指数的一个调整版,通过减少随机选择聚类结果时的期望相似度来提供一个校正的相似度度量。其计算方式为:
\[ ARI = \frac{RI - E[RI]}{\max(RI) - E[RI]} \]
其中,\( RI \)是 Rand指数,\( E[RI] \)是随机分配标签时的期望 Rand指数。
下面是使用Python实现ARI的代码示例:
```python
from sklearn.metrics import adjusted_rand_score
# 假设 true_labels 是真实的分类标签,clusters 是我们的聚类结果
# adjusted_rand_score 是用来计算ARI的函数
adjusted_rand = adjusted_rand_score(true_labels, clusters)
print(f"The Adjusted Rand index is : {adjusted_rand}")
```
#### Dice系数
Dice系数(Dice Coefficient)是一个集合相似度度量函数,常用于衡量两个样本集的相似性。其计算公式为:
\[ D = \frac{2|X \cap Y|}{|X| + |Y|} \]
在聚类评估中,Dice系数可以帮助我们了解两个聚类簇的相似度。
下面是用Python来实现Dice系数的代码示例:
```python
from sklearn.metrics import fowlkes_mallows_score
# 假设 clusters 是聚类结果,true_labels 是真实的分类标签
# fowlkes_mallows_score 可以用来计算Dice系数
dice_score = fowlkes_mallows_score(true_labels, clusters)
print(f"The Dice similarity score is : {dice_score}")
```
## 2.2 聚类算法的稳定性评估
在进行聚类分析时,稳定性是指当输入数据发生小的扰动时,聚类结果是否保持一致。稳定性是评估聚类算法性能的一个重要方面。
### 2.2.1 稳定性的概念与重要性
稳定性(stability)是衡量聚类算法在面对不同数据集时,聚类结果一致性

 百万级
高质量VIP文章无限畅学
百万级
高质量VIP文章无限畅学
 千万级
优质资源任意下载
千万级
优质资源任意下载
 C知道
免费提问 ( 生成式Al产品 )
C知道
免费提问 ( 生成式Al产品 )
0
0
相关推荐

专栏简介
本专栏深入探讨了机器学习模型评估指标,从基础概念到高级技术。它涵盖了广泛的主题,包括:
* 准确率、召回率和 F1 分数等基本指标
* ROC 曲线和 AUC 值等可视化工具
* 处理不平衡数据集的策略
* 优化分类模型性能的阈值调整技巧
* 交叉验证和贝叶斯信息准则(BIC)等模型泛化能力评估方法
* 模型解释性与评估之间的平衡
* 聚类分析的内部评估指标
* 集成学习中评估多个模型组合的技术
通过深入理解这些指标和技术,数据科学家可以全面评估机器学习模型的性能,做出明智的决策,并优化模型以获得最佳结果。
专栏目录
最低0.47元/天 解锁专栏
买1年送3月
百万级
高质量VIP文章无限畅学
千万级
优质资源任意下载
C知道
免费提问 ( 生成式Al产品 )
最新推荐
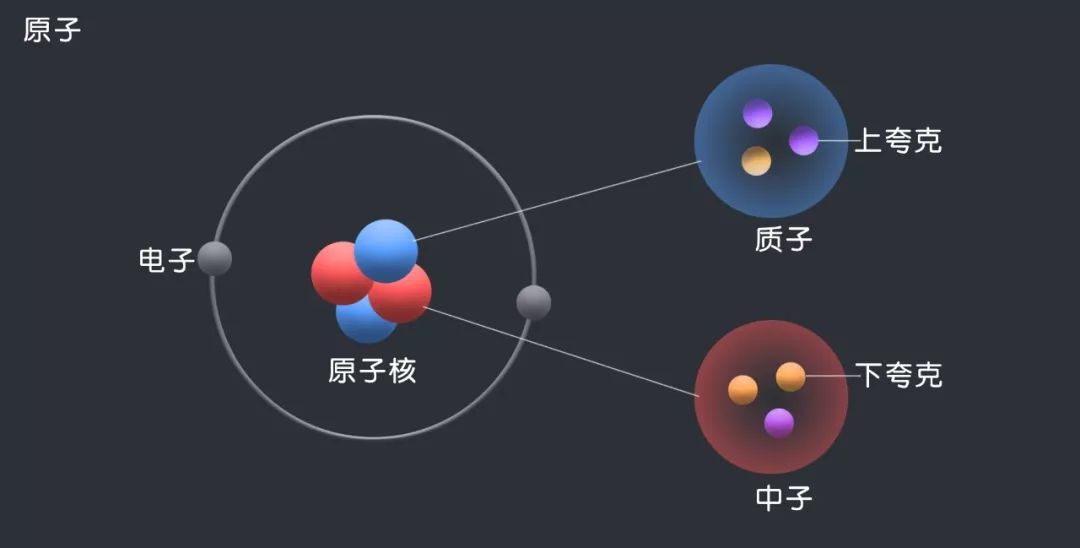
【Chem3D视觉艺术】:氢原子在分子模型中脱颖而出的秘诀

# 摘要
本论文探讨了氢原子在分子模型中的关键角色,以及如何通过化学绘图与视觉艺术将其实现更有效的可视化。从氢原子的化学特性到3D分子模型中的视觉表现,本文深入分析了氢原子在化学反应和生物大分子中的作用,并提供了使用Chem3D软件创建和优化氢原子模型的详细指南。此外,论文
动态面板性能优化攻略:5个步骤,打造极致流畅交互体验
# 摘要
本文全面探讨了动态面板性能优化的策略和方法。首先,介绍了性能基准测试的重要性和分析流程,阐述了如何选择合适的测试工具,进行性能瓶颈的识别与诊断。其次,针对前端性能,详细讨论了减少HTTP请求、资源优化、缓存策略、代码优化等技术的应用。在动态面板渲染优化方面,强调了渲染机制对性能的影响,并提出了提升渲染性能的技术手段,如DOM操作优化和动画效果的改进。进一步,文章分析了后端服务和数据库性能优化
数字通信原理深度剖析:Proakis第五版,理论与实践的融合之道
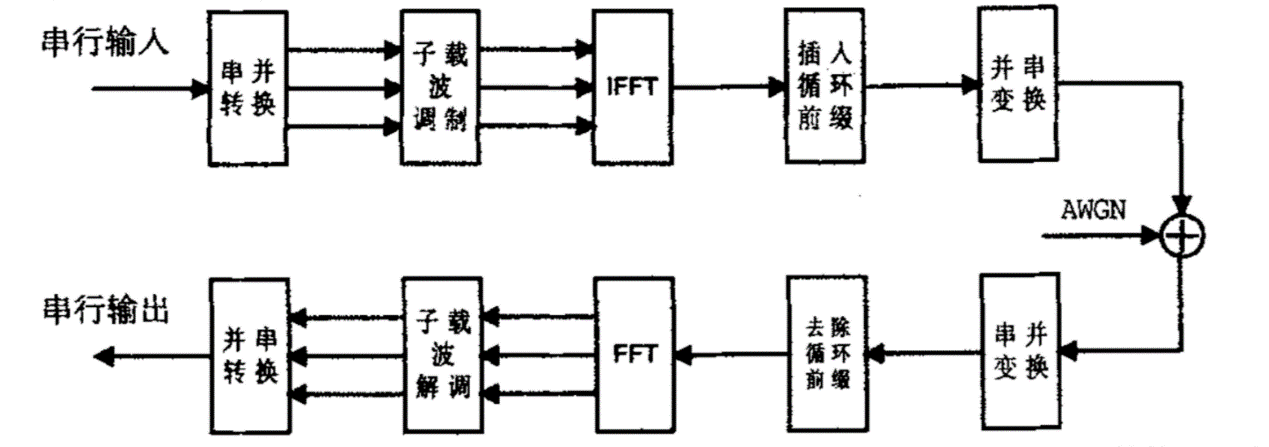
# 摘要
本文综合分析了数字通信系统的基础理论、传输技术、差错控制编码以及实际设计与实现。首先概述了数字通信系统的基本概念,接着深入探讨了数字信号的表示、分类及其调制解调技术。文章还涉及了差错控制编码与信号检测的基本原理,并通过信息论基础和熵的
天线理论进阶宝典:第二版第一章习题全面解读
# 摘要
本文全面探讨了天线理论的基础知识、设计、计算、测试、优化以及实践应用。首先概述了天线理论的基本概念和原理,然后详细介绍了不同类型的天线(线性、面、阵列)及其特点,包括各自的辐射特性和参数。接着,本文阐述了天线设计的原理和方法,计算工具的应用,以及设计案例和实践技巧。在此基础上,文章深入讨论了天线性能测试和优化的方法和软件应用。最后,本文预测了天线理论的未来发展,分析
零基础学习Flac3D:构建流体计算环境的终极指南
# 摘要
本文全面介绍了Flac3D在地质工程领域的应用,涵盖了从基础入门到高级应用的各个方面。首先,本文为读者提供了Flac3D的入门基础知识,然后详细阐述了网格划分的技巧及其在确保计算精度方面的重要性。之后,转向流体计算理论,深入探讨了流体动力学基础、模型选择与应用以及数值方法。通过案例分析,展示了如何在实际操作中构建、执行、监控及分析流体模型。文章还探讨了高级应用,例如多相流与流固耦合计算,以及流体计算的参数敏
【解锁Quartus II 9.0编译秘籍】:5大技巧优化编译效率
# 摘要
Quartus II 9.0是一款广泛使用的FPGA设计软件,它提供了一套完整的编译流程,从设计输入到最终生成用于编程FPGA的文
【构建高效网格图】:网格计算入门与实战演练

# 摘要
网格计算作为一种集成、共享和协调使用地理上分布的计算资源的先进计算模式,已在多个领域展示了其强大的计算能力与资源优化潜力。本文首先从网格计算的概念和架构入手,概述了其理论基础和关键技术,包括资源管理、数据传输及安全隐私保护等方面。接着,文章转入实践技巧的讨论,详细介绍了如何搭建网格计算环境、开发计算任务以及性能监控。通过实际案例分析,本文展示了网格计算在实践中的应用,并提供了一个实战演练示例,从需求到部署的全
【MySQL复制机制】:主从同步原理与实践精讲

# 摘要
MySQL复制技术是数据库管理中的核心组成部分,它通过二进制日志记录主服务器上的数据变更,并将这些变更同步到一个或多个从服务器,从而实现数据的备份、负载均衡和高可用性。本文详细介绍了MySQL复制的理论基础,包括复制原理、关键技术如SQL线程与IO线程的工作机制,以及数据一致性保证机制。同时,实践操作指南部分提供了详细配置步骤和故障排查方法,而高级复制技术与场景应用章节则探讨了链式复制、级联复制、G
【Qt信号与槽实战】:曲线图交互的秘诀
# 摘要
本文系统地探讨了Qt框架中信号与槽机制的基础知识、在曲线图控件中的应用,以及交互实操和高级应用。首先介绍了信号与槽的工作原理和自定义信号槽函数的重要性。接着,通过曲线图控件的案例,展示了预定义信号介绍、用户交互响应实现及高级特性的应用。第三章深入曲线图交互实战,包括基本操作、信号与槽的实现以及动态效果的增强。第四章对信号与槽的深入理解和高级应用进行了讨论,涵盖了自定义对象的连接和多线程环境下的安全使用。最后一章通
资源上传下载、课程学习等过程中有任何疑问或建议,欢迎提出宝贵意见哦~我们会及时处理!
点击此处反馈


专栏目录
最低0.47元/天 解锁专栏
买1年送3月
百万级
高质量VIP文章无限畅学
千万级
优质资源任意下载
C知道
免费提问 ( 生成式Al产品 )