特征工程实践案例:10个成功故事揭示特征构建的力量
发布时间: 2024-09-03 20:51:21 阅读量: 142 订阅数: 55 

设计思维:理论与实践.pdf
# 1. 特征工程在机器学习中的重要性
## 1.1 机器学习中的特征工程概述
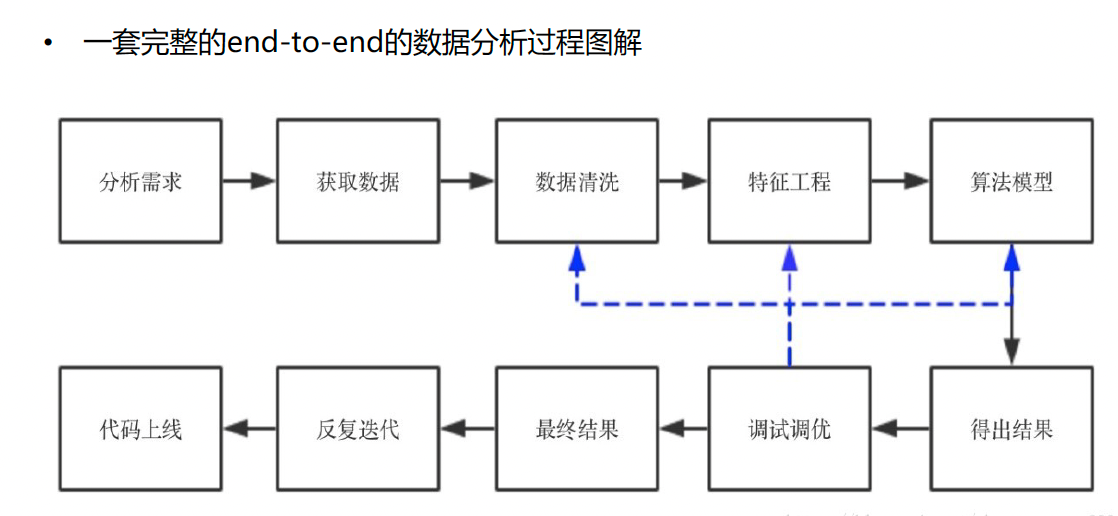
在机器学习的工作流程中,特征工程是一个决定模型性能的关键步骤。特征工程的目的是从原始数据中提取有用的信息,以提高预测模型的准确性和效率。这一过程涉及对数据的理解、转换和优化,以便更好地满足算法的需求。
## 1.2 特征工程对模型的影响
高质量的特征可以显著提升模型的性能,而糟糕的特征可能会导致模型表现不佳。特征工程可以改善数据的表达方式,提高模型对关键信号的识别能力。例如,通过正确的特征组合,可以减少噪声的影响,增强信号的区分度,进而提升模型的泛化能力。
## 1.3 特征工程的实践意义
在实际应用中,特征工程往往需要反复的试验和调整。对特征的深入理解和创新的提取技巧,可以挖掘出数据中隐含的重要信息。此外,特征工程还可以帮助我们理解数据生成的过程和背后的原因,从而对业务决策提供更有价值的洞见。
通过下一章,我们将进一步探索数据预处理与特征提取的策略和方法,深入了解如何将原始数据转变为可供机器学习模型处理的高质量特征。
# 2. ```
# 第二章:数据预处理与特征提取技巧
## 2.1 数据清洗的策略和方法
数据清洗是特征工程中不可或缺的一步,它涉及到识别和修正数据集中存在的不一致性和错误。通过对数据的清洗,可以显著提升模型的性能和准确性。
### 2.1.1 缺失值的处理
缺失值是数据集中常见的问题,可能是由于数据录入错误、传输问题或其他因素造成。正确处理缺失值对于维持数据质量和模型性能至关重要。
- 删除含有缺失值的记录:简单但可能导致数据大量丢失。
- 填充缺失值:使用统计方法,如平均值、中位数或众数填充。
- 预测缺失值:利用机器学习模型,如随机森林或K最近邻算法。
**代码示例:**
```python
import pandas as pd
# 假设df是包含缺失数据的DataFrame
df = pd.DataFrame({
'A': [1, 2, np.nan, 4],
'B': [5, np.nan, np.nan, 8],
'C': [9, 10, 11, 12]
})
# 使用均值填充缺失值
df_filled = df.fillna(df.mean())
# 使用众数填充缺失值
df_mode_filled = df.fillna(df.mode().iloc[0])
```
在上述代码中,`fillna`函数用于填充缺失值。首先使用均值填充,然后使用众数填充。选择使用均值或众数取决于数据的分布和业务场景。
### 2.1.2 异常值的识别与处理
异常值是与数据集中其他数据点显著不同的观测值。它们可能是由于错误、变异或离群现象造成的。
- Z-Score方法:通过计算数据点与其均值的标准差倍数来识别异常值。
- IQR方法:基于四分位数范围来检测异常值。
- 基于模型的方法:使用聚类算法如K-means来识别离群点。
**代码示例:**
```python
from scipy import stats
# 使用Z-Score识别异常值
z_scores = np.abs(stats.zscore(df[['A', 'B', 'C']]))
df['z_scores'] = z_scores.sum(axis=1)
df_outliers = df[df['z_scores'] > 3] # 通常Z>3被认为是异常值
# 使用IQR识别异常值
Q1 = df[['A', 'B', 'C']].quantile(0.25)
Q3 = df[['A', 'B', 'C']].quantile(0.75)
IQR = Q3 - Q1
df_outliers_IQR = df[~((df[['A', 'B', 'C']] >= (Q1 - 1.5 * IQR)) & (df[['A', 'B', 'C']] <= (Q3 + 1.5 * IQR))).all(axis=1)]
```
在上述代码中,我们首先计算了每个数据点的Z-Score并识别出异常值,然后计算了四分位数范围并识别了异常值。异常值处理后,我们可以选择删除这些记录或对其进行适当的处理。
## 2.2 特征提取的核心技术
特征提取是从原始数据中提取有用信息的过程,以便模型可以更容易地发现数据中的模式和关系。
### 2.2.1 主成分分析(PCA)
PCA是一种常用的降维技术,它通过正交变换将一组可能相关的变量转换为一组线性不相关的变量,这些新变量称为主成分。
**代码示例:**
```python
from sklearn.decomposition import PCA
# 假设X是数据矩阵
pca = PCA(n_components=2) # 保留两个主成分
X_pca = pca.fit_transform(X)
# 查看解释的方差比率
print(pca.explained_variance_ratio_)
```
在上面的代码中,`PCA`函数用于将数据矩阵`X`转换为两个主成分。`explained_variance_ratio_`提供了每个主成分解释的方差量。
### 2.2.2 自编码器在特征提取中的应用
自编码器是一种无监督学习算法,通过训练网络压缩数据然后解压,可以学习到数据的有效表示。
**代码示例:**
```python
from keras.layers import Input, Dense
from keras.models import Model
input_img = Input(shape=(input_dim,))
encoded = Dense(encoding_dim, activation='relu')(input_img)
decoded = Dense(input_dim, activation='sigmoid')(encoded)
autoencoder = Model(input_img, decoded)
***pile(optimizer='adam', loss='binary_crossentropy')
autoencoder.fit(X, X, epochs=50, batch_size=256, shuffle=True, validation_data=(X_test, X_test))
# 提取编码后的特征
encoded_imgs = encoder.predict(X)
```
在这个例子中,自编码器被训练来学习数据的有效表示,并将输入数据编码为较小的编码,然后再重构为原始数据。编码后的数据可以作为新的特征集合使用。
## 2.3 特征缩放和归一化
特征缩放和归一化是特征工程中的关键步骤,旨在消除不同特征间由于量纲差异带来的影响。
### 2.3.1 标准化与归一化的区别和应用
标准化(Standardization)将数据按属性(列)进行缩放,使其拥有均值为0和标准差为1的分布。
- 标准化适用于大多数机器学习算法,特别是对距离计算敏感的算法。
- 归一化(Normalization)将数据按比例缩放,将数据缩放到[0, 1]区间。
**代码示例:**
```python
from sklearn.preprocessing import StandardScaler, MinMaxScaler
# 标准化
scaler_standard = StandardScaler()
X_standard = scaler_standard.fit_transform(X)
# 归一化
scaler_minmax = MinMaxScaler()
X_minmax = scaler_minmax.fit_transform(X)
```
在上述代码中,`StandardScaler`和`MinMaxScaler`分别用于标准化和归一化数据。根据不同的需求选择适当的方法是很重要的。
### 2.3.2 缩放技术的实际案例分析
在实际应用中,根据数据的分布和模型的需求选择合适的缩放方法至关重要。
- 使用标准化处理数据,当数据具有异常值时,可能需要进行异常值处理后再标准化。
- 归一化通常用于人工神经网络、k-最近邻和基于树的算法。
**案例分析代码示例:**
```python
import numpy as np
# 模拟数据集,包含异常值
X = np.array([[1, 200], [2, 300], [3, 400]])
scaler = StandardScaler()
X_scaled = scaler.fit_transform(X)
# 计算标准化后的均值和标准差
print("均值:", scaler.mean_)
print("标准差:", np.sqrt(scaler.var_))
```
在上面的例子中,我们首先创建了一个包含异常值的数据集,然后使用`StandardScaler`进行了标准化处理。通过查看处理后的均值和标准差,我们可以确认数据已被成功标准化。
```
# 3. 特征选择与优化方法
特征选择和优化是特征工程的关键环节,它们在减少模型复杂性、提高预测准确率以及增强模型泛化能力方面起着至关重要的作用。本章节将深入探讨特征选择的方法、实战案例以及优化策略。
## 3.1 常用特征选择技术
在特征选择过程中,算法需要区分哪些特征对模型的预测能力更为重要。常见方法包括过滤法、包裹法和嵌入法,它们各有特点和适用场景。
### 3.1.1 过滤法
过滤法是一种独立于模型的选择方法,它通过评估特征和目标变量之间的关系来选择特征。这一类方法通常依赖于统计测试,如卡方检验、ANOVA和相关系数。
```python
from sklearn.feature_selection import SelectKBest, chi2
# 使用卡方检验进行特征选择
X_new = SelectKBest(chi2, k=10).fit_transform(X, y)
```
在这段代码中,我们使用了`SelectKBest`类和`chi2`方法从原始特征集合中选择出10个特征。`SelectKBest`类允许我们基于不同准则来选择特征,而`chi2`是专门用于分类问题的卡方检验,它可以帮助我们识别哪些特征与目标变量之间存在较强的相关性。
### 3.1.2 包裹法
包裹法涉及使用一个外部模型来评估特征组合的好坏。最著名的包裹法是递归特征消除(RFE)。
```python
from sklearn.feature_selection import RFE
from sklearn.ensemble import RandomForestClassifier
# 使用RFE和随机森林进行特征选择
estimator = RandomForestClassifier(n_estimators=100)
selector = RFE(estimator, n_features_to_select=10, step=1)
X_new = selector.fit_transform(X, y)
```
上述代码中,我们使用了`RFE`类来包装随机森林分类器,通过逐步剔除特征的方式来选择最重要的10个特征。递归特征消除是一种强大的特征选择技术,因

 百万级
高质量VIP文章无限畅学
百万级
高质量VIP文章无限畅学
 千万级
优质资源任意下载
千万级
优质资源任意下载
 C知道
免费提问 ( 生成式Al产品 )
C知道
免费提问 ( 生成式Al产品 )
0
0
相关推荐

专栏简介
特征工程在机器学习中至关重要,它通过将原始数据转换为机器学习模型可用的特征,提升模型性能。本专栏深入探讨了特征工程的各个方面,提供了实用的指南和技巧。从特征选择和缩放,到异常值处理和自然语言处理的预处理,再到时间序列的特征提取,该专栏涵盖了特征工程的方方面面。此外,它还介绍了自动化特征工程工具和框架,以及特征重要性评分和业务影响等高级主题。通过掌握这些原则和技术,数据科学家和机器学习工程师可以构建更有效、更准确的机器学习模型。
专栏目录
最低0.47元/天 解锁专栏
买1年送3月
百万级
高质量VIP文章无限畅学
千万级
优质资源任意下载
C知道
免费提问 ( 生成式Al产品 )
最新推荐
【技术教程五要素】:高效学习路径构建的5大策略
# 摘要
技术学习的本质与价值在于其能够提升个人和组织的能力,以应对快速变化的技术环境。本文探讨了学习理论的构建与应用,包括认知心理学和教育心理学在技术学习中的运用,以及学习模式从传统教学到在线学习的演变。此外,本文还关注实践技能的培养与提升,强调技术项目管理的重要性以及技术工具与资源的利用。在高效学习方法的探索与实践中,本文提出多样化的学习方法、时间管理与持续学习策略。最后,文章展望了未来技术学习面临的挑战与趋势,包括技术快速发展的挑战和人工智能在技术教育中的应用前景。
【KEBA机器人维护秘籍】:专家教你如何延长设备使用寿命
# 摘要
本文系统地探讨了KEBA机器人的维护与优化策略,涵盖了从基础维护知识到系统配置最佳实践的全面内容。通过分析硬件诊断、软件维护、系统优化、操作人员培训以及实际案例研究,本文强调了对KEBA机器人进行系统维护的重要性,并为操作人员提供了一系列技能提升和故障排除的方法。文章还展望了未来维护技术的发展趋势,特别是预测性维护和智能化技术在提升机器人性能和可靠性方面的应用前景。
# 关键字
KEBA机器人;硬件诊断;
【信号完整性优化】:Cadence SigXplorer高级使用案例分析
# 摘要
信号完整性是高速电子系统设计中的关键因素,影响着电路的性能与可靠性。本文首先介绍了信号完整性的基础概念,为理解后续内容奠定了基础。接着详细阐述了Cadence SigXplorer工具的界面和功能,以及如何使用它来分析和解决信号完整性问题。文中深入讨论了信号完整性问题的常见类型,如反射、串扰和时序问题,并提供了通过仿真模拟与实
【IRIG 106-19安全规定:数据传输的守护神】:保障您的数据安全无忧
# 摘要
本文全面概述了IRIG 106-19安全规定,并对其技术基础和实践应用进行了深入分析。通过对数据传输原理、安全威胁与防护措施的探讨,本文揭示了IRIG 106-19所确立的技术框架和参数,并详细阐述了关键技术的实现和应用。在此基础上,本文进一步探讨了数据传输的安全防护措施,包括加密技术、访问控制和权限管理,并通过实践案例
【Python数据处理实战】:轻松搞定Python数据处理,成为数据分析师!
# 摘要
随着数据科学的蓬勃发展,Python语言因其强大的数据处理能力而备受推崇。本文旨在全面概述Python在数据处理中的应用,从基础语法和数据结构讲起,到必备工具的深入讲解,再到实践技巧的详细介绍。通过结合NumPy、Pandas和Matplotlib等库,本文详细介绍了如何高效导入、清洗、分析以及可视化数据,确保读者能掌握数据处理的核心概念和技能。最后,通过一个项目实战章
Easylast3D_3.0高级建模技巧大公开:专家级建模不为人知的秘密
# 摘要
Easylast3D_3.0是一款先进的三维建模软件,广泛应用于工程、游戏设计和教育领域。本文系统介绍了Easylast3D_3.0的基础概念、界面布局、基本操作技巧以及高级建模功能。详细阐述了如何通过自定义工作空间、视图布局、基本建模工具、材质与贴图应用、非破坏性建模技术、高级表面处理、渲染技术等来提升建模效率和质量。同时,文章还探讨了脚本与自动化在建模流
PHP脚本执行系统命令的艺术:安全与最佳实践全解析

# 摘要
PHP脚本执行系统命令的能力增加了其灵活性和功能性,但同时也引入了安全风险。本文介绍了PHP脚本执行系统命令的基本概念,分析了PHP中执行系统命令
PCB设计技术新视角:FET1.1在QFP48 MTT上的布局挑战解析
# 摘要
本文详细探讨了FET1.1技术在PCB设计中的应用,特别强调了QFP48 MTT封装布局的重要性。通过对QFP48 MTT的物理特性和电气参数进行深入分析,文章进一步阐述了信号完整性和热管理在布局设计中的关键作用。文中还介绍了FET1.1在QFP48 MTT上的布局实践,从准备、执行到验证和调试的全过程。最后,通过案例研究,本文展示了FET1.1布局技术在实际应用中可能遇到的问题及解决策略,并展望了未来布
【Sentaurus仿真速成课】:5个步骤带你成为半导体分析专家

# 摘要
本文全面介绍了Sentaurus仿真软件的基础知识、理论基础、实际应用和进阶技巧。首先,讲述了Sentaurus仿真的基本概念和理论,包括半导体物理基础、数值模拟原理及材料参数的处理。然后,本文详细阐述了Sentaurus仿真
台达触摸屏宏编程初学者必备:基础指令与实用案例分析

# 摘要
本文旨在全面介绍台达触摸屏宏编程的基础知识和实践技巧。首先,概述了宏编程的核心概念与理论基础,详细解释了宏编程指令体系及数据处理方法,并探讨了条件判断与循环控制。其次,通过实用案例实践,展现了如何在台达触摸屏上实现基础交互功能、设备通讯与数据交换以及系统与环境的集成。第三部分讲述了宏编程的进阶技巧,包括高级编程技术、性能优化与调试以及特定领域的应用。最后,分析了宏编程的未来趋势,包括智能化、自动化的新趋势,开源社区与生态的贡献,以及宏编程教育与培训的现状和未来发展。
资源上传下载、课程学习等过程中有任何疑问或建议,欢迎提出宝贵意见哦~我们会及时处理!
点击此处反馈


专栏目录
最低0.47元/天 解锁专栏
买1年送3月
百万级
高质量VIP文章无限畅学
千万级
优质资源任意下载
C知道
免费提问 ( 生成式Al产品 )