大数据分析入门:从数据中提取价值
发布时间: 2024-08-21 15:06:20 阅读量: 19 订阅数: 28 

# 1. 大数据分析概述
大数据分析是指对海量、复杂和多样化的数据集进行分析,以发现隐藏的模式、趋势和见解。它在各个行业中发挥着至关重要的作用,包括金融、医疗保健、零售和制造业。
大数据分析的关键特征包括:
* **体量庞大:**数据集包含大量数据,通常以TB、PB甚至EB为单位。
* **复杂性:**数据集结构复杂,包含各种数据类型,如结构化、非结构化和半结构化数据。
* **多样性:**数据集来自多个来源,具有不同的格式和语义。
大数据分析的目的是从这些复杂的数据集中提取有价值的信息,从而帮助企业做出明智的决策,优化运营并获得竞争优势。
# 2. 大数据分析理论基础
大数据分析理论基础是理解大数据分析原理和方法的基石。本章节将深入探讨大数据特征与分类,以及大数据分析常用的方法。
### 2.1 大数据特征与分类
#### 2.1.1 4V特征
大数据通常具有以下 4V 特征:
- **Volume(体量)**:数据量巨大,动辄达到 TB、PB 甚至 EB 级别。
- **Variety(种类)**:数据类型繁多,包括结构化数据、非结构化数据和半结构化数据。
- **Velocity(速度)**:数据生成和处理速度极快,需要实时或近实时分析。
- **Value(价值)**:海量数据中蕴含着巨大的价值,需要通过分析挖掘来发现。
#### 2.1.2 大数据类型
根据数据结构和组织方式,大数据可分为以下类型:
| 数据类型 | 特征 |
|---|---|
| **结构化数据** | 数据以预定义的模式组织,如表格和数据库。 |
| **非结构化数据** | 数据没有预定义的模式,如文本、图像和视频。 |
| **半结构化数据** | 介于结构化数据和非结构化数据之间,具有部分结构,如 XML 和 JSON。 |
### 2.2 大数据分析方法
大数据分析方法主要分为以下三类:
#### 2.2.1 统计分析
统计分析是一种基于概率论和统计学的分析方法,用于从数据中提取有意义的见解。常见的方法包括:
- **描述性统计**:描述数据分布和趋势,如平均值、中位数和标准差。
- **推断性统计**:从样本数据中推断总体特征,如假设检验和回归分析。
#### 2.2.2 机器学习
机器学习是一种让计算机从数据中自动学习模式和知识的算法。常见的机器学习算法包括:
- **监督学习**:使用标记数据训练模型,用于预测或分类新数据。
- **非监督学习**:使用未标记数据发现数据中的模式和结构。
#### 2.2.3 数据挖掘
数据挖掘是一种从大量数据中提取隐藏模式和知识的过程。常见的技术包括:
- **关联规则挖掘**:发现数据中频繁出现的模式和关联关系。
- **聚类分析**:将数据点分组到具有相似特征的簇中。
- **决策树**:通过一系列决策规则将数据点分类或预测。
# 3. 大数据分析实践应用
### 3.1 数据预处理
数据预处理是数据分析过程中至关重要的一步,其目的是将原始数据转换为适合分析和建模的格式。数据预处理主要包括以下两个步骤:
#### 3.1.1 数据清洗
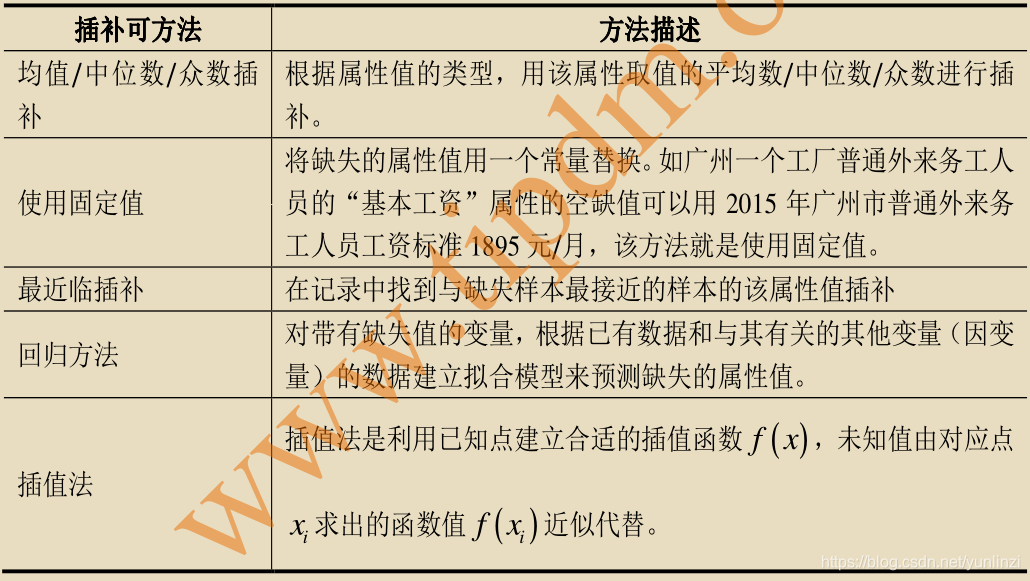
数据清洗旨在去除原始数据中的错误、缺失值和异常值。常见的清洗操作包括:
- **处理缺失值:**缺失值可以通过删除、插补或使用机器学习算法预测来处理。
- **去除异常值:**异常值是与数据集中其他值明显不同的值,可以影响分析结果。异常值可以通过统计方法或机器学习算法检测和去除。
- **数据标准化:**数据标准化将数据转换为具有相同范围和分布的格式,以方便比较和分析。
#### 3.1.2 数据转换
数据转换将数据从原始格式转换为适合分析和建模的格式。常见的转换操作包括:
- **特征工程:**特征工程是指创建或修改特征以提高模型的性能。这可能涉及特征选择、特征缩放和特征组合。
- **数据编码:**数据编码将分类变量转换为数值变量,以便机器学习算法可以处理它们。常见的编码方法包括独热编码、标签编码和二值编码。
- **数据合并:**数据合并将来自不同来源的数据集组合在一起,以创建更全面的数据集。
### 3.2 数据分析与建模
数据分析与建模是数据分析过程的核心部分,其目的是从数据中提取有意义的见解和构建预测模型。
#### 3.2.1 探索性数据分析
探索性数据分析 (EDA) 是对数据进行初步分析的过程,以了解其分布、趋势和模式。EDA 通常涉及以下步骤:
- **数据可视化:**数据可视化可以帮助识别数据中的模式和趋势。常见的可视化技术包括直方图、散点图和箱线图。
- **统计摘要:**统计摘要提供有关数据分布的信息,例如均值、中位数、标准差和方差。
- **假设检验:**假设检验用于测试有关数据分布的假设。常见的假设检验包括 t 检验、卡方检验和 ANOVA。
#### 3.2.2 预测性建模
预测性建模使用机器学习算法从数据中构建模型,以预测未来事件或结果。常见的预测性建模技术包括:
- **回归:**回归模型用于预测连续目标变量。常见的回归算法包括线性回归、逻辑回归和决策树。
- **分类:**分类模型用于预测分类目标变量。常见的分类算法包括支持向量机、随机森林和神经网络。
- **聚类:**聚类算法将数据点分组到具有相似特征的组中。常见的聚类算法包括 k 均值聚类、层次聚类和 DBSCAN。
### 3.3 数据可视化
数据可视化是将数据转换为图形或图表表示的过程,以帮助人们轻松理解和分析数据。
#### 3.3.1 数据可视化工具
有许多数据可视化工具可供选择,包括:
- **Tableau:**Tableau 是一个流行的数据可视化工具,提供交互式仪表板和图表。
- **Power BI:**Power BI 是 Microsoft 提供的数据可视化工具,与 Microsoft Excel 和其他 Office 应用程序集成。
- **Googl

 百万级
高质量VIP文章无限畅学
百万级
高质量VIP文章无限畅学
 千万级
优质资源任意下载
千万级
优质资源任意下载
 C知道
免费提问 ( 生成式Al产品 )
C知道
免费提问 ( 生成式Al产品 )
0
0
相关推荐

专栏简介
“因果推断方法与应用”专栏深入探讨了因果推断的科学方法,从揭示因果关系的指南到消除数据偏倚的技巧。它提供了实验设计指南,确保因果关系的可靠性,并展示了因果推断在医疗保健、市场营销和公共政策等领域的革命性应用。专栏还探讨了因果推断的伦理考量,强调数据的公平性和可信度。此外,它深入分析了数据库管理中的技术问题,包括表锁、死锁和索引失效,并提供了提升数据库性能的实用指南。专栏还介绍了NoSQL数据库、云数据库服务和机器学习算法,为读者提供了全面的技术知识。
专栏目录
最低0.47元/天 解锁专栏
买1年送3月
百万级
高质量VIP文章无限畅学
千万级
优质资源任意下载
C知道
免费提问 ( 生成式Al产品 )
最新推荐
数据增强实战:从理论到实践的10大案例分析

# 1. 数据增强简介与核心概念
数据增强(Data Augmentation)是机器学习和深度学习领域中,提升模型泛化能力、减少过拟合现象的一种常用技术。它通过创建数据的变形、变化或者合成版本来增加训练数据集的多样性和数量。数据增强不仅提高了模型对新样本的适应能力,还能让模型学习到更加稳定和鲁棒的特征表示。
## 数据增强的核心概念
数据增强的过程本质上是对已有数据进行某种形式的转换,而不改变其底层的分
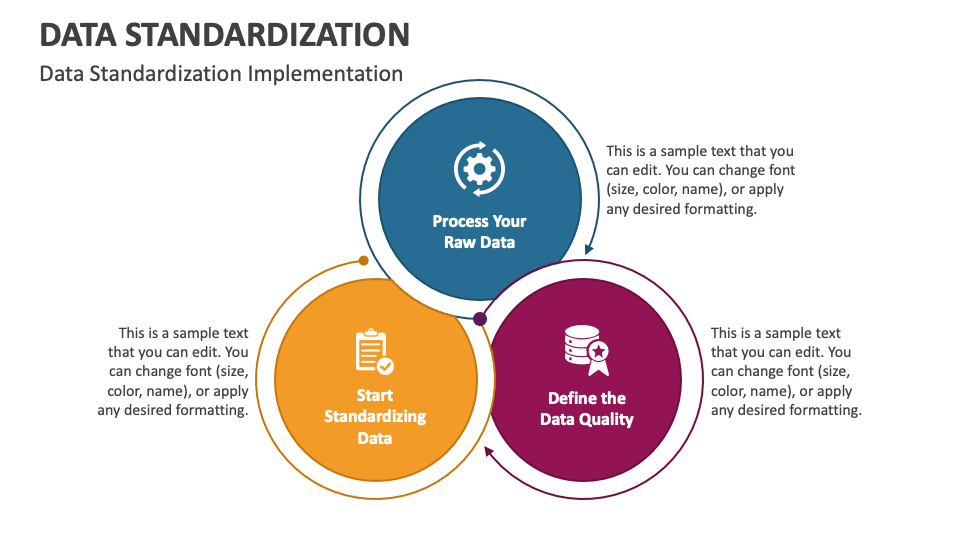
数据标准化:统一数据格式的重要性与实践方法
# 1. 数据标准化的概念与意义
在当前信息技术快速发展的背景下,数据标准化成为了数据管理和分析的重要基石。数据标准化是指采用统一的规则和方法,将分散的数据转换成一致的格式,确保数据的一致性和准确性,从而提高数据的可比较性和可用性。数据标准化不仅是企业内部信息集成的基础,也是推动行业数据共享、实现大数据价值的关键。
数据标准化的意义在于,它能够减少数据冗余,提升数据处理效率
深度学习在半监督学习中的集成应用:技术深度剖析

# 1. 深度学习与半监督学习简介
在当代数据科学领域,深度学习和半监督学习是两个非常热门的研究方向。深度学习作为机器学习的一个子领域,通过模拟人脑神经网络对数据进行高级抽象和学习,已经成为处理复杂数据类型,如图像、文本和语音的关键技术。而半监督学习,作为一种特殊的机器学习方法,旨在通过少量标注数据与大量未标注数据的结合来提高学习模型
数据归一化的紧迫性:快速解决不平衡数据集的处理难题
# 1. 不平衡数据集的挑战与影响
在机器学习中,数据集不平衡是一个常见但复杂的问题,它对模型的性能和泛化能力构成了显著的挑战。当数据集中某一类别的样本数量远多于其他类别时,模型容易偏向于多数类,导致对少数类的识别效果不佳。这种偏差会降低模型在实际应用中的效能,尤其是在那些对准确性和公平性要求很高的领域,如医疗诊断、欺诈检测和安全监控等。
不平衡数据集不仅影响了模型的分类阈值和准确性评估,还会导致机
【云环境数据一致性】:数据标准化在云计算中的关键角色
# 1. 数据一致性在云计算中的重要性
在云计算环境下,数据一致性是保障业务连续性和数据准确性的重要前提。随着企业对云服务依赖程度的加深,数据分布在不同云平台和数据中心,其一致性问题变得更加复杂。数据一致性不仅影响单个云服务的性能,更
【聚类算法优化】:特征缩放的深度影响解析
# 1. 聚类算法的理论基础
聚类算法是数据分析和机器学习中的一种基础技术,它通过将数据点分配到多个簇中,以便相同簇内的数据点相似度高,而不同簇之间的数据点相似度低。聚类是无监督学习的一个典型例子,因为在聚类任务中,数据点没有预先标注的类别标签。聚类算法的种类繁多,包括K-means、层次聚类、DBSCAN、谱聚类等。
聚类算法的性能很大程度上取决于数据的特征。特征即是数据的属性或
强化学习在多智能体系统中的应用:合作与竞争的策略
# 1. 强化学习与多智能体系统基础
在当今快速发展的信息技术行业中,强化学习与多智能体系统已经成为了研究前沿和应用热点。它们为各种复杂决策问题提供了创新的解决方案。特别是在人工智能、机器人学和游戏理论领域,这些技术被广泛应用于优化、预测和策略学习等任务。本章将为读者建立强化学习与多智能体系统的基础知识体系,为进一步探讨和实践这些技术奠定理论基础。
## 1.1 强化学习简介
强化学习是一种通过
【数据集划分自动化工具】:构建并使用工具进行数据集快速划分

# 1. 数据集划分的基本概念与需求分析
## 1.1 数据集划分的重要性
在机器学习和数据分析领域,数据集划分是预处理步骤中不可或缺的一环。通过将数据集划分为训练集、验证集和测试集,可以有效评估模型的泛化能力。划分不当可能会导致模型过拟合或欠拟合,严重影响最终的模型性能。
## 1.2 需求分析
需求分析阶
数据可视化在缺失数据识别中的作用
# 1. 数据可视化基础与重要性
在数据科学的世界里,数据可视化是将数据转化为图形和图表的实践过程,使得复杂的数据集可以通过直观的视觉形式来传达信息。它
【迁移学习的跨学科应用】:不同领域结合的十大探索点

# 1. 迁移学习基础与跨学科潜力
## 1.1 迁移学习的定义和核心概念
迁移学习是一种机器学习范式,旨在将已有的知识从一个领域(源领域)迁移到另一个领域(目标任务领域)。核心在于借助源任务上获得的丰富数据和知识来促进目标任务的学习,尤其在目标任务数据稀缺时显得尤为重要。其核心概念包括源任务、目标任务、迁移策略和迁移效果评估。
## 1.2 迁移学习与传统机器学习方法的对比
与传统机器学习方法不同,迁
资源上传下载、课程学习等过程中有任何疑问或建议,欢迎提出宝贵意见哦~我们会及时处理!
点击此处反馈


专栏目录
最低0.47元/天 解锁专栏
买1年送3月
百万级
高质量VIP文章无限畅学
千万级
优质资源任意下载
C知道
免费提问 ( 生成式Al产品 )