K均值聚类算法优缺点大揭秘:助你做出明智决策
发布时间: 2024-08-20 19:04:21 阅读量: 38 订阅数: 47 

# 1. K均值聚类算法概述**
K均值聚类算法是一种无监督机器学习算法,用于将数据点划分为不同组或簇。它基于一个简单的原理:将数据点分配到离其最近的簇中心。K均值算法的目的是找到一组簇中心,使得簇内数据点的平方误差之和最小。
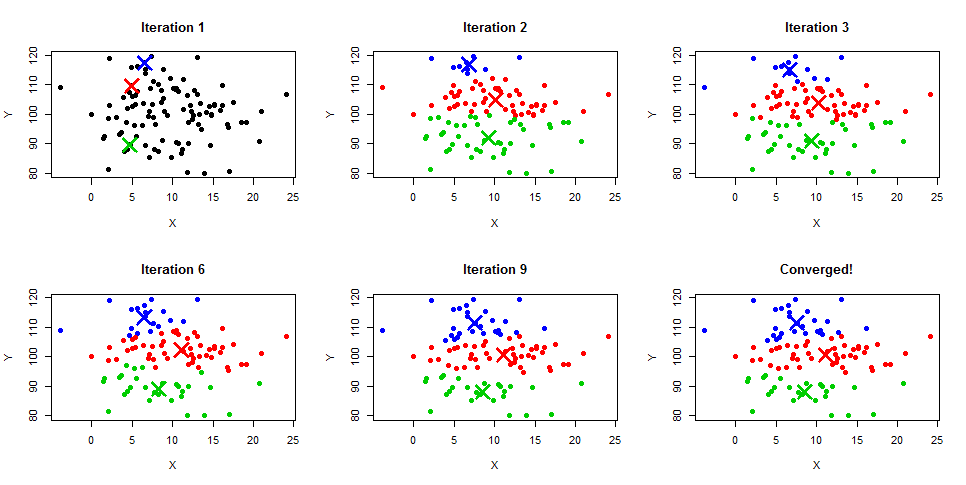
K均值算法是一种迭代算法,它从一组随机选择的簇中心开始。然后,它将每个数据点分配到离其最近的簇中心。接下来,它更新簇中心的位置,使其成为分配给该簇的所有数据点的平均值。此过程重复进行,直到簇中心不再变化。
# 2. K均值聚类算法的理论基础**
**2.1 距离度量和相似性度量**
距离度量是衡量两个数据点之间差异程度的函数。常用的距离度量包括:
- 欧几里得距离:适用于连续型数据,计算两个数据点之间各维度的差值的平方和再开平方。
- 曼哈顿距离:也称城市街区距离,计算两个数据点之间各维度的差值的绝对值之和。
- 切比雪夫距离:计算两个数据点之间各维度差值的绝对值的最大值。
相似性度量是衡量两个数据点之间相似程度的函数。常用的相似性度量包括:
- 余弦相似度:计算两个向量之间夹角的余弦值,范围为[-1, 1]。
- 杰卡德相似度:计算两个集合之间交集元素数量与并集元素数量的比值,范围为[0, 1]。
- 皮尔逊相关系数:计算两个变量之间线性相关程度,范围为[-1, 1]。
**2.2 聚类算法的原理和目标函数**
聚类算法是一种将数据点分组为相似组的无监督学习算法。聚类算法的原理是:
1. 初始化聚类中心:随机选择k个数据点作为聚类中心。
2. 分配数据点:将每个数据点分配到与它距离最近的聚类中心。
3. 更新聚类中心:重新计算每个聚类的中心,使其为该聚类中所有数据点的平均值。
4. 重复步骤2和3,直到聚类中心不再发生变化或达到指定的迭代次数。
聚类算法的目标函数通常是:
- **平方误差和(SSE):**计算每个数据点到其所属聚类中心的距离的平方和。
- **轮廓系数:**衡量每个数据点与其所属聚类中心之间的相似性与与其他聚类中心的相似性之间的差异。
**2.3 K均值聚类算法的具体步骤**
K均值聚类算法是一种最常用的聚类算法,其具体步骤如下:
1. **初始化聚类中心:**随机选择k个数据点作为聚类中心。
2. **分配数据点:**将每个数据点分配到与它距离最近的聚类中心。
3. **更新聚类中心:**重新计算每个聚类的中心,使其为该聚类中所有数据点的平均值。
4. **重复步骤2和3,直到聚类中心不再发生变化或达到指定的迭代次数。**
**代码块:**
```python
import numpy as np
def kmeans(X, k):
"""
K均值聚类算法
参数:
X:数据点,形状为(n_samples, n_features)
k:聚类中心数量
返回:
聚类中心,形状为(k, n_features)
"""
# 初始化聚类中心
centroids = X[np.random.choice(X.shape[0], k, replace=False)]
# 迭代更新聚类中心
while True:
# 分配数据点
cluster_assignments = np.argmin(np.linalg.norm(X - centroids.reshape(1, k, X.shape[1]), axis=2))
# 更新聚类中心
centroids = np.array([np.mean(X[cluster_assignments == i], axis=0) for i in range(k)])
# 检查聚类中心是否发生变化
if np.allclose(centroids, prev_centroids):
break
prev_centroids = centroids
return centroids
```
**逻辑分析:**
该代码实现了K均值聚类算法。它首先随机初始化k个聚类中心,然后迭代更新聚类中心,直到聚类中心不再发生变化。在每次迭代中,它将每个数据点分配到与它距离最近的聚类中心,然后重新计算每个聚类的中心为该聚类中所有数据点的平均值。
**参数说明:**
- `X`:数据点,形状为(n_samples, n_features)。
- `k`:聚类中心数量。
# 3. K均值聚类算法的实践应用**
**3.1 Python实现K均值聚类算法**
```python
import numpy as np
import matplotlib.pyplot as plt
# 定义数据点
data = np.array([[1, 2], [3, 4], [5, 6], [7, 8], [9, 10]])
# 定义K值
k = 2
```

 百万级
高质量VIP文章无限畅学
百万级
高质量VIP文章无限畅学
 千万级
优质资源任意下载
千万级
优质资源任意下载
 C知道
免费提问 ( 生成式Al产品 )
C知道
免费提问 ( 生成式Al产品 )
0
0
相关推荐

专栏简介
本专栏全面解析 K 均值聚类算法,涵盖其原理、实战应用、数学奥秘、优缺点、实现与优化、数据挖掘、图像处理、自然语言处理、推荐系统、金融、医疗、零售、制造、交通、能源等领域的应用,以及最佳实践、常见问题、性能优化、扩展与变体等内容。通过深入浅出的讲解和丰富的案例,本专栏旨在帮助读者掌握 K 均值聚类算法,轻松应对数据聚类挑战,挖掘数据价值,做出明智决策,打造高效聚类模型。
专栏目录
最低0.47元/天 解锁专栏
买1年送3月
百万级
高质量VIP文章无限畅学
千万级
优质资源任意下载
C知道
免费提问 ( 生成式Al产品 )
最新推荐
【MATLAB中MSK调制的艺术】:差分编码技术的优化与应用

# 摘要
MSK调制技术作为现代通信系统中的一种关键调制方式,与差分编码相结合能够提升信号传输的效率和抗干扰能力。本文首先介绍了MSK调制技术和差分编码的基础理论,然后详细探讨了差分编码在MSK调制中的应用,包括MSK调制器设计与差分编码
从零开始学习RLE-8:一文读懂BMP图像解码的技术细节

# 摘要
本文从编码基础与图像格式出发,深入探讨了RLE-8编码技术在图像处理领域的应用。首先介绍了RLE-8编码机制及其在BMP图像格式中的应用,然后详细阐述了RLE-8的编码原理、解码算法,包括其基本概念、规则、算法实现及性能优化策略。接着,本文提供了BMP图像的解码实践指南,解析了文件结构,并指导了RLE-8解码器的开发流程。文章进一步分析了RLE-8在图像压缩中的优势和适用场景,以及其在高级图像处
Linux系统管理新手入门:0基础快速掌握RoseMirrorHA部署
# 摘要
本文首先介绍了Linux系统管理的基础知识,随后详细阐述了RoseMirrorHA的理论基础及其关键功能。通过逐步讲解Linux环境下RoseMirrorHA的部署流程,包括系统要求、安装、配置和启动,本文为系统管理员提供了一套完整的实施指南。此外,本文还探讨了监控、日常管理和故障排查等关键维护任务,以及高可用场景下的实践和性能优化策略。最后,文章展望了Linux系统管理和R
用户体验:华为以用户为中心的设计思考方式与实践

# 摘要
用户体验在当今产品的设计和开发中占据核心地位,对产品成功有着决定性影响。本文首先探讨了用户体验的重要性及其基本理念,强调以用户为中心的设计流程,涵盖用户研究、设计原则、原型设计与用户测试。接着,通过华为的设计实践案例分析,揭示了用户研究的实施、用户体验的改进措施以及界面设计创新的重要性。此外,本文还探讨了在组织内部如何通过
【虚拟化技术】:smartRack资源利用效率提升秘籍
# 摘要
本文全面介绍了虚拟化技术,特别是smartRack平台在资源管理方面的关键特性和实施技巧。从基础的资源调度理论到存储和网络资源的优化,再到资源利用效率的实践技巧,本文系统阐述了如何在smartRack环境下实现高效的资源分配和管理。此外,本文还探讨了高级资源管理技巧,如资源隔离、服务质量(QoS)保障以及性能分析与瓶颈诊
【聚类算法选型指南】:K-means与ISODATA对比分析
# 摘要
本文系统地介绍了聚类算法的基础知识,着重分析了K-means算法和ISODATA算法的原理、实现过程以及各自的优缺点。通过对两种算法的对比分析,本文详细探讨了它们在聚类效率、稳定性和适用场景方面的差异,并展示了它们在市场细分和图像分割中的实际应用案例。最后,本文展望了聚类算法的未来发展方向,包括高维数据聚类、与机器学习技术的结合以及在新兴领域的应用前景。
# 关
小米mini路由器序列号恢复:专家教你解决常见问题

# 摘要
本文对小米mini路由器序列号恢复问题进行了全面概述。首先介绍了小米mini路由器的硬件基础,包括CPU、内存、存储设备及网络接口,并探讨了固件的作用和与硬件的交互。随后,文章转向序列号恢复的理论基础,阐述了序列号的重要性及恢复过程中的可行途径。实践中,文章详细描述了通过Web界面和命令行工具进行序列号恢复的方法。此外,本文还涉及了小米mini路由器的常见问题解决,包括
深入探讨自然辩证法与软件工程的15种实践策略

# 摘要
自然辩证法作为哲学原理,为软件工程提供了深刻的洞见和指导原则。本文探讨了自然辩证法的基本原理及其在软件开发、设计、测试和管理中的应用。通过辩证法的视角,文章分析了对立统一规律、质量互变规律和否定之否定原则在软件生命周期、迭代优化及软件架构设计中的体现。此外,还讨论了如何将自然辩证法应用于面向对象设计、设计模式选择以及测试策略的制定。本文强调了自然辩证法在促进软
【自动化控制】:PRODAVE在系统中的关键角色分析

# 摘要
本文对自动化控制与PRODAVE进行了全面的介绍和分析,阐述了PRODAVE的基础理论、应用架构以及在自动化系统中的实现。文章首先概述了PRODAVE的通信协议和数据交换模型,随后深入探讨了其在生产线自动化、能源管理和质量控制中的具体应用。通过对智能工厂、智能交通系统和智慧楼宇等实际案例的分析,本文进一步揭示了PR
【VoIP中的ITU-T G.704应用】:语音传输最佳实践的深度剖析

# 摘要
本文系统地分析了ITU-T G.704协议及其在VoIP技术中的应用。文章首先概述了G.704协议的基础知识,重点阐述了其关键特性,如帧结构、时间槽、信道编码和信号传输。随后,探讨了G.704在保证语音质量方面的作用,包括误差检测控制机制及其对延迟和抖动的管理。此外,文章还分析了G.704
资源上传下载、课程学习等过程中有任何疑问或建议,欢迎提出宝贵意见哦~我们会及时处理!
点击此处反馈


专栏目录
最低0.47元/天 解锁专栏
买1年送3月
百万级
高质量VIP文章无限畅学
千万级
优质资源任意下载
C知道
免费提问 ( 生成式Al产品 )