MATLAB可视化工具应用案例分析:科学计算中的图形创新
发布时间: 2024-08-31 05:03:01 阅读量: 134 订阅数: 62 

Matlab在科学计算和数据分析中的应用.md
# 1. MATLAB可视化工具基础
## 1.1 MATLAB界面简介
MATLAB提供了一个集成环境,用于数值计算、可视化和编程。启动MATLAB后,用户将面对一个命令窗口和一系列工具条,其中包括变量编辑器、当前文件夹浏览器等。用户可以通过编写脚本或函数来执行复杂的数值计算并生成图形。
## 1.2 基本图形命令
在MATLAB中,绘制基本图形如二维线图、散点图、条形图等非常简单。例如,绘制正弦曲线的命令如下:
```matlab
x = 0:pi/100:2*pi;
y = sin(x);
plot(x, y);
title('Simple Sine Wave');
xlabel('x');
ylabel('sin(x)');
```
上述代码首先定义了变量`x`和`y`,然后使用`plot`函数绘制了一条正弦曲线,并添加了图表标题和坐标轴标签。
## 1.3 图形窗口操作
图形窗口是MATLAB可视化的中心。在图形窗口中,可以进行各种操作,如放大、缩小、数据点的标示、图例添加等。通过图形窗口顶部的工具栏或右键菜单,用户可以进行这些操作。图形窗口还支持保存和导出图形,以便在报告或演示中使用。
通过介绍MATLAB的基本界面和操作,本章为用户打下了使用MATLAB进行数据可视化的基础,为后续章节深入探讨数据可视化技巧和案例分析提供了前导知识。
# 2. MATLAB数据可视化技巧
## 2.1 基础图形创建与定制
### 2.1.1 图形窗口的创建和配置
在MATLAB中创建图形窗口是数据可视化过程的第一步。基本的图形窗口可以通过多种函数创建,如`figure`函数用于创建一个新窗口,`axes`创建一个坐标轴。
```matlab
% 创建一个图形窗口
figure;
% 在新窗口中创建坐标轴
axes;
% 自定义图形窗口属性
set(gcf, 'Name', 'My Visualization', 'NumberTitle', 'off');
```
在这段代码中,`gcf`代表当前图形窗口,`set`函数用于修改图形窗口属性,如设置窗口名称为"My Visualization"。`'NumberTitle', 'off'`用于关闭默认的标题编号。
### 2.1.2 图形元素的自定义与样式调整
图形元素包括线条、文本、颜色、图例等,MATLAB提供了大量属性和方法来进行自定义和样式调整。使用`set`函数可以改变这些图形元素的样式。
```matlab
% 创建一个线图
f = figure;
plot(1:10, rand(1, 10));
% 设置线条颜色为红色,宽度为2,样式为虚线
set(gca, 'Color', 'r', 'LineWidth', 2, 'LineStyle', '--');
% 添加标题和标签
title('Customized Line Plot');
xlabel('X-axis');
ylabel('Y-axis');
```
`gca`函数用于获取当前坐标轴,然后通过`set`函数调整线条颜色为红色,线宽为2,以及设置为虚线样式。
## 2.2 高级数据展示方法
### 2.2.1 二维与三维图形的绘制
MATLAB支持绘制二维和三维图形,`plot`函数是绘制二维图形的基本函数,`plot3`用于绘制三维图形。三维图形能够提供更多的信息和视角。
```matlab
% 绘制三维曲线
t = linspace(0, 2*pi, 100);
x = sin(t);
y = cos(t);
z = t;
figure;
plot3(x, y, z);
xlabel('X');
ylabel('Y');
zlabel('Z');
title('3D Plot Example');
```
`linspace`函数生成一个等间隔的数值向量,`plot3`函数绘制三维空间中的曲线。设置坐标轴标签和标题,有助于解释图形信息。
### 2.2.2 多轴图和子图的制作技巧
MATLAB可以创建多个轴和子图,使得在同一个窗口中显示多个图形。这对于比较不同数据集或不同类型的图形非常有用。`subplot`函数允许用户将图形窗口分割为多个绘图区域。
```matlab
% 创建一个2行2列的子图布局
figure;
subplot(2,2,1);
plot([1 2 3], [1 3 2]);
title('Subplot 1');
subplot(2,2,2);
bar([1 2 3], [1 5 3]);
title('Subplot 2');
subplot(2,2,3);
pie([1 2 3]);
title('Subplot 3');
subplot(2,2,4);
stem([1 2 3], [1 4 9]);
title('Subplot 4');
```
每块区域通过`subplot`函数定义,格式为`subplot(numRows, numCols, positionNumber)`,其中`numRows`和`numCols`为子图的行数和列数,`positionNumber`为子图位置编号。
## 2.3 交互式可视化工具的应用
### 2.3.1 创建交互式图表
MATLAB允许创建带有用户交互的图表,以动态展示数据。使用`uifigure`和`uitable`等UI组件可以创建交互式的可视化界面。
```matlab
% 创建UI图形窗口和表格组件
uiFig = uifigure('Name', 'Interactive Plot');
% 创建一个表格组件用于交互
data = table(1:10, rand(10,1), 'VariableNames', {'X', 'Y'});
uitable1 = uitable(uiFig, 'Data', data);
% 创建一个交互式滑块
slider1 = uicontrol('Style', 'slider', 'Position', [***], ...
'Min', 1, 'Max', 10, ...
'Value', 5, 'Callback', @sliderCallback);
% 滑块回调函数定义
function sliderCallback(src, ~)
val = src.Value;
% 基于滑块值更新数据和图表
% 例如更新图表数据
% 更新后的代码逻辑...
end
```
`uifigure`创建了一个具有交互功能的图形窗口,`uitable`展示了可交互的表格,`uicontrol`创建了一个滑块组件,并定义了滑块移动时执行的回调函数。
### 2.3.2 事件驱动编程在可视化中的应用
事件驱动编程是MATLAB交互式应用开发的核心,允许用户通过各种事件(如按钮点击、键盘输入等)控制程序流程。
```matlab
% 创建一个按钮组件
button = uibutton(uiFig, 'push', 'Text', 'Update Plot', ...
'Position', [***], 'Callback', @buttonCallback);
% 按钮回调函数定义
function buttonCallback(src, ~)
% 更新数据或图形的代码逻辑...
end
```
通过`uibutton`创建了一个按钮组件,并通过`'Callback'`属性定义了按钮点击时的回调函数`buttonCallback`,在函数内部编写更新数据或图形的逻辑代码。
在本章节中,我们深入探索了MATLAB数据可视化技巧,从基础图形的创建和定制到高级的交互式可视化工具的应用。下一章节中,我们将探讨科学计算中图形应用,让数据可视化在数据分析、工程仿真及教育等领域发挥更大的作用。
# 3. 科学计算中的图形应用
在现代科学研究中,图形的应用早已超越了简单的数据展示。科学计算的图形应用通常涉及复杂的分析,以及对于大量数据的可视化处理。在本章节,我们将探索如何通过MATLAB实现这些高级图形应用,分析其在数据分析、工程计算和科学探索中的关键作用。
## 3.1 数据分析与可视化
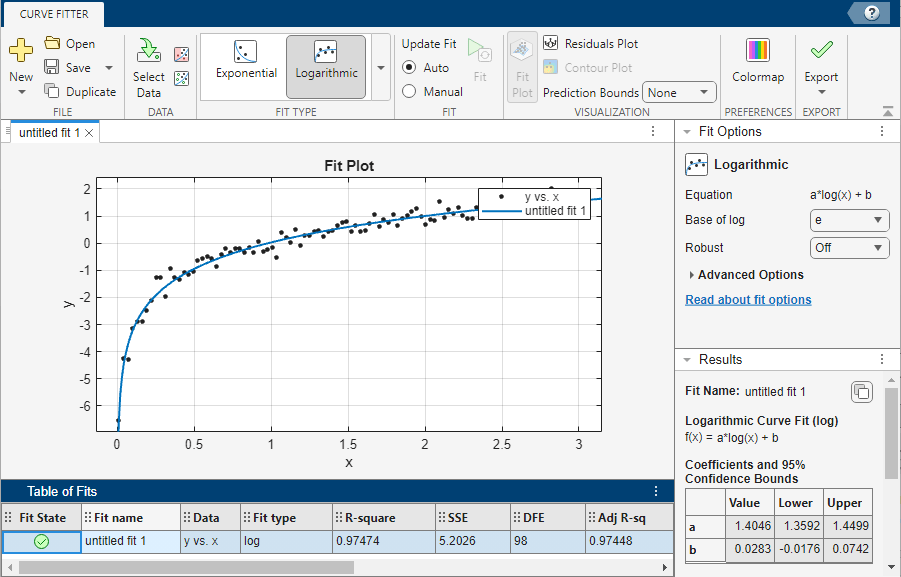
### 3.1.1 统计图表的生成与解读
在数据分析中,统计图表是最常用的工具之一,用于展示数据的分布、集中趋势和离散程度等特征。MATLAB提供了丰富的函数和工具箱来支持统计图表的生成,如`bar`, `pie`, `histogram`等函数。通过这些函数,可以快速生成柱状图、饼图、直方图等多种类型的统计图表。
让我们以一个简单例子说明如何使用MATLAB生成一个散点图,并进行基本的数据分布分析。
```matlab
% 假设有一组数据
dataX = randn(100, 1); % 生成100个标准正态分布随机数作为X数据
dataY = randn(100, 1) * 0.5 + 10; % 生成100个均值为10,标准差为0.5的正态分布随机数作为Y数据
% 使用散点图展示数据
scatter(dataX, dataY);
```

 百万级
高质量VIP文章无限畅学
百万级
高质量VIP文章无限畅学
 千万级
优质资源任意下载
千万级
优质资源任意下载
 C知道
免费提问 ( 生成式Al产品 )
C知道
免费提问 ( 生成式Al产品 )
0
0
相关推荐

专栏简介
专栏“MATLAB图形可视化算法”提供全面的MATLAB图形可视化指南,涵盖从入门到高级的技巧。它深入探讨了15个实用技巧,帮助初学者快速上手。专栏还提供了数据可视化进阶指南,介绍了绘图工具箱的强大功能。对于高级用户,它揭示了定制化图形界面的秘诀。此外,专栏还提供了图形性能优化指南和图形界面设计与交互逻辑的深入见解。它深入研究了图像处理、处理大型数据集、图表美化和三维图形处理。专栏还探讨了MATLAB与GPU加速计算、可视化工具应用案例分析、地理信息系统数据可视化、图形与机器学习、图形自动化、调试与性能优化、输出高品质图像与动画以及图形与自然语言处理。
专栏目录
最低0.47元/天 解锁专栏
买1年送3月
百万级
高质量VIP文章无限畅学
千万级
优质资源任意下载
C知道
免费提问 ( 生成式Al产品 )
最新推荐
【ABB变频器深度解析】:掌握ACS510型号的全部秘密
# 摘要
本文全面介绍了ABB变频器ACS510型号,包括其硬件组成、工作原理、软件控制、配置及高级应用实例。首先概述了ACS510型号的基本信息,随后详细分析了其硬件结构、工作机制和关键技术参数,并提供了硬件故障诊断与维护策略。接着,本文探讨了软件控制功能、编
AMESim液压仿真优化宝典:提升速度与准确性的革新方法
# 摘要
AMESim作为一种液压仿真软件,为工程设计提供了强大的模拟和分析工具。本文第一章介绍了AMESim的基础知识和液压仿真技术的基本概念。第二章深入探讨了AMESim仿真模型的构建方法,包括系统建模理论、模型参数设置以及信号与控制的处理。第三章重点描述了提高AMESim仿真实效性的策略和高级分析技术,以及如何解读和验证仿真结果。第四章通过案例研究,展示了AMESim在实际工程应用中的优化效果、故障诊断
【性能与兼容性的平衡艺术】:在UTF-8与GB2312转换中找到完美的平衡点
# 摘要
字符编码是信息处理的基础,对计算机科学和跨文化通讯具有重要意义。随着全球化的发展,UTF-8和GB2312等编码格式的正确应用和转换成为技术实践中的关键问题。本文首先介绍了字符编码的基本知识和重要性,随后详细解读了UTF-8和GB2312编码的特点及其在实际应用中的作用。在此基础上,文章深入探讨了字符编码转换的理论基础,包括转换的必要性、复
【Turbo Debugger新手必读】:7个步骤带你快速入门软件调试
# 摘要
本文旨在全面介绍软件调试工具Turbo Debugger的使用方法和高级技巧。首先,本文简要概述了软件调试的概念并提供了Turbo Debugger的简介。随后,详细介绍了Turbo Debugger的安装过程及环境配置的基础知识,以确保调试环境的顺利搭建。接着,通过详细的操作指南,让读者能够掌握项目的加
【智能小车控制系统优化秘籍】:揭秘路径记忆算法与多任务处理

# 摘要
智能小车控制系统涉及路径记忆算法与多任务处理的融合,是提高智能小车性能和效率的关键。本文首先介绍了智能小车控制系统的概念和路径记忆算法的理论基础,然后探讨了多任务处理的理论与实践,特别关注了实时操作系统和任务调度机制。接着,文章深入分
SUN2000逆变器MODBUS扩展功能开发:提升系统灵活性的秘诀
# 摘要
本文针对MODBUS协议在SUN2000逆变器中的应用及逆变器通信原理进行了深入探讨。首先介绍了MODBUS协议的基础知识以及逆变器通信原理,随后详细分析了SUN2000逆变器MODBUS接口,并解读了相关命令及功能码。接着,文章深入探讨了逆变器数据模型和寄存器映
【cantest高级功能深度剖析】:解锁隐藏功能的宝藏

# 摘要
cantest作为一种先进的测试工具,提供了一系列高级功能,旨在提升软件测试的效率与质量。本文首先概览了cantest的核心功能,并深入探讨了其功能架构,包括核心组件分析、模块化设计以及插件系统的工作原理和开发管理。接着,文章实战演练了cantest在数据驱动测试、跨平台测试和自动化测试框架
【系统稳定性提升】:sco506升级技巧与安全防护

# 摘要
本文全面介绍了sco506系统的概述、稳定性重要性、升级前的准备工作,以及系统升级实践操作。文中详细阐述了系统升级过程中的风险评估、备份策略、升级步骤以及验证升级后稳定性的方法。此外,文章还探讨了系统安全防护策略,包括系统加固、定期安全审计与
期末考试必看:移动互联网数据通信与应用测试策略
# 摘要
随着移动互联网的快速发展,数据通信和移动应用的测试与性能优化成为提升用户体验的关键。本文首先介绍了移动互联网数据通信的基础知识,随后详述了移动应用测试的理论与
【人事管理系统性能优化】:提升系统响应速度的关键技巧:性能提升宝典
# 摘要
随着信息技术的迅速发展,人事管理系统的性能优化成为提升组织效率的关键。本文探讨了系统性能分析的基础理论,包括性能分析的关键指标、测试方法以及诊断技术。进一步,本文涉及系统架构的优化实践,涵盖了数据库、后端服务和前端界面的性能改进。文章还深入讨论了高级性能优化技术,包括分布式系统和云服务环境下的性能管理,以及使用性能优化工具与自动化流程。最
资源上传下载、课程学习等过程中有任何疑问或建议,欢迎提出宝贵意见哦~我们会及时处理!
点击此处反馈


专栏目录
最低0.47元/天 解锁专栏
买1年送3月
百万级
高质量VIP文章无限畅学
千万级
优质资源任意下载
C知道
免费提问 ( 生成式Al产品 )