Python爬虫数据可视化:不同图表类型的选择与应用(图表选择指南,让数据更具说服力)
发布时间: 2024-07-20 16:58:06 阅读量: 46 订阅数: 22 

电影数据抓取与分析任务:TMDb平台上的网络爬虫实战及深度解析
# 1. Python爬虫数据可视化概述
**1.1 数据可视化的重要性**
数据可视化是将复杂的数据转换为可视化表示的过程,使人们能够轻松理解和分析数据。它对于从数据中提取见解、发现模式和趋势至关重要。
**1.2 Python爬虫与数据可视化**
Python是一种广泛用于网络爬虫的编程语言,它可以从各种来源(如网站、API)提取数据。数据可视化工具可以帮助我们对从网络爬虫收集的数据进行可视化,以便更好地理解和分析。
# 2. 图表类型与选择原则
图表是数据可视化的核心元素,选择合适的图表类型对于有效传达信息至关重要。本章将介绍常见的图表类型,分析它们的应用场景和特点,帮助读者在实际数据可视化项目中做出明智的选择。
### 2.1 柱状图和条形图
**2.1.1 柱状图的应用场景和特点**
柱状图是一种垂直条形图,用于比较不同类别或组别的数据。其特点包括:
- **强调差异:**柱状图可以清晰地显示不同类别或组别之间的差异,使读者能够轻松识别最大值和最小值。
- **空间效率:**柱状图可以紧凑地排列,在有限的空间内显示大量数据。
- **易于理解:**柱状图的直观性使其易于理解和解释,即使是非专业人士也可以快速掌握。
**2.1.2 条形图的应用场景和特点**
条形图是一种水平条形图,与柱状图类似,但其特点有所不同:
- **强调趋势:**条形图更适合于展示数据随时间或其他变量的变化趋势。
- **空间效率:**条形图在显示较长标签时具有优势,可以避免标签重叠。
- **比较比例:**条形图可以方便地比较不同类别或组别的比例,使读者能够识别相对大小。
### 2.2 折线图和散点图
**2.2.1 折线图的应用场景和特点**
折线图是一种连接一系列数据点的线形图,用于展示数据随时间或其他变量的变化趋势。其特点包括:
- **趋势分析:**折线图可以清晰地显示数据随时间的变化,使读者能够识别趋势、周期和异常值。
- **预测和外推:**折线图可以用来预测未来趋势或外推数据,但需要谨慎使用。
- **比较多个数据集:**折线图可以同时显示多个数据集,方便比较不同趋势。
**2.2.2 散点图的应用场景和特点**
散点图是一种将数据点绘制在坐标系上的图表,用于探索两个变量之间的关系。其特点包括:
- **相关性分析:**散点图可以显示两个变量之间的相关性,包括正相关、负相关或无相关。
- **识别异常值:**散点图可以帮助识别数据中的异常值,这些异常值可能代表错误或有价值的见解。
- **聚类和分组:**散点图可以用来识别数据中的聚类或分组,这有助于发现潜在的模式或结构。
### 2.3 饼图和雷达图
**2.3.1 饼图的应用场景和特点**
饼图是一种圆形图表,将数据划分为不同的扇形,每个扇形的面积与相应数据值成比例。其特点包括:
- **比例比较:**饼图可以清晰地显示不同类别或组别的比例,使读者能够快速了解数据分布。
- **直观性:**饼图的直观性使其易于理解,即使是非专业人士也可以快速掌握。
- **限制:**饼图不适合展示大量数据或复杂的关系,因为它会使图表难以解读。
**2.3.2 雷达图的应用场景和特点**
雷达图是一种多边形图表,用于比较多个类别或组别在不同指标上的表现。其特点包括:
- **多维度比较:**雷达图可以同时显示多个指标,使读者能够全面比较不同类别或组别的表现。
- **识别优势和劣势:**雷达图可以帮助识别不同类别或组别的优势和劣势,为决策提供依据。
- **复杂性:**雷达图在显示大量指标时会变得复杂,需要谨慎使用。
# 3.1 Matplotlib的基本使用方法
#### 3.1.1 安装和导入Matplotlib
Matplotlib是一个用于创建2D图形的Python库。它提供了丰富的API,可以轻松地创建各种类型的图表,包括柱状图、折线图、饼图和散点图。
要安装Matplotlib,可以使用pip命令:
```
```

 百万级
高质量VIP文章无限畅学
百万级
高质量VIP文章无限畅学
 千万级
优质资源任意下载
千万级
优质资源任意下载
 C知道
免费提问 ( 生成式Al产品 )
C知道
免费提问 ( 生成式Al产品 )
0
0
相关推荐

专栏简介
本专栏深入探讨了 Python 爬虫数据可视化的方方面面。从揭示数据背后的洞察到提升分析能力,再到实战案例剖析和性能优化技巧,专栏提供了全面的指南,帮助读者掌握数据可视化的艺术。此外,专栏还涵盖了数据清洗、图表选择、移动端可视化、大数据可视化等主题,以及数据可视化在机器学习、数据挖掘、商业智能、数据新闻和金融科技中的应用。通过深入浅出的讲解和丰富的案例分析,本专栏旨在帮助读者充分利用 Python 爬虫数据可视化,从数据中提取有价值的见解并做出明智的决策。
专栏目录
最低0.47元/天 解锁专栏
买1年送3月
百万级
高质量VIP文章无限畅学
千万级
优质资源任意下载
C知道
免费提问 ( 生成式Al产品 )
最新推荐
STM32F407高级定时器应用宝典:掌握PWM技术的秘诀
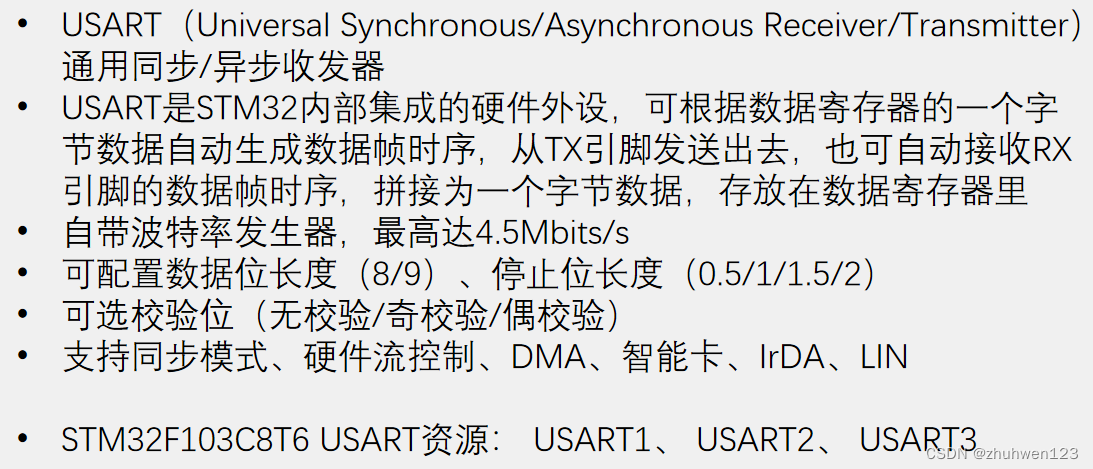
# 摘要
STM32F407微控制器的高级定时器是高效处理定时和PWM信号的关键组件。本文首先概述了STM32F407高级定时器的基本功能和特点,随后深入探讨了PWM技术的理论基础,包括定义、工作原理、数学模型和在电子设计中的应用。接着,文章详细描述了定时器的硬件配置方法、软件实现和调试技巧,并提供了高级定时器PWM应用实践的案例。最后,本文探讨了高级定时器的进阶应用,包括高级功能的应用、开发环境中的实现和未来的发展方
【微电子与电路理论】:电网络课后答案,现代应用的探索

# 摘要
本文旨在探讨微电子与电路理论在现代电网络分析和电路设计中的应用。首先介绍了微电子与电路理论的基础知识,然后深入讨论了直流、交流电路以及瞬态电路的理论基础和应用技术。接下来,文章转向现代电路设计与应用,重点分析了数字电路与模拟电路的设计方法、技术发展以及电路仿真软件的应用。此外,本文详细阐述了微电子技术在电网络中的应用,并预测了未来电网络研究的方向,特别是在电力系统和
SAE-J1939-73安全性强化:保护诊断层的关键措施

# 摘要
本文对SAE J1939-73车载网络协议进行详尽的分析,重点探讨其安全性基础、诊断层安全性机制、以及实际应用案例。SAE J1939-73作为增强车载数据通信安全的关键协议,不仅在确保数据完整性和安全性方面发挥作用,还引入了加密技术和认证机制以保护信息交换。通过深入分析安全性要求和强化措施的理论框架,本文进一步讨论了加密技
VLAN配置不再难:Cisco Packet Tracer实战应用指南
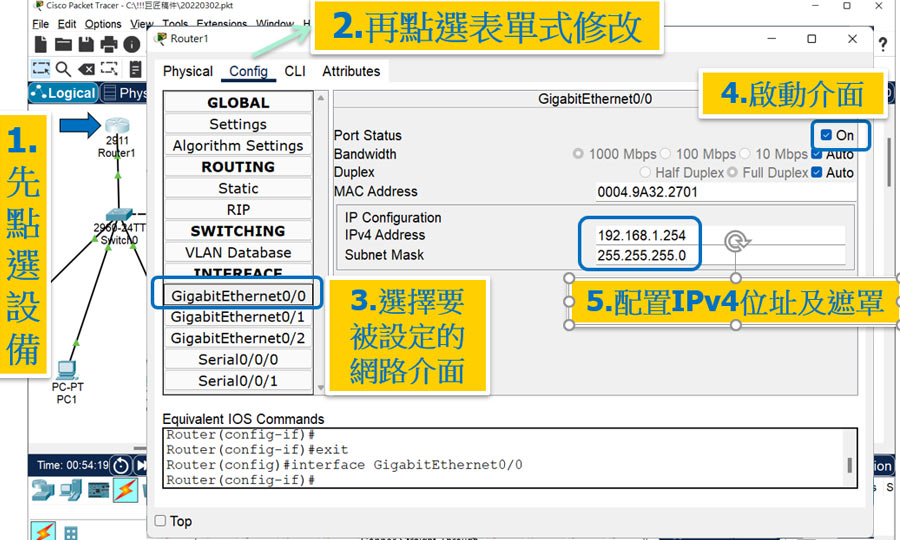
# 摘要
本文全面探讨了VLAN(虚拟局域网)的基础知识、配置、实践和故障排除。首先介绍了VLAN的基本概念及其在Cisco Packet Tracer模拟环境中的配置方法。随后,本文详细阐述了VLAN的基础配置步骤,包括创建和命名VLAN、分配端口至VLAN,以及VLAN间路由的配置和验证。通过深入实践,本文还讨论了VLAN配置的高级技巧,如端口聚合、负载均衡以及使用访
【Sentinel-1极化分析】:解锁更多地物信息
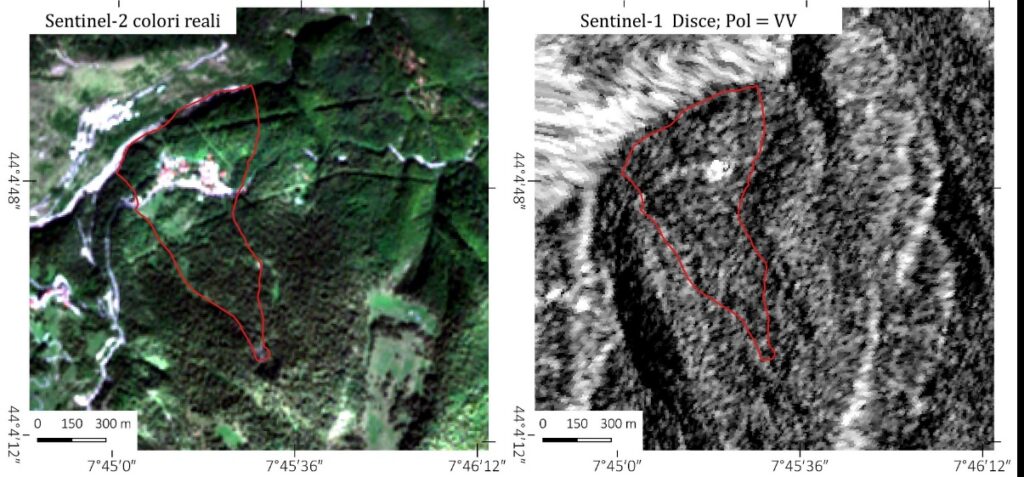
# 摘要
本文概述了Sentinel-1极化分析的核心概念、基础理论及其在地物识别和土地覆盖分类中的应用。首先介绍了极化雷达原理、极化参数的定义和提取方法,然后深入探讨了Sentinel-1极化数据的预处理和分析技术,包括数据校正、噪声滤波、极化分解和特征提取。文章还详细讨论了地物极化特征识别和极化数据在分类中的运用,通过实例分析验证了极化分析方法的有效性。最后,展望了极化雷达技术的发
【FANUC机器人信号流程深度解析】:揭秘Process IO信号工作原理与优化方法
# 摘要
FANUC机器人信号流程是工业自动化领域中的关键组成部分,影响着机器人的运行效率和可靠性。本文系统地概述了FANUC机器人信号流程的基本原理,详细分析了信号的硬件基础和软件控制机制,并探讨了信号流程优化的理论基础和实践方法。文章进一步阐述了信号流程在预测性维护、实时数据处理和工业物联网中的高级应用,以及故障诊断与排除的技术与案例。通过对FANUC
华为1+x网络运维:监控、性能调优与自动化工具实战
# 摘要
随着网络技术的快速发展,网络运维工作变得更加复杂和重要。本文从华为1+x网络运维的角度出发,系统性地介绍了网络监控技术的理论与实践、网络性能调优策略与方法,以及自动化运维工具的应用与开发。文章详细阐述了监控在网络运维中的作用、监控系统的部署与配置,以及网络性能指标的监测和分析方法。进一步探讨了性能调优的理论基础、网络硬件与软件的调优实践,以及通过自
ERB Scale在现代声学研究中的作用:频率解析的深度探索

# 摘要
ERB Scale(Equivalent Rectangular Bandwidth Scale)是一种用于声学研究的重要量度,它基于频率解析理论,能够描述人类听觉系统的频率分辨率特性。本文首先概述了ERB Scale的理论基础,随后详细介绍了其计算方法,包括基本计算公式与高级计算模型。接着,本文探讨了ERB Scale在声音识别与语音合成等领域的应用,并通过实例分析展示了其
【数据库复制技术实战】:实现数据同步与高可用架构的多种方案
# 摘要
数据库复制技术作为确保数据一致性和提高数据库可用性的关键技术,在现代信息系统中扮演着至关重要的角色。本文深入探讨了数据库复制技术的基础知识、核心原理和实际应用。内容涵盖从不同复制模式的分类与选择、数据同步机制与架构,到复制延迟与数据一致性的处理,以及多种数据库系统的复制技术实战。此外,本文还讨论了高可用
资源上传下载、课程学习等过程中有任何疑问或建议,欢迎提出宝贵意见哦~我们会及时处理!
点击此处反馈


专栏目录
最低0.47元/天 解锁专栏
买1年送3月
百万级
高质量VIP文章无限畅学
千万级
优质资源任意下载
C知道
免费提问 ( 生成式Al产品 )