Python爬虫数据可视化:商业智能中的应用(数据可视化驱动商业决策)
发布时间: 2024-07-20 17:10:57 阅读量: 40 订阅数: 22 
# 1. Python爬虫基础**
Python爬虫是一种自动化工具,用于从网站上提取数据。它广泛用于数据收集、信息聚合和市场研究等领域。
Python爬虫通常使用以下步骤:
1. **发送请求:**向目标网站发送HTTP请求以获取HTML或JSON响应。
2. **解析响应:**使用HTML解析器或JSON解析器从响应中提取所需的数据。
3. **存储数据:**将提取的数据存储在数据库、文件或其他存储介质中。
Python提供了丰富的爬虫库,例如Requests、BeautifulSoup和Selenium,这些库可以简化爬虫过程,并提供处理HTML、JSON和JavaScript等常见网络格式的功能。
# 2. Python数据可视化库
数据可视化库是Python生态系统中必不可少的工具,它们提供了丰富的功能来创建各种类型的图表和图形,帮助用户清晰地展示和分析数据。本章节将介绍Python中三个最流行的数据可视化库:Matplotlib、Seaborn和Plotly。
### 2.1 Matplotlib:基础图表库
Matplotlib是Python中历史最悠久、最常用的数据可视化库。它提供了一套全面的2D绘图API,可以创建各种类型的静态图表,包括折线图、条形图、散点图和直方图。Matplotlib的优势在于其灵活性,允许用户自定义图表的外观和行为。
```python
# 导入Matplotlib
import matplotlib.pyplot as plt
# 创建一个折线图
plt.plot([1, 2, 3, 4], [5, 6, 7, 8])
# 设置标题和标签
plt.title("折线图示例")
plt.xlabel("x轴")
plt.ylabel("y轴")
# 显示图表
plt.show()
```
**代码逻辑分析:**
* `import matplotlib.pyplot as plt`:导入Matplotlib库并将其别名为`plt`。
* `plt.plot([1, 2, 3, 4], [5, 6, 7, 8])`:创建一条折线,其中x轴数据为[1, 2, 3, 4],y轴数据为[5, 6, 7, 8]。
* `plt.title("折线图示例")`:设置图表标题为"折线图示例"。
* `plt.xlabel("x轴")`:设置x轴标签为"x轴"。
* `plt.ylabel("y轴")`:设置y轴标签为"y轴"。
* `plt.show()`:显示图表。
### 2.2 Seaborn:高级图表库
Seaborn是基于Matplotlib构建的高级数据可视化库。它提供了一组预定义的图表样式和颜色方案,简化了创建美观且信息丰富的图表的过程。Seaborn还提供了高级统计功能,如相关矩阵和聚类分析。
```python
# 导入Seaborn
import seaborn as sns
# 创建一个散点图
sns.scatterplot(x="x", y="y", data=df)
# 设置标题和标签
sns.set_title("散点图示例")
sns.set_xlabel("x轴")
sns.set_ylabel("y轴")
# 显示图表
sns.show()
```
**代码逻辑分析:**
* `import seaborn as sns`:导入Seaborn库并将其别名为`sns`。
* `sns.scatterplot(x="x", y="y", data=df)`:创建一条散点图,其中x轴数据为`df["x"]`,y轴数据为`df["y"]`。
* `sns.set_title("散点图示例")`:设置图表标题为"散点图示例"。
* `sns.set_xlabel("x轴")`:设置x轴标签为"x轴"。
* `sns.set_ylabel("y轴")`:设置y轴标签为"y轴"。
* `sns.show()`:显示图表。
### 2.3 Plotly:交互式图表库
Plotly是一个基于WebGL的交互式数据可视化库。它允许用户创建3D图表、地图和动画,并可以通过网络浏览器或Jupyter Notebook交互式地探索数据。
```python
# 导入Plotly
import plotly.express as px
# 创建一个3D散点图
fig = px.scatter_3d(x="x", y="y", z="z", data=df)
# 显示图表
fig.show()
```
**代码逻辑分析:**
* `import plotly.express as px`:导入Plotly Express模块并将其别名为`px`。
* `px.scatter_3d(x="x", y="y", z="z", data=df)`:创建一个3D散点图,其中x轴数据为`df["x"]`,y轴数据为`df["y"]`,z轴数据为`df["z"]`。
* `fig.show()`:显示图表。
**表格:Python数据可视化库比较**
| 库 | 特点 | 优点 | 缺点 |
|---|---

 百万级
高质量VIP文章无限畅学
百万级
高质量VIP文章无限畅学
 千万级
优质资源任意下载
千万级
优质资源任意下载
 C知道
免费提问 ( 生成式Al产品 )
C知道
免费提问 ( 生成式Al产品 )
0
0
相关推荐

专栏简介
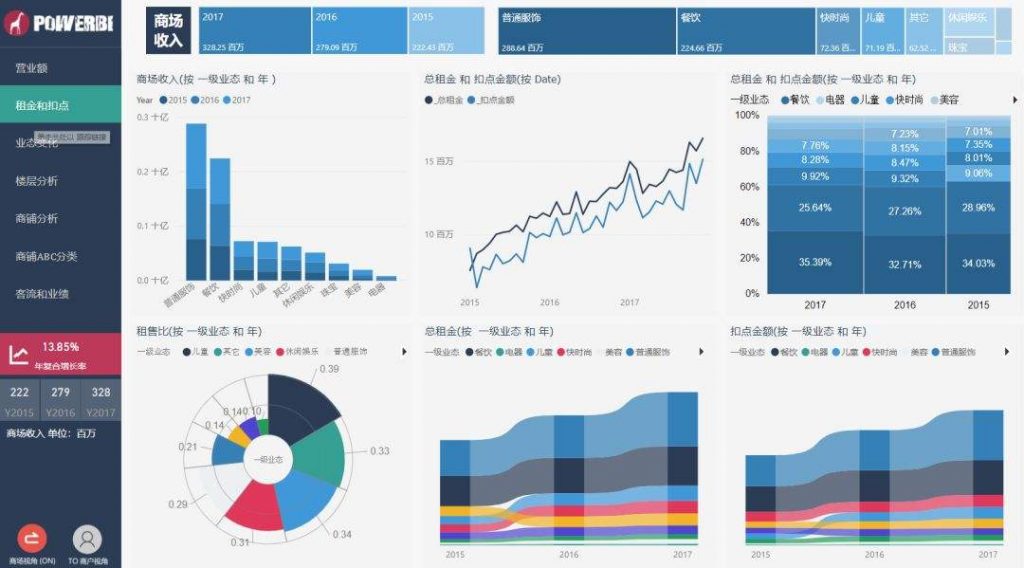
本专栏深入探讨了 Python 爬虫数据可视化的方方面面。从揭示数据背后的洞察到提升分析能力,再到实战案例剖析和性能优化技巧,专栏提供了全面的指南,帮助读者掌握数据可视化的艺术。此外,专栏还涵盖了数据清洗、图表选择、移动端可视化、大数据可视化等主题,以及数据可视化在机器学习、数据挖掘、商业智能、数据新闻和金融科技中的应用。通过深入浅出的讲解和丰富的案例分析,本专栏旨在帮助读者充分利用 Python 爬虫数据可视化,从数据中提取有价值的见解并做出明智的决策。
专栏目录
最低0.47元/天 解锁专栏
买1年送3月
百万级
高质量VIP文章无限畅学
千万级
优质资源任意下载
C知道
免费提问 ( 生成式Al产品 )
最新推荐
【16位加法器设计秘籍】:全面揭秘高性能计算单元的构建与优化

# 摘要
本文对16位加法器进行了全面的研究和分析。首先回顾了加法器的基础知识,然后深入探讨了16位加法器的设计原理,包括二进制加法基础、组成部分及其高性能设计考量。接着,文章详细阐述
三菱FX3U PLC编程:从入门到高级应用的17个关键技巧

# 摘要
三菱FX3U PLC是工业自动化领域常用的控制器之一,本文全面介绍了其编程技巧和实践应用。文章首先概述了FX3U PLC的基本概念、功能和硬件结构,随后深入探讨了
【Xilinx 7系列FPGA深入剖析】:掌握架构精髓与应用秘诀
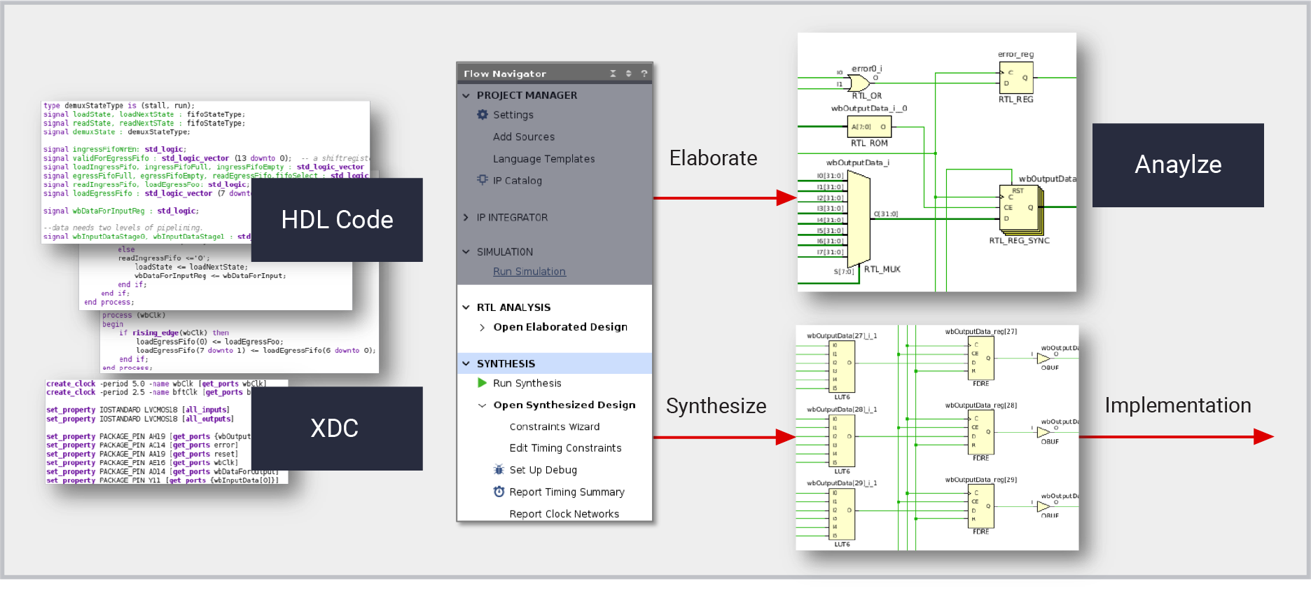
# 摘要
本文详细介绍了Xilinx 7系列FPGA的关键特性及其在工业应用中的广泛应用。首先概述了7系列FPGA的基本架构,包括其核心的可编程逻辑单元(PL)、集成的块存储器(BRAM)和数字信号处理(DSP)单元。接着,本文探讨了使用Xilinx工具链进行FPGA编程与配置的流程,强调了设计优化和设备配置的重要性。文章进一步分析了7系列FPGA在
【图像技术的深度解析】:Canvas转JPEG透明度保护的终极策略

# 摘要
随着Web技术的不断发展,图像技术在前端开发中扮演着越来越重要的角色。本文首先介绍了图像技术的基础和Canvas绘
【MVC标准化:肌电信号处理的终极指南】:提升数据质量的10大关键步骤与工具
# 摘要
MVC标准化是肌电信号处理中确保数据质量的重要步骤,它对于提高测量结果的准确性和可重复性至关重要。本文首先介绍肌电信号的生理学原理和MVC标准化理论,阐述了数据质量的重要性及影响因素。随后,文章深入探讨了肌电信号预处理的各个环节,包括噪声识别与消除、信号放大与滤波技术、以及基线漂移的校正方法。在提升数据质量的关键步骤部分,本文详细描述了信号特征提取、MVC标准化的实施与评估,并讨论了数据质量评估与优化工具。最后,本文通过实验设计和案例分析,展示了MVC标准化在实践应用中的具
ISA88.01批量控制:电子制造流程优化的5大策略

# 摘要
本文首先概述了ISA88.01批量控制标准,接着深入探讨了电子制造流程的理论基础,包括原材料处理、制造单元和工作站的组成部分,以及流程控制的理论框架和优化的核心原则。进一步地,本文实
【Flutter验证码动画效果】:如何设计提升用户体验的交互

# 摘要
随着移动应用的普及和安全需求的提升,验证码动画作为提高用户体验和安全性的关键技术,正受到越来越多的关注。本文首先介绍Flutter框架下验证码动画的重要性和基本实现原理,涵盖了动画的类型、应用场景、设计原则以及开发工具和库。接着,文章通过实践篇深入探讨了在Flutter环境下如何具体实现验证码动画,包括基础动画的制作、进阶技巧和自定义组件的开发。优化篇
ENVI波谱分类算法:从理论到实践的完整指南
# 摘要
ENVI软件作为遥感数据处理的主流工具之一,提供了多种波谱分类算法用于遥感图像分析。本文首先概述了波谱分类的基本概念及其在遥感领域的重要性,然后介绍了ENVI软件界面和波谱数据预处理的流程。接着,详细探讨了ENVI软件中波谱分类算法的实现方法,通过实践案例演示了像元级和对象级波谱分类算法的操作。最后,文章针对波谱分类的高级应用、挑战及未来发展进行了讨论,重点分析了高光谱数据分类和深度学习在波谱分类中的应用情况,以及波谱分类在土地覆盖制图和农业监测中的实际应用。
# 关键字
ENVI软件;波谱分类;遥感图像;数据预处理;分类算法;高光谱数据
参考资源链接:[使用ENVI进行高光谱分
【天线性能提升密籍】:深入探究均匀线阵方向图设计原则及案例分析
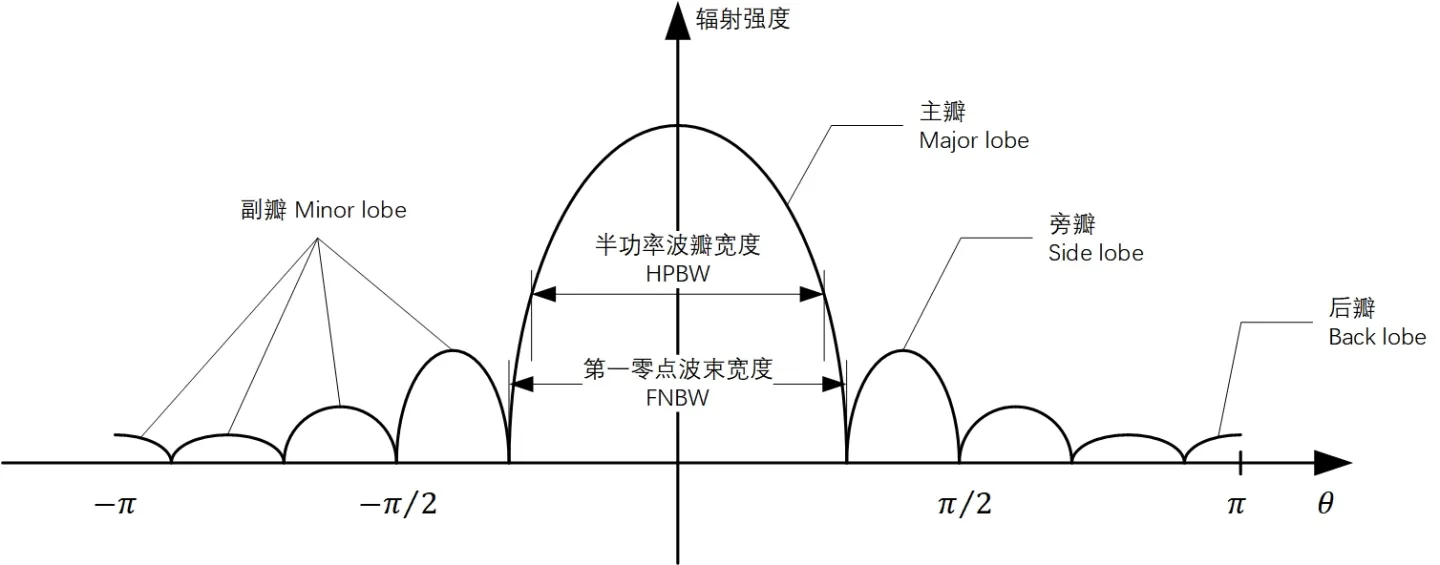
# 摘要
本文深入探讨了均匀线阵天线的基础理论及其方向图设计,旨在提升天线系统的性能和应用效能。文章首先介绍了均匀线阵及方向图的基本概念,并阐述了方向图设计的理论基础,包括波束形成与主瓣及副瓣特性的控制。随后,论文通过设计软件工具的应用和实际天线系统调试方法,展示了方向图设计的实践技巧。文中还包含了一系列案例分析,以实证研究验证理论,并探讨了均匀线阵性能
【兼容性问题】快解决:专家教你确保光盘在各设备流畅读取
/i.s3.glbimg.com/v1/AUTH_08fbf48bc0524877943fe86e43087e7a/internal_photos/bs/2021/L/w/I3DfXKTAmrqNi0rGtG5A/2014-06-24-cd-dvd-bluray.png)
# 摘要
光盘作为一种传统的数据存储介质,其兼容性问题长
资源上传下载、课程学习等过程中有任何疑问或建议,欢迎提出宝贵意见哦~我们会及时处理!
点击此处反馈


专栏目录
最低0.47元/天 解锁专栏
买1年送3月
百万级
高质量VIP文章无限畅学
千万级
优质资源任意下载
C知道
免费提问 ( 生成式Al产品 )