排序算法的算法可视化:直观理解排序算法的运行过程
发布时间: 2024-08-24 12:30:27 阅读量: 23 订阅数: 33 

7种排序算法可视化(matlab版本).rar
# 1. 排序算法概述
排序算法是一种计算机算法,用于对一组元素进行排序,使其满足特定的顺序。排序算法在计算机科学和软件开发中广泛应用,是数据结构和算法的基础知识之一。
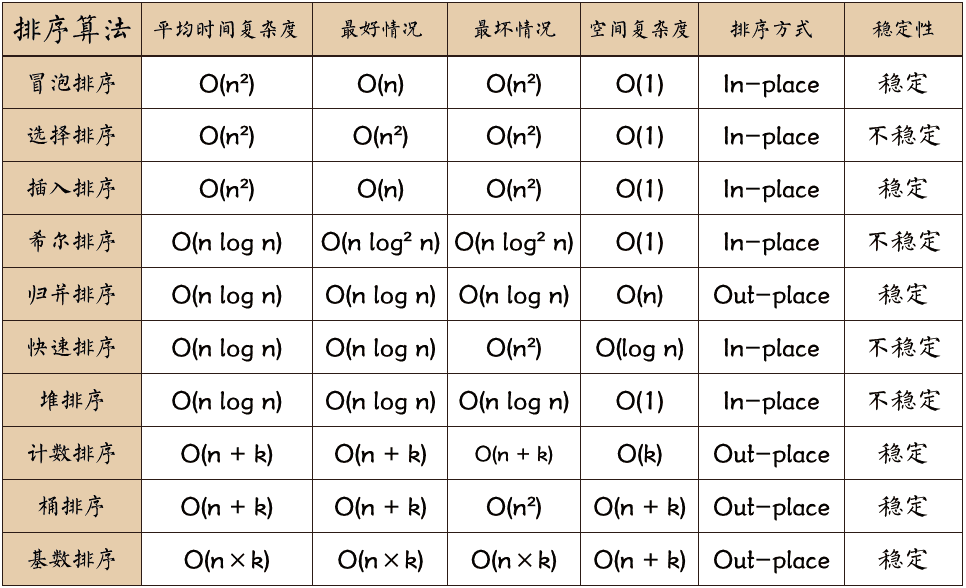
排序算法的分类有多种,根据比较元素的方式,可分为比较排序和非比较排序;根据排序过程的稳定性,可分为稳定排序和不稳定排序;根据算法的复杂度,可分为时间复杂度为 O(n^2) 的简单排序和时间复杂度为 O(n log n) 的高级排序。
排序算法的复杂度分析是排序算法研究中的重要内容,它可以帮助我们了解算法的效率和性能。常见的复杂度分析包括时间复杂度、空间复杂度和稳定性分析。时间复杂度衡量算法执行所需的时间,空间复杂度衡量算法执行所需的空间,稳定性衡量算法在相同元素排序时的顺序保持情况。
# 2. 排序算法的理论基础
### 2.1 排序算法的分类和比较
排序算法的分类方法有多种,常见的有以下几种:
| 分类方式 | 子类别 | 特点 |
|---|---|---|
| 比较排序 | 冒泡排序、选择排序、插入排序、快速排序、归并排序、堆排序 | 通过比较元素大小进行排序 |
| 非比较排序 | 计数排序、基数排序、桶排序 | 利用元素的特定性质进行排序 |
| 在线排序 | 归并排序、堆排序 | 可以处理流式数据 |
| 离线排序 | 冒泡排序、选择排序、插入排序 | 需要将所有数据加载到内存中 |
不同类型的排序算法具有不同的特点和适用场景。比较排序算法普遍适用于各种数据类型,但时间复杂度较高;非比较排序算法时间复杂度较低,但仅适用于特定类型的数据。在线排序算法可以处理流式数据,但空间复杂度较高;离线排序算法空间复杂度较低,但需要将所有数据加载到内存中。
### 2.2 排序算法的复杂度分析
排序算法的复杂度主要由比较次数和交换次数决定。比较次数是指算法中比较元素大小的次数,交换次数是指算法中交换元素位置的次数。
排序算法的时间复杂度通常用大 O 符号表示,表示算法在最坏情况下的时间复杂度。常见的时间复杂度有:
| 时间复杂度 | 含义 |
|---|---|
| O(n) | 线性时间复杂度,随着数据规模的增加,时间复杂度线性增长 |
| O(n^2) | 平方时间复杂度,随着数据规模的增加,时间复杂度呈平方级增长 |
| O(n log n) | 对数时间复杂度,随着数据规模的增加,时间复杂度呈对数级增长 |
### 2.3 排序算法的稳定性和空间复杂度
稳定性是指算法在对相同元素进行排序时,保持其相对顺序。例如,对于数组 [1, 2, 2, 3],稳定排序算法会输出 [1, 2, 2, 3],而不稳定排序算法可能会输出 [1, 2, 3, 2]。
空间复杂度是指算法在执行过程中所需要的额外空间。空间复杂度通常用大 O 符号表示,表示算法在最坏情况下的空间复杂度。常见的空间复杂度有:
| 空间复杂度 | 含义 |
|---|---|
| O(1) | 常数空间复杂度,算法不需要额外的空间 |
| O(n) | 线性空间复杂度,随着数据规模的增加,算法需要的额外空间线性增长 |
| O(n^2) | 平方空间复杂度,随着数据规模的增加,算法需要的额外空间呈平方级增长 |
**代码块:**
```python
def bubble_sort(arr):
"""
冒泡排序算法
参数:
arr:待排序数组
返回:
排序后的数组
"""
n = len(arr)
for i in range(n):
for j in range(0, n - i - 1):
if arr[j] > arr[j + 1]:
arr[j], arr[j + 1] = arr[j + 1], arr[j]
return arr
```
**逻辑分析:**
冒泡排序算法通过比较相邻元素的大小,将较大的元素向后移动,依次进行比较,直到所有元素有序。算法的时间复杂度为 O(n^2),空间复杂度为 O(1)。
**参数说明:**
* `arr`:待排序数组,是一个可变列表。
# 3.1 可视化工具的选择和使用
### 可视化工具的类型
可视化排序算法需要使用可视化工具来展示算法的执行过程。常用的可视化工具类型包括:
- **图形库:**如 D3.js、Chart.js 和 Highcharts,它们提供了一系列预定义的图表和可视化组件,可以轻松创建交互式图形。
- **动画库:**如 GreenSock、Velocity.js 和 Anime.js,它们提供了一系列动画功能,可以创建平滑流畅的动画效果。
- **Web 框架:**如 React、Vue.js 和 Angular,它们提供了构建交互式 Web 应用程序的框架,可以轻松集成可视化组件。
### 可视化工具的选择因素
选择可视化工具时,需要考虑以下因素:
- **功能:**工具是否提供所需的图表类型、动画功能和交互性。
- **易用性:**工具的学习曲线是否平缓,是否易于集成到项目中。
- **性能:**工具在处理大量数据和复杂动画时的性能如何。
- **社区支持:**工具是否有活跃的社区,可以提供支持和资源。
### 常用可视化工具推荐
根据上述因素,推荐以下可视化工具用于排序算法可视化:
- **D3.js:**一个功能强大的图形库,提供了丰富的图表类型和可定制性。
- **GreenSock:**一个高级动画库,可以创建平滑流畅的动画效果。
- **React:**一个流行的 Web 框架,可以轻松构建交互式可视化应用程序。
## 3.2 排序算法可视化效果的实现
### 可视化算法执行过程
可视化排序算法执行过程需要以下步骤:
1. **初始化数据:**生成一个随机数据数组。
2. **创建可视化元素:**使用可视化工具

 百万级
高质量VIP文章无限畅学
百万级
高质量VIP文章无限畅学
 千万级
优质资源任意下载
千万级
优质资源任意下载
 C知道
免费提问 ( 生成式Al产品 )
C知道
免费提问 ( 生成式Al产品 )
0
0
相关推荐

专栏简介
本专栏深入探讨了排序算法的实现和优化实战。从十大常见算法的奥秘揭示到时间复杂度和空间效率的优化秘籍,专栏提供了一个全面的指南,帮助读者掌握排序算法的精髓。通过深入浅出的讲解和实际案例,专栏旨在提升读者的算法实现和优化能力,为他们在数据处理和算法设计方面提供宝贵的知识和技能。
专栏目录
最低0.47元/天 解锁专栏
买1年送3月
百万级
高质量VIP文章无限畅学
千万级
优质资源任意下载
C知道
免费提问 ( 生成式Al产品 )
最新推荐
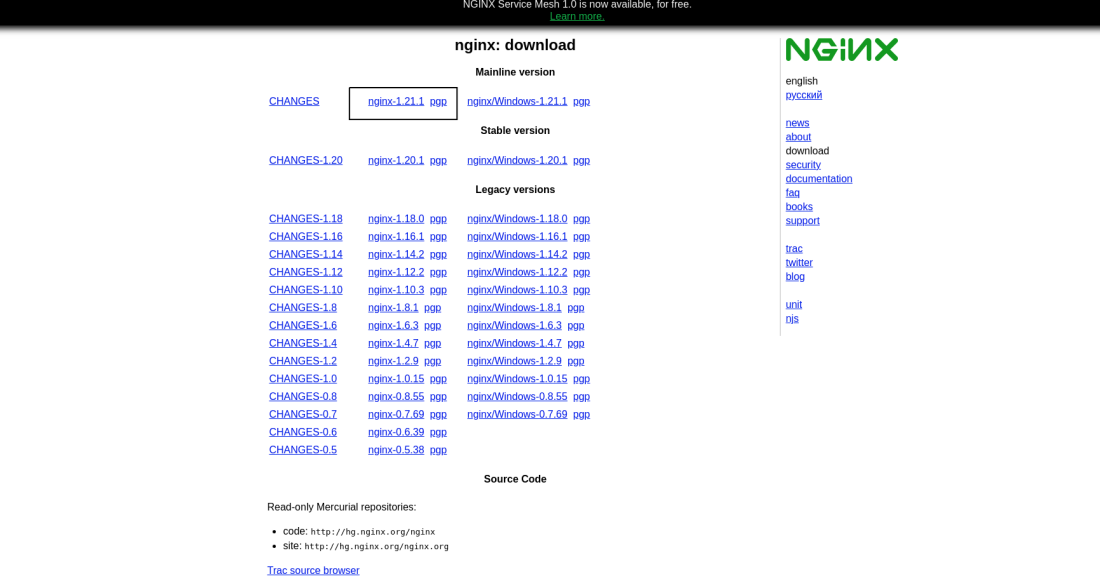
Nginx图片服务故障排查:10个步骤,确保网站稳定运行
# 摘要
本文全面介绍了Nginx图片服务的架构、监控、故障诊断和优化策略。首先概述了Nginx图片服务的工作原理和处理流程,强调了环境与工具准备的重要性。随后,文中详细阐述了故障排查的步骤,包括服务状态检查、故障现象确认,以及常见故障的识别与分析。在优化策略部分,讨论了图片缓存、带宽管理、并发控制、安全性和异常处理的改进措施。最后
【802.3BS-2017部署攻略】:网络架构升级的必读指南

# 摘要
本文全面探讨了802.3bs-2017标准对网络架构升级的影响与实践。首先解释了802.3bs-2017标准的理论基础及其关键技术特性,然后分析了网络架构升级的意义、目标、策略以及风险评估。文章接着深入介绍升级前的网络评估与优化、实际操作中的步骤和注意事项,以及升级后的测试和验证方法。最后,本文通过不同行业的应用案例来具体展示8
【日鼎伺服驱动器进阶技巧】:通信、控制、与PLC集成深度解析

# 摘要
本论文系统介绍了日鼎伺服驱动器的技术基础、通信协议、控制技术实践、与PLC的集成以及故障诊断与维护策略。详细阐述了伺服驱动器的通信协议、控制模式选择、参数优化、速度位置转矩控制以及高级控制算法应用。同时,讨论了伺服驱动器与PLC集成的基本流程、程序设计与调试技巧以及高级集成案例分析。此外,对伺服驱动器的常见故障诊断、维护保养策略及故障案例进行了深入分析。最后,展望了伺服驱动器在智能化、绿色制造
YC1026实践技巧:如何有效利用技术数据表做出明智决策
# 摘要
本文详细探讨了技术数据表的基础知识,以及它在数据分析、业务优化、市场分析和风险管理中的应用。文章首先介绍了数据表的关键指标解析、比较分析方法、决策树构建和模型验证。随后,通过实践应用案例分析,展示了数据表在实际业务中的重要性和其在决策支持系统中的作用。文章还介绍了高级数据分析技术,包括大数据、预测分析、数据挖掘和可视化技术在数据表中
CDD文件错误处理:错误诊断与修复的高级技巧

# 摘要
CDD文件错误处理是确保数据完整性和系统稳定性的关键技术。本文从CDD文件错误处理概述入手,详细探讨了CDD文件的结构、错误诊断技术和修复策略。本文不仅介绍了文件结构分析、错误识别方法和定位策略,还深入讨论了修复工具和脚本应用、手动修复技巧以及修复效果的验证与优化。在案例分析章节,本文提供了现场修复案例和复杂错误分析,总结了预防措施和维护建议。文章最后对C
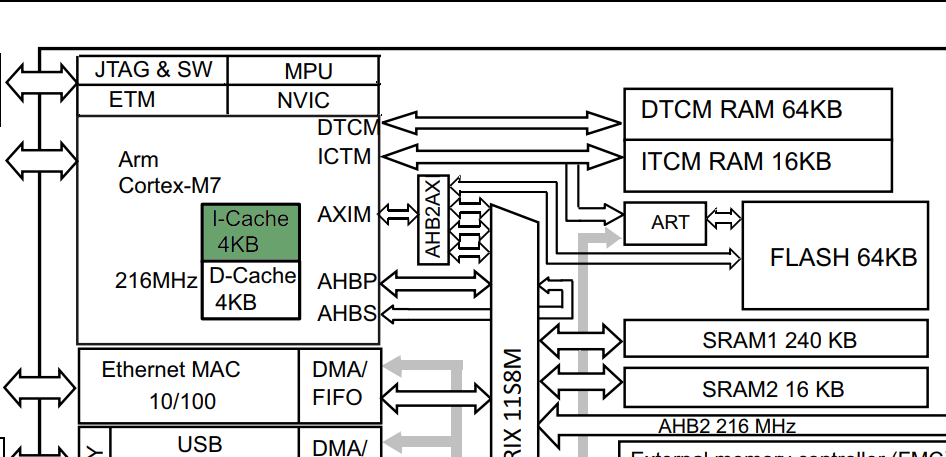
构建稳定STM32F767IGT6系统:嵌入式应用设计与电源管理策略
# 摘要
本文针对STM32F767IGT6系统进行了全面的概述与分析,重点关注嵌入式应用设计的基础、系统开发实践以及电源管理策略。首先,文章介绍了STM32F767IGT6的硬件架构、存储器管理以及软件设计理论基础。其次,通过硬件接口和驱动开发、应用层软件开发以及性能优化等实践环节,展示了系统开发的详细过程。此外,本文还深入探讨了电源管理系统设计原理和低功耗设计技术,并通过实际案例分析了电源管理策略和节能效果。最后,文章阐
EB工具自动化革命:用脚本让重复任务消失
# 摘要
随着信息技术的迅速发展,EB工具作为一种新兴的自动化技术,正在对现代IT行业产生革命性的影响。本文首先概述了EB工具与自动化革命的关系,进而深入探讨了EB工具的基础理论、安装配置、脚本编写以及实践应用。特别地,本文详细分析了EB工具在软件自动化测试、系统运维和DevOps中的集成实践,同时指出了EB工具目前面临的挑战和发展趋势。通过多个实战案例,本文揭示了EB工具如何提高效率、降低成本,并为IT专业人员提
性能保持秘诀:HMC7043LP7FE定期检查与维护手册
# 摘要
HMC7043LP7FE是一款高性能微波集成电路,广泛应用于各类通信和测量设备。本文旨在提供一个全面的概述和性能指标分析,同时详细介绍日常检查流程、定期维护实践及高级维护技巧。文章强调了对HMC7043LP7FE进行基本检查项和性能测试的重要性,并讨论了故障排查、预防性维护和性能优化策略。此外,本文探讨了环境因素对设备性能的影响以及有效的故障修复案例分析,以提供实用的维护和故障处理经验。
# 关键字
资源上传下载、课程学习等过程中有任何疑问或建议,欢迎提出宝贵意见哦~我们会及时处理!
点击此处反馈


专栏目录
最低0.47元/天 解锁专栏
买1年送3月
百万级
高质量VIP文章无限畅学
千万级
优质资源任意下载
C知道
免费提问 ( 生成式Al产品 )