
Sustainability 2021, 13, 10100 3 of 15
industrialization level. In conclusion, the selected study areas are similar in agricultural
development, so conducting multi-scale research on CLQ is typical and feasible.
Sustainability 2021, 13, x FOR PEER REVIEW 3 of 16
The cultivated layer texture is primarily light, medium, and sandy loam soil. The texture
configuration is primarily loam and clay interlayer, with a deep soil layer. Wheat and
maize are the main grain crops, and cotton and peanut are the main cash crops, with a
high agricultural modernization and industrialization level. In conclusion, the selected
study areas are similar in agricultural development, so conducting multi-scale research
on CLQ is typical and feasible.
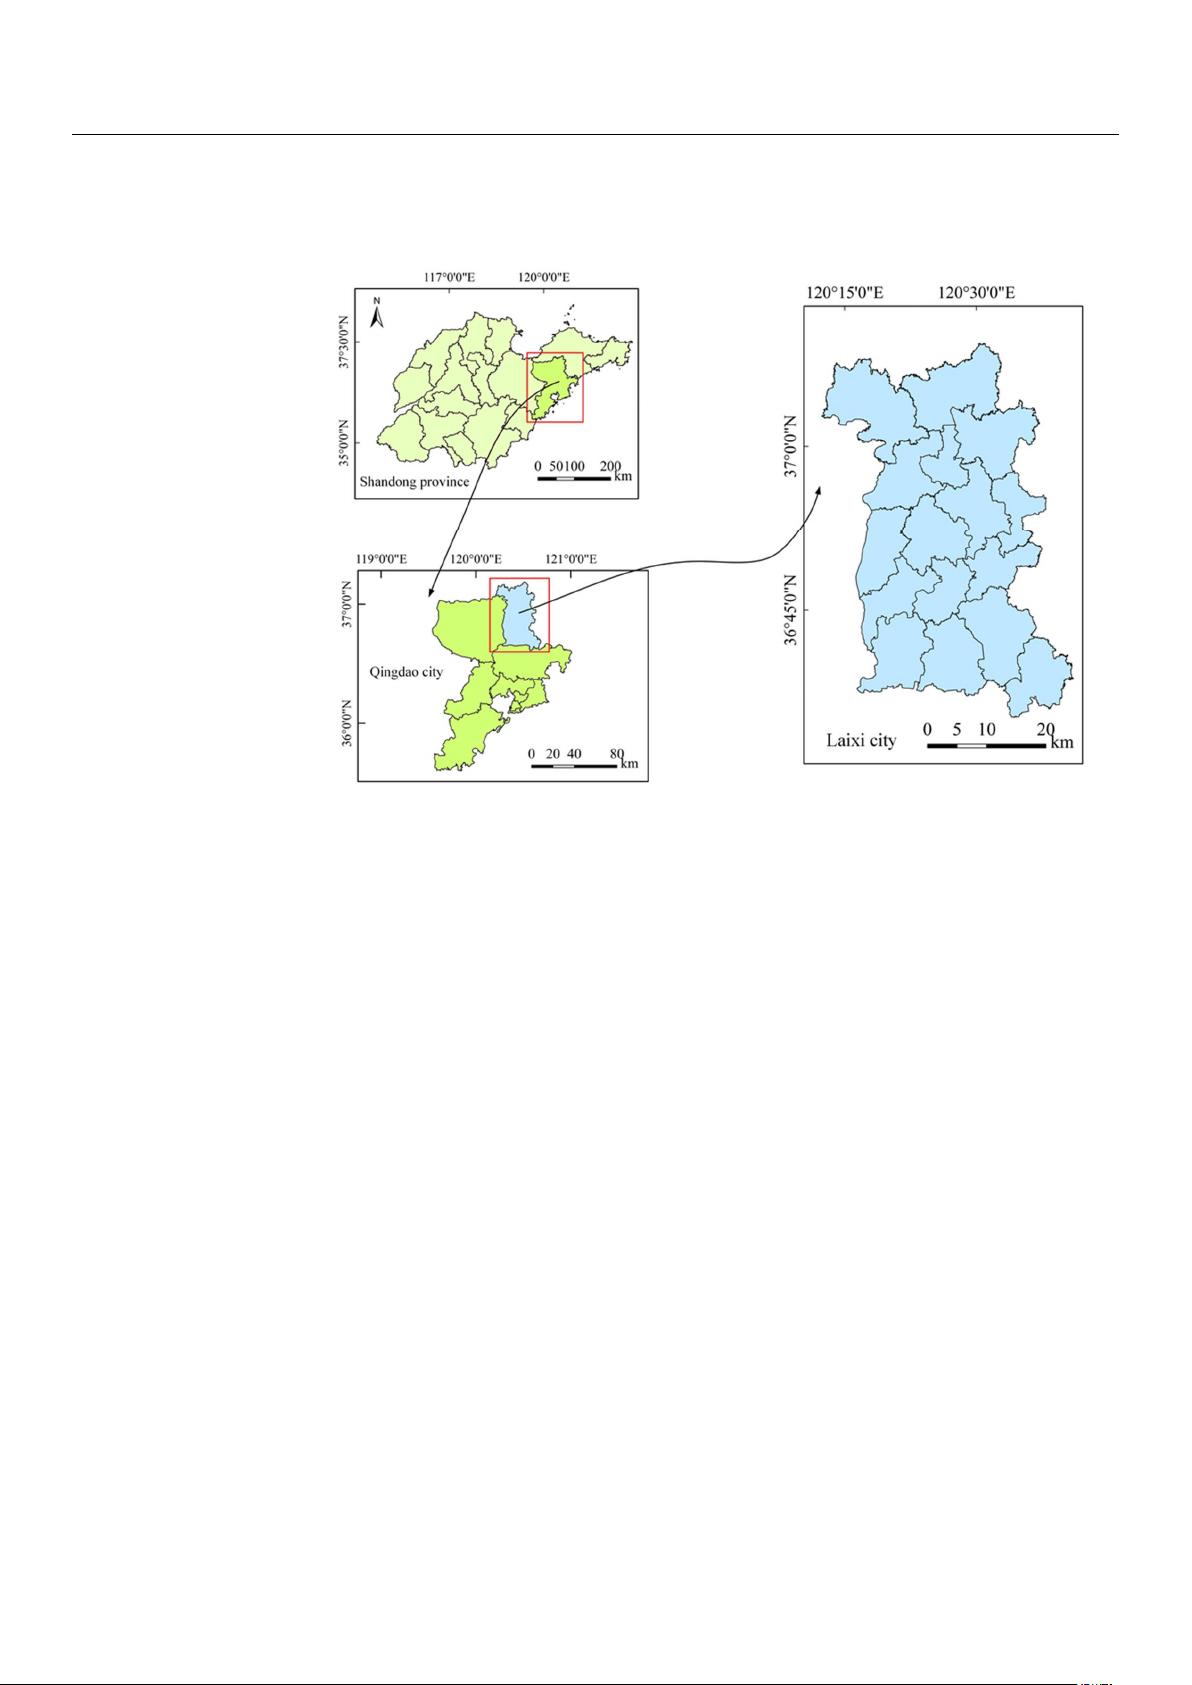
Figure 1. Distribution map of the study area.
2.2. Data Source and Preprocessing
The CLQ evaluation data are mainly derived from the cultivated land fertility evalu-
ation, soil testing, and formula fertilization project of Laixi city, Qingdao city, and Shan-
dong province (2007–2011), based on the second national land use survey in China (here-
inafter called “the second survey”), and the cultivated land quality evaluation project of
Laixi city (2020), based on the third national land use survey in China (hereinafter called
“the third survey”). The data content includes the sampling sites data, thematic maps, and
relevant statistical data. As for sampling data, there are 2000, 2553, and 44,966 sites in
Laixi, Qingdao, and Shandong in the second survey, and 988 sites in Laixi in the third
survey. The data is mainly investigating the topography, soil parent material, and man-
agement level around the points, and analyzing the primary nutrient information such as
organic matter, available potassium, and available phosphorus. Thematic maps include a
land use status map, a soil map, and an administrative zoning map (scale: 1:50,000,
1:100,000, 1:500,000, and 1:50,000), and the statistical data mainly includes land area, pop-
ulation area, and various input-output indicators.
In this study, The Inverse Distance Weight (IDW) method was used to interpolate
soil nutrients. The IDW method assumes that the value at an unknown location can be
approximated as a weighted average of values at points within a certain cut-off distance
[23]. The weighted index P was set as two by default, and the grid map resolution was set
according to the study area scale to ensure that the evaluation unit could obtain the cor-
responding nutrient values. To better manage the data, the basic information of sampling
points and soil test data were recorded in the survey points as the primary database, and
the attribute database was established. At the same time, the grid maps interpolated by
Figure 1. Distribution map of the study area.
2.2. Data Source and Preprocessing
The CLQ evaluation data are mainly derived from the cultivated land fertility evalua-
tion, soil testing, and formula fertilization project of Laixi city, Qingdao city, and Shandong
province (2007–2011), based on the second national land use survey in China (hereinafter
called “the second survey”), and the cultivated land quality evaluation project of Laixi
city (2020), based on the third national land use survey in China (hereinafter called “the
third survey”). The data content includes the sampling sites data, thematic maps, and
relevant statistical data. As for sampling data, there are 2000, 2553, and 44,966 sites in Laixi,
Qingdao, and Shandong in the second survey, and 988 sites in Laixi in the third survey.
The data is mainly investigating the topography, soil parent material, and management
level around the points, and analyzing the primary nutrient information such as organic
matter, available potassium, and available phosphorus. Thematic maps include a land
use status map, a soil map, and an administrative zoning map (scale: 1:50,000, 1:100,000,
1:500,000, and 1:50,000), and the statistical data mainly includes land area, population area,
and various input-output indicators.
In this study, The Inverse Distance Weight (IDW) method was used to interpolate
soil nutrients. The IDW method assumes that the value at an unknown location can be
approximated as a weighted average of values at points within a certain cut-off distance [
23
].
The weighted index P was set as two by default, and the grid map resolution was set
according to the study area scale to ensure that the evaluation unit could obtain the
corresponding nutrient values. To better manage the data, the basic information of sampling
points and soil test data were recorded in the survey points as the primary database, and
the attribute database was established. At the same time, the grid maps interpolated by
nutrients and vectorized thematic maps were stored in the form of grid and point, line, and
area files, respectively, to form a primary thematic map graph database. All kinds of data
are collected and sorted, and the primary database of CLQ evaluation is constructed.
剩余14页未读,继续阅读

黑咖不苦白咖苦
- 粉丝: 2
- 资源: 4
 我的内容管理
展开
我的内容管理
展开


最新资源
- 计算机人脸表情动画技术发展综述
- 关系数据库的关键字搜索技术综述:模型、架构与未来趋势
- 迭代自适应逆滤波在语音情感识别中的应用
- 概念知识树在旅游领域智能分析中的应用
- 构建is-a层次与OWL本体集成:理论与算法
- 基于语义元的相似度计算方法研究:改进与有效性验证
- 网格梯度多密度聚类算法:去噪与高效聚类
- 网格服务工作流动态调度算法PGSWA研究
- 突发事件连锁反应网络模型与应急预警分析
- BA网络上的病毒营销与网站推广仿真研究
- 离散HSMM故障预测模型:有效提升系统状态预测
- 煤矿安全评价:信息融合与可拓理论的应用
- 多维度Petri网工作流模型MD_WFN:统一建模与应用研究
- 面向过程追踪的知识安全描述方法
- 基于收益的软件过程资源调度优化策略
- 多核环境下基于数据流Java的Web服务器优化实现提升性能
资源上传下载、课程学习等过程中有任何疑问或建议,欢迎提出宝贵意见哦~我们会及时处理!
点击此处反馈


