Python时间序列分析:协整与误差修正模型应用指南
发布时间: 2024-08-31 20:09:17 阅读量: 141 订阅数: 81 

# 1. 时间序列分析基础
在本章中,我们将从时间序列分析的基础知识入手,为读者提供一个全面的概览。时间序列分析是对按时间顺序排列的观测值的统计分析方法,它能够帮助我们识别数据中的模式、趋势、季节性变化以及其他相关特征。
## 1.1 时间序列的组成要素
时间序列由以下几个要素组成:
- **趋势(Trend)**:时间序列数据中的长期方向,可以是上升、下降或平稳。
- **周期性(Seasonality)**:数据随时间的固定周期性波动,如每年的季节性变化。
- **季节性(Seasonal)**:周期内特定时间段内的重复模式,通常与日历相关。
- **随机波动(Irregular)**:无法通过趋势和周期性解释的随机变化。
理解这些要素是分析时间序列数据并进行有效预测的关键。
## 1.2 时间序列分析的目的
时间序列分析的主要目的包括:
- **描述性分析**:揭示数据中的模式、趋势、季节性及其他特征。
- **预测**:根据历史数据预测未来走势,如销售额、股票价格等。
- **异常值检测**:识别时间序列中的异常点,这对于异常检测和质量控制至关重要。
- **模型验证**:评估所建立模型的准确性和适用性。
本章将为接下来各章节内容的深入探讨提供坚实的理论基础。
# 2. Python在时间序列分析中的应用
时间序列分析是金融、经济、工程等多个领域内的重要分析手段。随着数据科学的发展,Python逐渐成为这一领域的热门工具,其强大的库生态系统使复杂的时间序列分析变得简便快捷。本章节将探讨Python在时间序列数据处理、分析、图形化展示等方面的应用。
## 2.1 时间序列数据的处理
### 2.1.1 数据导入与格式化
时间序列数据的导入是进行分析的第一步。在Python中,我们通常使用pandas库来处理数据。pandas提供了非常便捷的数据导入函数,比如`read_csv()`可以读取CSV文件,`read_excel()`可以读取Excel文件。对于非标准格式的文件,pandas同样提供了解析机制来导入数据。
```python
import pandas as pd
# 读取CSV文件
data = pd.read_csv('time_series_data.csv', index_col='date', parse_dates=True)
# 如果有缺失日期,可以进行填充
data = data.asfreq('D')
# 读取Excel文件
data = pd.read_excel('time_series_data.xlsx', index_col='date', parse_dates=True)
```
在上面的代码中,`index_col='date'`指明了作为索引的时间列,而`parse_dates=True`确保将时间列转换为日期时间格式,这对于后续的时间序列操作至关重要。
### 2.1.2 数据清洗和预处理
数据预处理是时间序列分析中不可或缺的一步。这包括处理缺失值、异常值,以及数据的标准化等。pandas提供了`fillna()`方法来填充缺失值,`dropna()`方法来删除含有缺失值的行,以及`replace()`方法来替换异常值。
```python
# 填充缺失值,这里使用前一个时间点的值进行填充
data_filled = data.fillna(method='ffill')
# 删除含有缺失值的行
data_dropped = data.dropna()
# 替换异常值为均值
data['value'] = data['value'].replace(data['value'].mean())
```
在进行数据清洗后,我们往往需要对时间序列数据进行重采样,例如按日、按周、按月汇总数据,`resample()`方法提供了这样的功能。
```python
# 按月求和
data_monthly = data.resample('M').sum()
```
## 2.2 Python时间序列分析工具
### 2.2.1 Pandas库简介
Pandas是Python中进行数据分析的核心库,它提供了高级数据结构和函数,使得时间序列分析变得异常简单。Pandas中有两个重要的数据结构:Series和DataFrame。其中,Series是带有时间标签的一维数组,而DataFrame则是二维的表格型数据结构,非常适合处理多变量的时间序列数据。
### 2.2.2 使用Pandas进行时间序列分析
Pandas提供了许多内置方法来分析时间序列数据。例如,我们可以使用`rolling()`方法进行滚动窗口分析,使用`shift()`方法进行数据移动,使用`rolling_apply()`或`rolling_corr()`等函数进行基于窗口的计算。
```python
# 计算过去3个月的移动平均
data['rolling_mean'] = data['value'].rolling(window=3).mean()
# 使用移动窗口计算相关性
data['rolling_corr'] = data['value'].rolling(window=3).corr(data['another_series'])
```
### 2.2.3 其他Python库的辅助作用
除了Pandas之外,Python还有许多其他库在时间序列分析中扮演重要角色。例如,NumPy提供了高性能的数值运算功能;SciPy提供了更多的科学计算方法;Matplotlib和Seaborn则是数据可视化的重要工具。
```python
import matplotlib.pyplot as plt
import seaborn as sns
# 绘制时间序列数据
plt.figure(figsize=(10, 5))
sns.lineplot(data=data)
plt.show()
```
## 2.3 Python图形化展示时间序列数据
### 2.3.1 绘图工具介绍
在Python中,Matplotlib和Seaborn是最为常见的绘图库。Matplotlib提供了极高的灵活性和定制性,而Seaborn则提供了更多高级图表类型和美观的默认主题设置。
### 2.3.2 时间序列的可视化展示
时间序列数据的可视化对于洞察数据趋势、周期性、季节性等特征至关重要。使用`plot()`方法可以在pandas的Series或DataFrame对象上直接绘图。
```python
# 绘制原始时间序列数据
data['value'].plot(title='Time Series Plot')
plt.show()
```
此外,我们还可以使用Seaborn的`lineplot()`函数来绘制更加复杂的图表。
```python
# 使用Seaborn绘图
sns.lineplot(x=data.index, y='value', data=data)
plt.titl
```

 百万级
高质量VIP文章无限畅学
百万级
高质量VIP文章无限畅学
 千万级
优质资源任意下载
千万级
优质资源任意下载
 C知道
免费提问 ( 生成式Al产品 )
C知道
免费提问 ( 生成式Al产品 )
0
0
相关推荐

专栏简介
本专栏深入探讨了 Python 中时间序列分析的各个方面,从基础到高级应用。它涵盖了数据预处理、预测模型构建、准确性提升技巧以及在金融等领域的应用。专栏还比较了 Pandas、NumPy 和 SciPy 等时间序列工具箱,并提供了季节性分解、交叉验证、滑动窗口技术、时间频率转换、可视化、特征工程、时间对齐、聚类分析、模拟和因果关系检验等主题的详细指南。通过循序渐进的解释和实操案例,本专栏旨在帮助读者掌握时间序列分析的各个方面,并将其应用于实际问题中。
专栏目录
最低0.47元/天 解锁专栏
买1年送3月
百万级
高质量VIP文章无限畅学
千万级
优质资源任意下载
C知道
免费提问 ( 生成式Al产品 )
最新推荐
AMESim液压仿真秘籍:专家级技巧助你从基础飞跃至顶尖水平

# 摘要
AMESim液压仿真软件是工程师们进行液压系统设计与分析的强大工具,它通过图形化界面简化了模型建立和仿真的流程。本文旨在为用户提供AMESim软件的全面介绍,从基础操作到高级技巧,再到项目实践案例分析,并对未来技术发展趋势进行展望。文中详细说明了AMESim的安装、界面熟悉、基础和高级液压模型的建立,以及如何运行、分析和验证仿真结果。通过探索自定义组件开发、多学科仿真集成以及高级仿真算法的应用,本文
【高频领域挑战】:VCO设计在微波工程中的突破与机遇
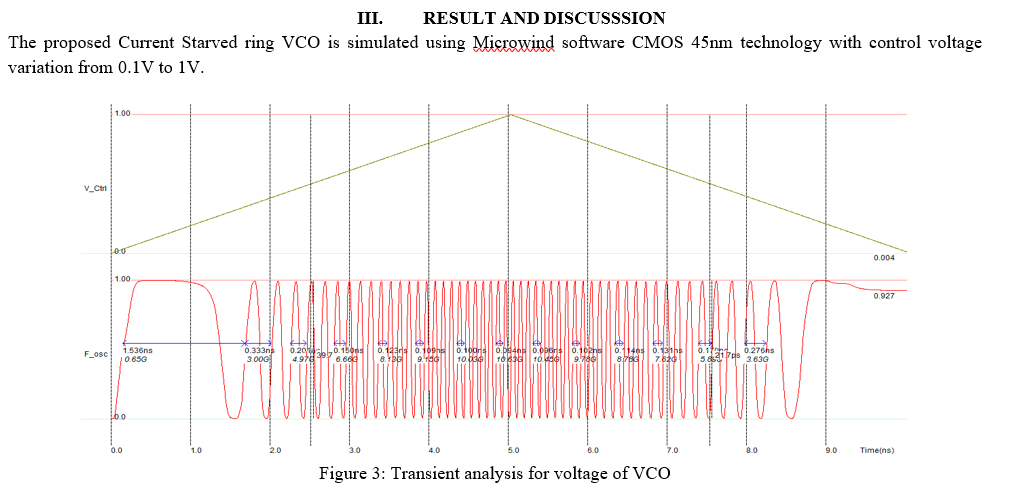
# 摘要
本论文深入探讨了压控振荡器(VCO)的基础理论与核心设计原则,并在微波工程的应用技术中展开详细讨论。通过对VCO工作原理、关键性能指标以及在微波通信系统中的作用进行分析,本文揭示了VCO设计面临的主要挑战,并提出了相应的技术对策,包括频率稳定性提升和噪声性能优化的方法。此外,论文还探讨了VCO设计的实践方法、案例分析和故障诊断策略,最后对VCO设计的创新思路、新技术趋势及未来发展挑战
实现SUN2000数据采集:MODBUS编程实践,数据掌控不二法门
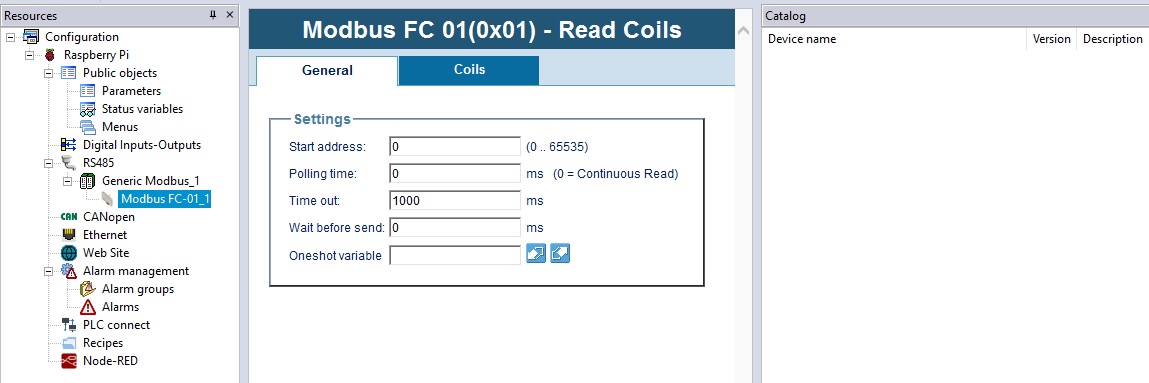
# 摘要
本文系统地介绍了MODBUS协议及其在数据采集中的应用。首先,概述了MODBUS协议的基本原理和数据采集的基础知识。随后,详细解析了MODBUS协议的工作原理、地址和数据模型以及通讯模式,包括RTU和ASCII模式的特性及应用。紧接着,通过Python语言的MODBUS库,展示了MODBUS数据读取和写入的编程实践,提供了具体的实现方法和异常管理策略。本文还结合SUN20
【性能调优秘籍】:深度解析sco506系统安装后的优化策略
# 摘要
本文对sco506系统的性能调优进行了全面的介绍,首先概述了性能调优的基本概念,并对sco506系统的核心组件进行了介绍。深入探讨了核心参数调整、磁盘I/O、网络性能调优等关键性能领域。此外,本文还揭示了高级性能调优技巧,包括CPU资源和内存管理,以及文件系统性能的调整。为确保系统的安全性能,文章详细讨论了安全策略、防火墙与入侵检测系统的配置,以及系统审计与日志管理的优化。最后,本文提供了系统监控与维护的
网络延迟不再难题:实验二中常见问题的快速解决之道
# 摘要
网络延迟是影响网络性能的重要因素,其成因复杂,涉及网络架构、传输协议、硬件设备等多个方面。本文系统分析了网络延迟的成因及其对网络通信的影响,并探讨了网络延迟的测量、监控与优化策略。通过对不同测量工具和监控方法的比较,提出了针对性的网络架构优化方案,包括硬件升级、协议配置调整和资源动态管理等。
期末考试必备:移动互联网商业模式与用户体验设计精讲

# 摘要
移动互联网的迅速发展带动了商业模式的创新,同时用户体验设计的重要性日益凸显。本文首先概述了移动互联网商业模式的基本概念,接着深入探讨用户体验设计的基础,包括用户体验的定义、重要性、用户研究方法和交互设计原则。文章重点分析了移动应用的交互设计和视觉设计原则,并提供了设计实践案例。之后,文章转向移动商业模式的构建与创新,探讨了商业模式框架
【多语言环境编码实践】:在各种语言环境下正确处理UTF-8与GB2312
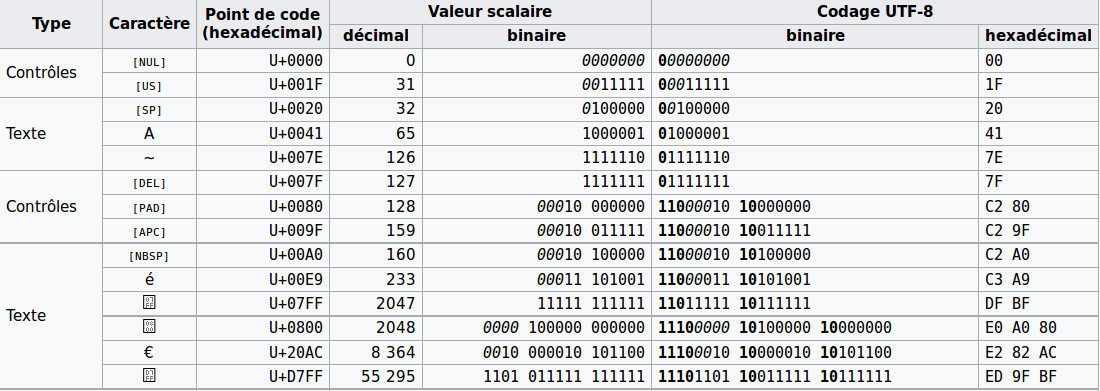
# 摘要
随着全球化的推进和互联网技术的发展,多语言环境下的编码问题变得日益重要。本文首先概述了编码基础与字符集,随后深入探讨了多语言环境所面临的编码挑战,包括字符编码的重要性、编码选择的考量以及编码转换的原则和方法。在此基础上,文章详细介绍了UTF-8和GB2312编码机制,并对两者进行了比较分析。此外,本文还分享了在不同编程语言中处理编码的实践技巧,
【数据库在人事管理系统中的应用】:理论与实践:专业解析
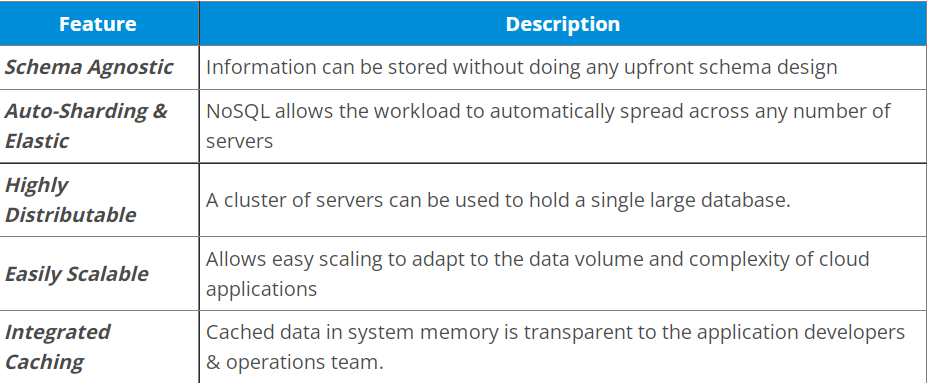
# 摘要
本文探讨了人事管理系统与数据库的紧密关系,分析了数据库设计的基础理论、规范化过程以及性能优化的实践策略。文中详细阐述了人事管理系统的数据库实现,包括表设计、视图、存储过程、触发器和事务处理机制。同时,本研究着重讨论了数据库的安全性问题,提出认证、授权、加密和备份等关键安全策略,以及维护和故障处理的最佳实践。最后,文章展望了人事管理系统的发展趋
【Docker MySQL故障诊断】:三步解决权限被拒难题
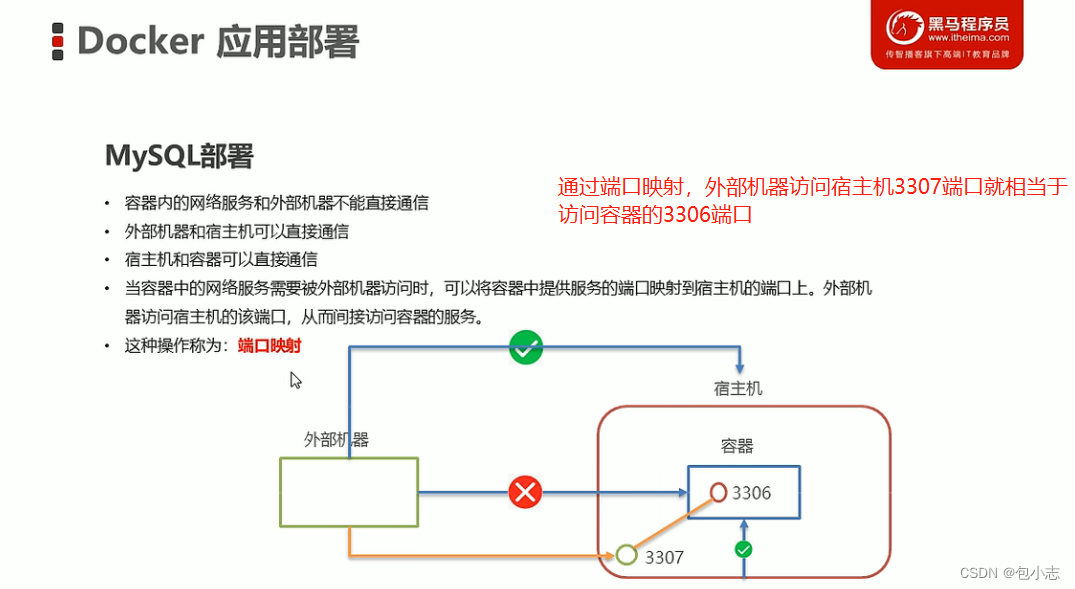
# 摘要
随着容器化技术的广泛应用,Docker已成为管理MySQL数据库的流行方式。本文旨在对Docker环境下MySQL权限问题进行系统的故障诊断概述,阐述了MySQL权限模型的基础理论和在Docker环境下的特殊性。通过理论与实践相结合,提出了诊断权限问题的流程和常见原因分析。本文还详细介绍了如何利用日志文件、配置检查以及命令行工具进行故障定位与修复,并探讨了权限被拒问题的解决策略和预防措施
资源上传下载、课程学习等过程中有任何疑问或建议,欢迎提出宝贵意见哦~我们会及时处理!
点击此处反馈


专栏目录
最低0.47元/天 解锁专栏
买1年送3月
百万级
高质量VIP文章无限畅学
千万级
优质资源任意下载
C知道
免费提问 ( 生成式Al产品 )