Python时间序列异常检测:算法实操与案例分析
发布时间: 2024-08-31 19:48:34 阅读量: 182 订阅数: 74 

LABVIEW程序实例-DS写属性数据.zip
# 1. 时间序列异常检测概念解析
时间序列异常检测是数据科学和统计学中的一个重要分支,其核心目的是识别出时间序列数据中的不规则或意外模式,这些模式通常代表了某种异常或罕见事件。在IT和相关行业中,这一技术广泛应用于监控系统、金融欺诈检测、网络入侵检测等领域。异常检测不仅可以帮助我们防范潜在的风险,还可以为决策者提供重要的洞察力,用于预测未来的发展趋势。
理解异常检测的基本概念首先需要明确什么是时间序列。时间序列是由按时间顺序排列的一系列数据点组成的数据集,例如每分钟的网络流量数据、每日的股票价格等。在这些数据中,异常通常表现为数据点在统计特性的显著偏离,如超出特定阈值或者与相邻数据点有较大的差异。
在本章的后续部分,我们将深入探讨时间序列异常检测的理论基础以及它在实际应用中的重要性,为读者打下坚实的基础。
# 2. 时间序列异常检测理论基础
### 2.1 时间序列数据的特性
时间序列数据是一组按时间顺序排列的数值数据点,用于记录某些现象在不同时间点的观测值。这些数据在不同领域如金融、气象、工业生产等都有广泛的应用。在进行时间序列异常检测之前,深入了解时间序列数据的特性至关重要。
#### 2.1.1 稳定性分析
稳定性是指时间序列在长期内的均值和方差保持不变。对于稳定性高的时间序列,其统计特性在时间上具有均匀性,也就是说,不同时期的数据分布是相似的。这种特性使得我们可以利用历史数据构建模型,并将其应用到未来数据上以进行预测。
在进行稳定性分析时,我们通常需要借助单位根检验,如ADF(Augmented Dickey-Fuller)检验,来判断一个时间序列是否稳定。ADF检验会检查时间序列中是否存在一个单位根,单位根的存在会使得时间序列非平稳。
```python
from statsmodels.tsa.stattools import adfuller
# 假设我们有一个名为 `ts` 的时间序列
result = adfuller(ts)
# ADF检验的输出包括
print('ADF Statistic: %f' % result[0])
print('p-value: %f' % result[1])
```
在上述代码中,我们使用了`statsmodels`库中的`adfuller`函数进行ADF检验。如果p值小于某个显著性水平(比如0.05),则拒绝原假设,认为时间序列是平稳的。
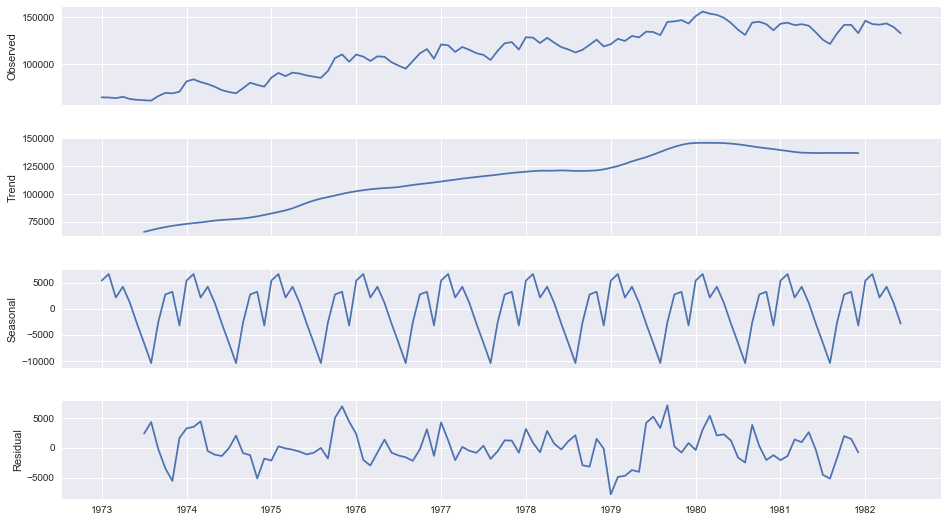
#### 2.1.2 季节性和趋势性
时间序列数据通常包含季节性和趋势性两个重要的成分:
- **季节性**是指数据在固定间隔周期内呈现的重复模式。例如,零售销售额在假日季节可能会上升。
- **趋势性**是指时间序列数据随时间推移呈现的长期变化趋势。
识别并理解时间序列数据中的季节性和趋势性对异常检测至关重要,因为它们可以帮助我们从数据中识别出真正的异常行为。
为了移除季节性和趋势性,常常采用时间序列分解的方法。例如,可以使用加法模型或乘法模型来分离出季节成分和趋势成分,这样我们就可以专注于残差部分,即异常值。
### 2.2 异常检测的基本理论
#### 2.2.1 异常检测的定义和分类
异常检测是一种数据分析过程,旨在识别数据集中与预期不一致的模式或行为,这种模式或行为通常被认为是异常或离群点。异常可以是有害的,比如信用卡欺诈,也可能是有价值的,如罕见事件的发现。
在分类上,异常检测可以分为以下几类:
- **监督学习方法**:需要一个标记过的数据集,其中包含了正常和异常样本。
- **无监督学习方法**:不需要标记数据,通过学习数据的底层结构来发现异常。
- **半监督学习方法**:使用有限的标记数据和大量未标记数据进行训练。
#### 2.2.2 常用的异常检测方法
在异常检测中,常用的统计方法有:
- **基于统计学的检测**:例如,利用标准差或四分位距(IQR)来识别异常值。
- **基于密度的方法**:例如,通过局部异常因子(Local Outlier Factor, LOF)来发现数据中的异常。
- **基于聚类的方法**:例如,基于K-means聚类的方法,将数据分成若干簇,然后识别不属于任何簇的数据点。
每种方法都有其特定的应用场景和限制,选择合适的方法需要根据具体问题进行。
### 2.3 Python中的时间序列处理库
#### 2.3.1 Pandas库的时间序列功能
Pandas是一个强大的Python数据分析工具库,提供了大量数据处理功能,尤其在时间序列处理上具有独特优势。Pandas中的`DatetimeIndex`和`TimedeltaIndex`允许用户方便地对时间序列数据进行索引和操作。
Pandas库中的时间序列功能还可以对数据进行重采样(Resampling),处理缺失数据(Imputation),以及对时间数据进行平滑(Rolling window)等操作。
```python
import pandas as pd
# 创建一个时间序列
index = pd.date_range('2020-01-01', periods=10, freq='M')
ts = pd.Series(range(10), index=index)
# 重采样时间序列
monthly_sum = ts.resample('M').sum()
print(monthly_sum)
```
#### 2.3.2 Scikit-learn和Statsmodels的异常检测工具
Scikit-learn和Statsmodels是Python中两个著名的统计学习和时间序列分析库。Scikit-learn提供了用于异常检测的接口,包括基于隔离森林(Isolation Forest)的算法等。而Statsmodels则提供了时间序列分析的工具,如ARIMA模型,可以用于构建时间序列预测模型,间接用于异常检测。
```python
from sklearn.ensemble import IsolationForest
# 假设 `X` 是特征数据集
model = IsolationForest()
model.fit(X)
# 进行异常检测
predictions = model.predict(X)
```
在上述代码中,我们使用了`IsolationForest`模型对数据集`X`进行异常检测。预测值为-1表示异常,1表示正常。
通过Scikit-learn和Statsmodels的工具,我们可以构建复杂的异常检测系统,并对数据进行深入分析。
以上为本章的详细内容,通过细致的理论剖析和实操示例,将为读者构建坚实的时间序列异常检测理论基础。在下一章中,我们将更进一步,深入实践,探索具体的异常检测算法及其应用案例。
# 3. 时间序列异常检测算法实战
在分析了时间序列异常检测的基本理论和相关工具后,本章节将深入探讨三种不同的算法,涵盖从基础的统计学方法到复杂的机器学习和深度学习方法。我们将通过实际应用实例,展示如何将理论应用于实践,从而在各种情境中有效地识别异常数据点。
#### 3.1 统计学方法
统计学方法在时间序列异常检测中占据重要地位,因其依赖于数据的统计特性,易于理解和实施。这两种方法分别是 Z-score 异常点检测和 IQR(四分位距)方法。我们将逐一解析,并给出具体的实现步骤。
##### 3.1.1 Z-score异常点检测
Z-score 方法是基于数据点与数据集均值的偏差来判定是否为异常的一种方法。数据点的 Z-score 是其偏差除以标准差的结果,若 Z-score 的绝对值远大于某个阈值(如3),则该数据点可能是一个异常。
```python
import numpy as np
from scipy.stats import zscore
# 示例数据
data = np.array([10, 12, 12, 13, 12, 11, 14, 14, 10, 100])
# 计算Z-score
z_scores = zscore(data)
# 设定阈值为3,找出异常点
threshold = 3
outliers = np.where(abs(z_scores) > threshold)
# 输出异常点
print(f"异常点索引: {outliers}")
print(f"异常点值: {data[outliers]}")
```
代码逻辑分析:
1. 引入numpy和scipy.stats库,用于处理数值数据和计算Z-score。
2. 创建示例数据集。
3. 使用`zscore`函数计算数据的Z-score值。
4. 设定异常判定阈值为3,然后找出大于此阈值的数据点索引。
5. 输出异常点的索引和实际值。
##### 3.1.2 IQR方法应用实例
IQR 是另一种利用统计方法检测异常的方式。它基于数据的四分位数来计算数据的离散程度,通常用于非正态分布数据。IQR 是第三四分位数(Q3)与第一四分位数(Q1)之差,若数据点超过 Q3 + 1.5*IQR 或 Q1 - 1.5*IQR 则被视为异常。
```python
import numpy as np
import pandas as pd
# 示例数据
data = pd.Series([10, 12, 12, 13, 12, 11, 14, 14, 10, 100])
# 计算四分位数
Q1 = data.quantile(0.25)
Q3 = data.quantile(0.75)
IQR = Q3 - Q1
# 计算异常点
lower_bound = Q1 - 1.5 * IQR
upper_bound = Q3 + 1.5 * IQR
outliers = data[(data < lower_bound) | (data > upper_bound)]
# 输出异常点
print(f"异常点值: {outliers.values}")
```
代码逻辑分析:
1. 导入numpy和pandas库,分别用于数据处理和计算。
2. 创建示例数据序列。
3. 使用`quantile`函数计算Q1和Q3,进而得到IQR值。
4. 根据IQR方法的规则设定异常的上下界。
5. 过滤出异常值并打印。
#### 3.2 机器学习方法
机器学习方法通常涉及模型的训练和预测过程。在异常检测领域,无

 百万级
高质量VIP文章无限畅学
百万级
高质量VIP文章无限畅学
 千万级
优质资源任意下载
千万级
优质资源任意下载
 C知道
免费提问 ( 生成式Al产品 )
C知道
免费提问 ( 生成式Al产品 )
0
0
相关推荐

专栏简介
本专栏深入探讨了 Python 中时间序列分析的各个方面,从基础到高级应用。它涵盖了数据预处理、预测模型构建、准确性提升技巧以及在金融等领域的应用。专栏还比较了 Pandas、NumPy 和 SciPy 等时间序列工具箱,并提供了季节性分解、交叉验证、滑动窗口技术、时间频率转换、可视化、特征工程、时间对齐、聚类分析、模拟和因果关系检验等主题的详细指南。通过循序渐进的解释和实操案例,本专栏旨在帮助读者掌握时间序列分析的各个方面,并将其应用于实际问题中。
专栏目录
最低0.47元/天 解锁专栏
买1年送3月
百万级
高质量VIP文章无限畅学
千万级
优质资源任意下载
C知道
免费提问 ( 生成式Al产品 )
最新推荐
【张量分解:技术革命与实践秘籍】:从入门到精通,掌握机器学习与深度学习的核心算法

# 摘要
张量分解作为数据分析和机器学习领域的一项核心技术,因其在特征提取、预测分类及数据融合等方面的优势而受到广泛关注。本文首先介绍了张量分解的基本概念与理论基础,阐述了其数学原理和优化目标,然后深入探讨了张量分解在机器学习和深度学习中的应用,包括在神经网络、循环神经网络和深度强化学习中的实践案例。进一步,文章探讨了张量分解的高级技术,如张量网络与量
【零基础到专家】:LS-DYNA材料模型定制化完全指南

# 摘要
本论文对LS-DYNA软件中的材料模型进行了全面的探讨,从基础理论到定制化方法,再到实践应用案例分析,以及最后的验证、校准和未来发展趋势。首先介绍了材料模型的理论基础和数学表述,然后阐述了如何根据应用场景选择合适的材料模型,并提供了定制化方法和实例。在实践应用章节中,分析了材料模型在车辆碰撞、高速冲击等工程问题中的应用,并探讨了如何利用材料模型进行材料选择和产品设计。最后,本论文强调了材料模型验证和校准的重要
IPMI标准V2.0实践攻略:如何快速搭建和优化个人IPMI环境
# 摘要
本文系统地介绍了IPMI标准V2.0的基础知识、个人环境搭建、功能实现、优化策略以及高级应用。首先概述了IPMI标准V2.0的核心组件及其理论基础,然后详细阐述了搭建个人IPMI环境的步骤,包括硬件要求、软件工具准备、网络配置与安全设置。在实践环节,本文通过详尽的步骤指导如何进行环境搭建,并对硬件监控、远程控制等关键功能进行了验证和测试,同时提供了解决常见问题的方案。此外,本文
SV630P伺服系统在自动化应用中的秘密武器:一步精通调试、故障排除与集成优化

# 摘要
本文全面介绍了SV630P伺服系统的工作原理、调试技巧、故障排除以及集成优化策略。首先概述了伺服系统的组成和基本原理,接着详细探讨了调试前的准备、调试过程和故障诊断方法,强调了参数设置、实时监控和故障分析的重要性。文中还提供了针对常见故障的识别、分析和排除步骤,并分享了真实案例的分析。此外,文章重点讨论了在工业自动化和高精度定位应用中
从二进制到汇编语言:指令集架构的魅力
# 摘要
本文全面探讨了计算机体系结构中的二进制基础、指令集架构、汇编语言基础以及高级编程技巧。首先,介绍了指令集架构的重要性、类型和组成部分,并且对RISC和CISC架
深入解读HOLLiAS MACS-K硬件手册:专家指南解锁系统性能优化

# 摘要
本文首先对HOLLiAS MACS-K硬件系统进行了全面的概览,然后深入解析了其系统架构,重点关注了硬件设计、系统扩展性、安全性能考量。接下来,探讨了性能优化的理论基础,并详细介绍了实践中的性能调优技巧。通过案例分析,展示了系统性能优化的实际应用和效果,以及在优化过程中遇到的挑战和解决方案。最后,展望了HOLLiAS MACS-K未来的发展趋势
数字音频接口对决:I2S vs TDM技术分析与选型指南
# 摘要
数字音频接口作为连接音频设备的核心技术,对于确保音频数据高质量、高效率传输至关重要。本文从基础概念出发,对I2S和TDM这两种广泛应用于数字音频系统的技术进行了深入解析,并对其工作原理、数据格式、同步机制和应用场景进行了详细探讨。通过对I2S与TDM的对比分析,本文还评估了它们在信号质量、系统复杂度、成本和应用兼容性方面的表现。文章最后提出了数字音频接口的选型指南,并展望了未来技
资源上传下载、课程学习等过程中有任何疑问或建议,欢迎提出宝贵意见哦~我们会及时处理!
点击此处反馈


专栏目录
最低0.47元/天 解锁专栏
买1年送3月
百万级
高质量VIP文章无限畅学
千万级
优质资源任意下载
C知道
免费提问 ( 生成式Al产品 )