Python时间序列模拟:从随机过程到实际应用案例
发布时间: 2024-08-31 20:27:38 阅读量: 134 订阅数: 44 
# 1. Python时间序列模拟概述
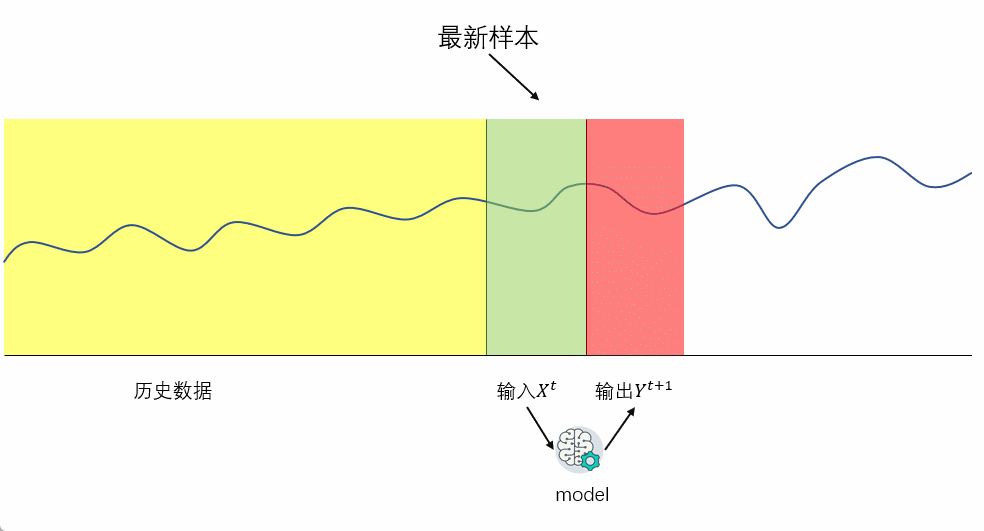
时间序列模拟是利用历史数据来预测未来的序列值,它广泛应用于金融分析、气象预测、供应链管理等领域。Python作为一种高效的编程语言,通过其强大的科学计算库,如NumPy、SciPy、Pandas和Statsmodels等,为时间序列分析和模拟提供了便捷的工具。
在本章中,我们将探讨如何使用Python进行时间序列数据的模拟,并建立初步的理解框架。这包括对时间序列数据的读取、处理和可视化等基础知识,为后续深入学习随机过程、统计特性分析和预测模型打下基础。通过实例,我们将展示如何利用Python进行时间序列的生成和初步分析。
以下是使用Python进行简单时间序列数据模拟的代码示例:
```python
import numpy as np
import pandas as pd
import matplotlib.pyplot as plt
# 创建时间序列数据
dates = pd.date_range('***', periods=100)
data = np.random.randn(100).cumsum() # 随机漫步生成数据
# 将数据转换为DataFrame对象
time_series = pd.Series(data, index=dates)
# 绘制时间序列图
plt.figure(figsize=(10,5))
plt.plot(time_series)
plt.title('Random Walk Time Series')
plt.xlabel('Date')
plt.ylabel('Value')
plt.show()
```
通过上述代码,我们可以快速生成并可视化一个随机时间序列,为进行时间序列模拟提供直观认识。在后续章节中,我们将逐步深入探索更为复杂的时间序列分析技术。
# 2. 理解时间序列中的随机过程
### 2.1 随机过程的基本概念
在开始深入研究时间序列分析之前,理解随机过程的基础概念是必要的。随机过程是时间序列分析的核心组成部分,它的每个实例都具有随机性,并且随时间变化。
#### 2.1.1 随机变量与随机过程的定义
首先,我们从随机变量开始谈起。随机变量是一个可以取不同值的变量,每个值都有一个概率。在时间序列分析中,我们关注的是随机变量如何随时间变化,因此引入随机过程的概念。
**随机过程**是一个随机变量的集合,这些随机变量是按照时间或其他顺序排列的。换句话说,随机过程描述了一个系统在一系列离散或连续时间点上的随机行为。
我们可以用一个数学表达式来表示随机过程:令\( \{X_t, t \in T\} \)为随机变量的集合,其中\( t \)代表时间点,\( T \)代表时间的范围,\( X_t \)是时间\( t \)上的随机变量,那么\( \{X_t, t \in T\} \)就构成了一个随机过程。
#### 2.1.2 常见的随机过程模型
在时间序列分析中,我们通常遇到几种标准的随机过程模型,其中包括:
- **白噪声(White Noise)**: 白噪声是统计学中的一个重要概念,它是一个时间序列的随机过程,序列中每个值都是独立同分布的,并且具有零均值和恒定的方差。
- **随机游走(Random Walk)**: 随机游走模型描述了一个没有趋势和季节性的序列。它的每一个值都是前一个值加上一个随机扰动项。
- **自回归模型(Autoregressive Model, AR)**: AR模型是一种可以用来表示数据时间序列的模型,它假设当前值是过去几个值的线性组合加上一个随机项。
- **移动平均模型(Moving Average Model, MA)**: MA模型认为序列的当前值是过去几个随机扰动项的线性组合。
- **自回归移动平均模型(Autoregressive Moving Average Model, ARMA)**: 结合了AR和MA模型的特点,同时考虑了序列的自身历史值和随机扰动项。
理解这些随机过程模型是分析和预测时间序列数据的重要基础。在接下来的章节中,我们将深入探讨如何模拟这些随机过程以及如何分析它们的统计特性。
### 2.2 随机过程的模拟技术
模拟是科学研究中的一个重要手段,尤其在随机过程中,模拟可以帮助我们深入理解其动态特性。这一节将讨论如何在计算机上生成随机数和随机向量,并探讨模拟随机过程的实现方法。
#### 2.2.1 生成随机数和随机向量
在编程中,生成随机数是通过调用特定的库函数来完成的。以Python为例,我们可以使用NumPy库中的`random`模块来生成随机数。
```python
import numpy as np
# 生成一个[0,1)区间内的均匀随机数
uniform_random = np.random.uniform()
# 生成一个随机整数
random_integer = np.random.randint(0, 10)
print(f"Uniform random number: {uniform_random}")
print(f"Random integer: {random_integer}")
```
对于随机向量的生成,可以使用如下方法:
```python
# 生成一个2x2的均匀随机数矩阵
uniform_matrix = np.random.uniform(size=(2, 2))
# 生成一个2x2的正态分布随机数矩阵
normal_matrix = np.random.normal(loc=0.0, scale=1.0, size=(2, 2))
print(f"Uniform matrix:\n{uniform_matrix}")
print(f"Normal matrix:\n{normal_matrix}")
```
生成随机数和随机向量是模拟随机过程的起点。从这里,我们可以构建更复杂的模拟环境。
#### 2.2.2 模拟随机过程的实现方法
模拟随机过程一般涉及到以下几个步骤:
1. **定义初始条件**:设置随机过程的初始参数,如初始值、随机变量的分布类型等。
2. **生成随机扰动项**:根据随机过程的性质,生成相应分布的随机扰动项。
3. **更新状态**:根据随机过程的规则更新序列的状态。例如,在随机游走模型中,下一个状态是当前状态加上随机扰动项。
4. **重复上述过程**:根据需要模拟的时间步长,重复步骤2和步骤3,从而生成足够长的序列。
下面是使用Python实现随机游走模型的一个例子:
```python
# 初始化参数
current_position = 0
steps = 100
positions = [current_position]
# 随机游走模拟
for _ in range(steps - 1):
# 生成一个随机扰动项
step = np.random.normal()
current_position += step
positions.append(current_position)
print(f"Random Walk positions: {positions}")
```
在这个模拟中,`positions`列表就是模拟得到的随机游走序列。
### 2.3 随机过程的统计特性分析
为了深入理解随机过程的行为,统计特性分析是一个不可忽略的步骤。本节将讨论如何计算随机过程的一些基本统计特性,包括均值、方差、协方差以及相关性和自相关性。
#### 2.3.1 均值、方差和协方差的计算
均值(Mean)、方差(Variance)和协方差(Covariance)是描述随机过程统计特性的基础量。
- **均值**描述了随机过程的中心位置,可以用所有观测值的平均值来表示。
- **方差**衡量了随机过程的离散程度,是各个观测值偏离均值的平方和的平均值。
- **协方差**衡量了两个随机过程间线性关系的强度和方向。
以下是计算这些统计特性的Python代码片段:
```python
import numpy as np
# 假设X是一个随机过程的观测值集合
X = np.array([1, 2, 3, 4, 5])
# 计算均值
mean_X = np.mean(X)
# 计算方差
var_X = np.var(X)
# 计算协方差,假设Y是另一个随机过程
Y = np.array([5, 4, 3, 2, 1])
cov_XY = np.cov(X, Y)[0, 1]
print(f"Mean of X: {mean_X}")
print(f"Variance of X: {var_X}")
print(f"Covariance of X and Y: {cov_XY}")
```
#### 2.3.2 相关性和自相关性分析
相关性描述了两个随机变量之间的线性关系程度,是协方差除以两个随机变量标准差的乘积。相关系数的取值范围在-1到1之间,1表示完全正相关,-1表示完全负相关,0表示无线性相关。
自相关性是指随机过程在不同时间点上的值之间的相关性。例如,在时间序列分析中,我们会使用自相关函数(Autocorrelation Function, ACF)来衡量时间序列与其自身在不同滞后下的相关性。
我们可以使用以下代码片段来计算一个时间序列的自相关系数:
```python
import numpy as np
import statsmodels.api as sm
# 假设time_series是一个时间序列数据集
time_series = np.array([1, 2, 3, 4, 5])
# 计算自相关系数
acf_result = sm.tsa.acf(time_series, nlags=4)
print(f"Autocorrelation coefficients: {acf_result}")
```
自相关系数揭示了时间序列中不同时间点之间的相关性模式,这对于识别数据中的周期性成分非常有用。
在这一章节中,我们从随机变量和随机过程的定义入手,逐步介绍了如何生成随机数和随机向量,随后探讨了模拟随机过程的实现方法,并最终深入到统计特性分析,包括均值、方差、协方差以及相关性和自相关性。通过这些基础知识,我们可以更好地理解和模拟时间序列数据,为后续的分析和预测打下坚实的基础。
# 3. 时间序列数据分析基础
在现代数据科学中,时间序列数据分析是一种核心技术,用于理解和预测未来的数据趋势。时间序列数据记录了在不同时间点上的观测值,这种数据类型在经济、金融、气象学、生物学等领域中普遍存在。本章节将深入探讨时间序列数据的类型、来源、分析方法以及如何处理季节性和非平稳性等问题。
## 3.1 时间序列数据的类型和来源
### 3.1.1 离散与连续时间序列
时间序列可以是连续的也可以是离散的。离散时间序列是按照固定的时间间隔进行采样的数据集合,例如,股票市场上
 最低0.47元/天 解锁专栏
 送3个月
 百万级
高质量VIP文章无限畅学
百万级
高质量VIP文章无限畅学
 千万级
优质资源任意下载
千万级
优质资源任意下载
 C知道
免费提问 ( 生成式Al产品 )
C知道
免费提问 ( 生成式Al产品 )
0
0
相关推荐

专栏简介
本专栏深入探讨了 Python 中时间序列分析的各个方面,从基础到高级应用。它涵盖了数据预处理、预测模型构建、准确性提升技巧以及在金融等领域的应用。专栏还比较了 Pandas、NumPy 和 SciPy 等时间序列工具箱,并提供了季节性分解、交叉验证、滑动窗口技术、时间频率转换、可视化、特征工程、时间对齐、聚类分析、模拟和因果关系检验等主题的详细指南。通过循序渐进的解释和实操案例,本专栏旨在帮助读者掌握时间序列分析的各个方面,并将其应用于实际问题中。
专栏目录
最低0.47元/天 解锁专栏
送3个月
百万级
高质量VIP文章无限畅学
千万级
优质资源任意下载
C知道
免费提问 ( 生成式Al产品 )
最新推荐
Technical Guide to Building Enterprise-level Document Management System using kkfileview
# 1.1 kkfileview Technical Overview
kkfileview is a technology designed for file previewing and management, offering rapid and convenient document browsing capabilities. Its standout feature is the support for online previews of various file formats, such as Word, Excel, PDF, and more—allowing user
Analyzing Trends in Date Data from Excel Using MATLAB
# Introduction
## 1.1 Foreword
In the current era of information explosion, vast amounts of data are continuously generated and recorded. Date data, as a significant part of this, captures the changes in temporal information. By analyzing date data and performing trend analysis, we can better under
Expert Tips and Secrets for Reading Excel Data in MATLAB: Boost Your Data Handling Skills
# MATLAB Reading Excel Data: Expert Tips and Tricks to Elevate Your Data Handling Skills
## 1. The Theoretical Foundations of MATLAB Reading Excel Data
MATLAB offers a variety of functions and methods to read Excel data, including readtable, importdata, and xlsread. These functions allow users to
Image Processing and Computer Vision Techniques in Jupyter Notebook
# Image Processing and Computer Vision Techniques in Jupyter Notebook
## Chapter 1: Introduction to Jupyter Notebook
### 2.1 What is Jupyter Notebook
Jupyter Notebook is an interactive computing environment that supports code execution, text writing, and image display. Its main features include:
-
Parallelization Techniques for Matlab Autocorrelation Function: Enhancing Efficiency in Big Data Analysis
# 1. Introduction to Matlab Autocorrelation Function
The autocorrelation function is a vital analytical tool in time-domain signal processing, capable of measuring the similarity of a signal with itself at varying time lags. In Matlab, the autocorrelation function can be calculated using the `xcorr
PyCharm Python Version Management and Version Control: Integrated Strategies for Version Management and Control
# Overview of Version Management and Version Control
Version management and version control are crucial practices in software development, allowing developers to track code changes, collaborate, and maintain the integrity of the codebase. Version management systems (like Git and Mercurial) provide
Styling Scrollbars in Qt Style Sheets: Detailed Examples on Beautifying Scrollbar Appearance with QSS
# Chapter 1: Fundamentals of Scrollbar Beautification with Qt Style Sheets
## 1.1 The Importance of Scrollbars in Qt Interface Design
As a frequently used interactive element in Qt interface design, scrollbars play a crucial role in displaying a vast amount of information within limited space. In
Statistical Tests for Model Evaluation: Using Hypothesis Testing to Compare Models
# Basic Concepts of Model Evaluation and Hypothesis Testing
## 1.1 The Importance of Model Evaluation
In the fields of data science and machine learning, model evaluation is a critical step to ensure the predictive performance of a model. Model evaluation involves not only the production of accura
Installing and Optimizing Performance of NumPy: Optimizing Post-installation Performance of NumPy
# 1. Introduction to NumPy
NumPy, short for Numerical Python, is a Python library used for scientific computing. It offers a powerful N-dimensional array object, along with efficient functions for array operations. NumPy is widely used in data science, machine learning, image processing, and scient
[Frontier Developments]: GAN's Latest Breakthroughs in Deepfake Domain: Understanding Future AI Trends
# 1. Introduction to Deepfakes and GANs
## 1.1 Definition and History of Deepfakes
Deepfakes, a portmanteau of "deep learning" and "fake", are technologically-altered images, audio, and videos that are lifelike thanks to the power of deep learning, particularly Generative Adversarial Networks (GANs
资源上传下载、课程学习等过程中有任何疑问或建议,欢迎提出宝贵意见哦~我们会及时处理!
点击此处反馈


专栏目录
最低0.47元/天 解锁专栏
送3个月
百万级
高质量VIP文章无限畅学
千万级
优质资源任意下载
C知道
免费提问 ( 生成式Al产品 )