数据挖掘中的聚类分析:算法详解与商业应用,让你快速上手!
发布时间: 2024-09-01 17:45:44 阅读量: 102 订阅数: 77 
# 1. 聚类分析概述
聚类分析是数据挖掘中的一种无监督学习技术,它将大量数据根据某种相似性度量分成多个类别或“簇”,使得同一簇内的数据点比不同簇的数据点更为相似。它是数据科学、机器学习、模式识别等领域的基础工具,广泛应用于生物学、市场研究、图像分析等多个领域。
聚类可以帮助我们理解数据的内在结构和分布,揭示样本间的关联性,为后续的数据分析工作奠定基础。聚类技术的种类繁多,包括基于距离的聚类、基于密度的聚类、基于模型的聚类等。接下来的章节,我们将深入了解这些聚类算法,并探讨它们在不同行业中的实际应用。
# 2. 聚类算法详解
## 2.1 基于距离的聚类算法
距离是聚类算法中非常核心的概念,它用于衡量不同数据点之间的相似度或相异度。在基于距离的聚类算法中,将距离相近的数据点划分为同一类,是数据聚类的基础。
### 2.1.1 K-Means算法原理及实现
K-Means算法是一种广泛使用的基于距离的聚类方法,它通过迭代寻找数据的最优聚类中心,以此将数据集分为K个簇。K-Means算法的基本步骤如下:
1. 随机选择K个数据点作为初始的聚类中心。
2. 将每个数据点分配给最近的聚类中心,形成K个簇。
3. 重新计算每个簇的中心点,即簇内所有点的均值。
4. 重复步骤2和步骤3,直到聚类中心不再发生变化或达到预设的迭代次数。
以下是K-Means算法的Python实现示例:
```python
import numpy as np
from sklearn.cluster import KMeans
# 示例数据集
X = np.array([[1, 2], [1, 4], [1, 0],
[10, 2], [10, 4], [10, 0]])
# 设置簇的数量
kmeans = KMeans(n_clusters=2, random_state=0).fit(X)
# 输出聚类中心
print("Cluster centers:")
print(kmeans.cluster_centers_)
# 输出每个点的簇标签
print("Labels for each point:")
print(kmeans.labels_)
```
在上述代码中,我们首先导入了必要的库,然后定义了一个简单的二维数据集`X`。接下来,我们使用`sklearn.cluster.KMeans`类创建了K-Means对象,并设置`n_clusters=2`来指定要划分的簇的数量。通过调用`fit`方法对数据进行聚类,并通过`cluster_centers_`属性获取了聚类中心,`labels_`属性获得了每个数据点的簇标签。
### 2.1.2 层次聚类分析过程和应用
层次聚类算法是另一种基于距离的聚类方法,它通过构建一个聚类的层次结构来对数据进行聚类。这种算法可以进一步分为自下而上(凝聚)和自上而下(分裂)的两种方法。
层次聚类的基本步骤如下:
1. 将每个数据点视为一个独立的簇。
2. 按照某种准则(如距离最小)合并最近的两个簇。
3. 重复步骤2,直到达到预设的簇数量或满足其他停止条件。
层次聚类算法的Python实现可以使用`sklearn.cluster.AgglomerativeClustering`类,下面是一个简单的示例:
```python
from sklearn.cluster import AgglomerativeClustering
from sklearn.datasets import make_blobs
# 创建合成数据集
X, _ = make_blobs(n_samples=300, centers=4, cluster_std=0.60, random_state=0)
# 应用凝聚层次聚类
cluster = AgglomerativeClustering(n_clusters=4)
labels = cluster.fit_predict(X)
print("Labels for each point:")
print(labels)
```
在这个示例中,我们首先使用`make_blobs`函数生成了一个含有4个簇的数据集`X`,然后通过`AgglomerativeClustering`类创建了层次聚类模型,并通过`fit_predict`方法同时拟合并预测每个数据点的簇标签。最终,`labels`数组中的每个元素代表对应数据点的簇标签。
通过层次聚类,我们可以直观地通过一个树状结构(也称为Dendrogram)来分析数据的层次结构关系,这对于一些应用场合尤其有用,如生物信息学中的物种分类,或者市场研究中的顾客细分。
# 3. 聚类算法的商业应用案例分析
聚类算法在商业领域中有着广泛的应用,从客户细分、市场分析到社交媒体数据挖掘,聚类技术帮助企业和组织从海量数据中挖掘出潜在的价值。本章节将深入探讨聚类算法在不同商业场景中的具体应用案例。
## 3.1 客户细分与市场分析
### 3.1.1 应用K-Means进行客户细分
在市场分析中,K-Means是一种常见的聚类方法,它将具有相似特征的客户归为一类,帮助营销人员更有效地制定针对性的市场策略。利用K-Means算法,企业可以根据客户的购买行为、人口统计数据等信息将客户分为不同的群体。
一个典型的客户细分流程包括以下步骤:
1. **数据准备**:收集客户的交易数据和相关属性,如年龄、性别、购买频次、购买金额等。
2. **数据预处理**:进行数据清洗和标准化,以减少数据噪声和特征间的尺度差异。
3. **确定簇数**:选择合适的K值(簇的数量),通常使用轮廓系数、肘部法则等方法确定。
4. **执行K-Means算法**:利用K-Means算法对数据集进行聚类,并迭代更新簇的中心点直至收敛。
5. **结果分析**:根据聚类结果,对每个簇内的客户特征进行分析,识别出不同细分市场的特征。
下面是一个简化版的K-Means算法的Python代码示例:
```python
from sklearn.cluster import KMeans
import numpy as np
# 假设X是包含客户特征的二维数据集
X = np.array([[1, 2], [1, 4], [1, 0],
[10, 2], [10, 4], [10, 0]])
# 设置簇数K为2
kmeans = KMeans(n_clusters=2, random_state=0).fit(X)
# 获取簇中心点和每个点所属的簇标签
centers = kmeans.cluster_centers_
labels = kmeans.labels_
print("Cluster centers:\n", centers)
print("Labels:", labels)
```
在这个例子中,`KMeans`类来自`sklearn.cluster`模块,`fit`方法用于计算簇中心点,并对数据集`X`进行聚类。输出结果会展示每个簇的中心点坐标和数据点所属的簇标签。
### 3.1.2 基于聚类的市场细分策略
市场细分策略是企业战略

 百万级
高质量VIP文章无限畅学
百万级
高质量VIP文章无限畅学
 千万级
优质资源任意下载
千万级
优质资源任意下载
 C知道
免费提问 ( 生成式Al产品 )
C知道
免费提问 ( 生成式Al产品 )
0
0
相关推荐

专栏简介
本专栏聚焦数据挖掘算法的应用案例,深入探讨理论与实践的完美结合。从入门到进阶,专栏涵盖了数据挖掘的基本概念、算法、大型数据集处理技术、算法选择指南和特征工程的关键步骤。此外,专栏还提供了数据预处理技巧、推荐系统构建指南、深度学习在数据挖掘中的应用、文本挖掘技巧、分类技术在营销中的应用、社交媒体分析和回归分析等高级技术。通过这些案例分析和实用指南,专栏旨在帮助读者掌握数据挖掘算法,并将其应用于各种实际场景中,从数据分析到推荐系统构建,再到社交媒体分析。
专栏目录
最低0.47元/天 解锁专栏
买1年送1年
百万级
高质量VIP文章无限畅学
千万级
优质资源任意下载
C知道
免费提问 ( 生成式Al产品 )
最新推荐
Android二维码框架选择:如何集成与优化用户界面与交互

# 1. Android二维码框架概述
在移动应用开发领域,二维码技术已经成为不可或缺的一部分。Android作为应用广泛的移动操作系统,其平台上的二维码框架种类繁多,开发者在选择适合的框架时需要综合考虑多种因素。本章将为读者概述二维码框架的基本知识、功
全球高可用部署:MySQL PXC集群的多数据中心策略

# 1. 高可用部署与MySQL PXC集群基础
在IT行业,特别是在数据库管理系统领域,高可用部署是确保业务连续性和数据一致性的关键。通过本章,我们将了解高可用部署的基础以及如何利用MySQL Percona XtraDB Cluster (PXC) 集群来实现这一目标。
## MySQL PXC集群的简介
MySQL PXC集群是一个可扩展的同步多主节点集群解决方案,它能够提供连续可用性和数据一致
Python算法实现捷径:源代码中的经典算法实践

# 1. Python算法实现捷径概述
在信息技术飞速发展的今天,算法作为编程的核心之一,成为每一位软件开发者的必修课。Python以其简洁明了、可读性强的特点,被广泛应用于算法实现和教学中。本章将介绍如何利用Python的特性和丰富的库,为算法实现铺平道路,提供快速入门的捷径
【MATLAB控制系统设计】:仿真到实现的全步骤教程
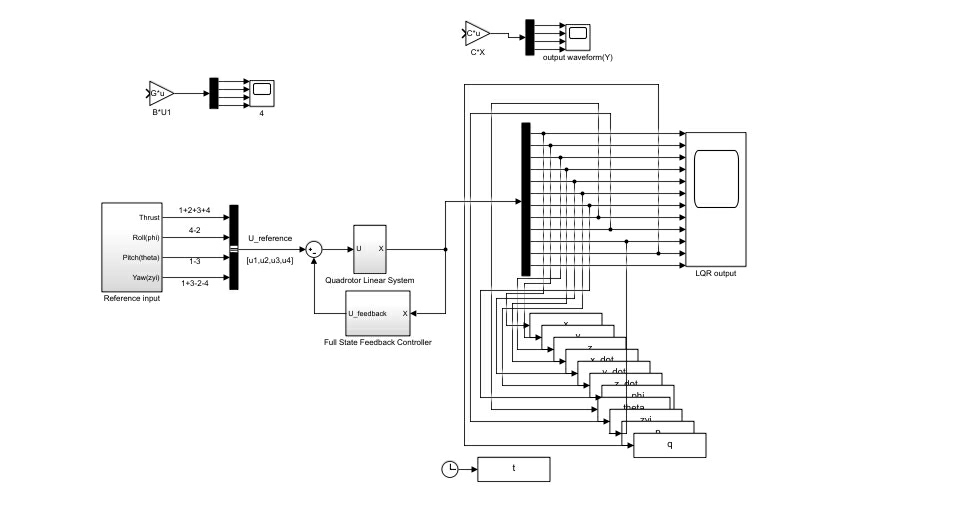
# 1. MATLAB控制系统设计概述
在现代控制系统设计中,MATLAB已经成为了工程师不可或缺的工具。它提供了一个综合性的计算环境,让工程师能够进行算法开发、数据可视化、数据分析以及仿真等多种操作。MATLAB的控制系统工具箱(Control System Toolbox)为控制系统的设计和分析提供了全面的支持。借助这些工具,我们可以轻松地对系统进行建模、分析和调整,以实现
【JavaScript人脸识别的用户体验设计】:界面与交互的优化
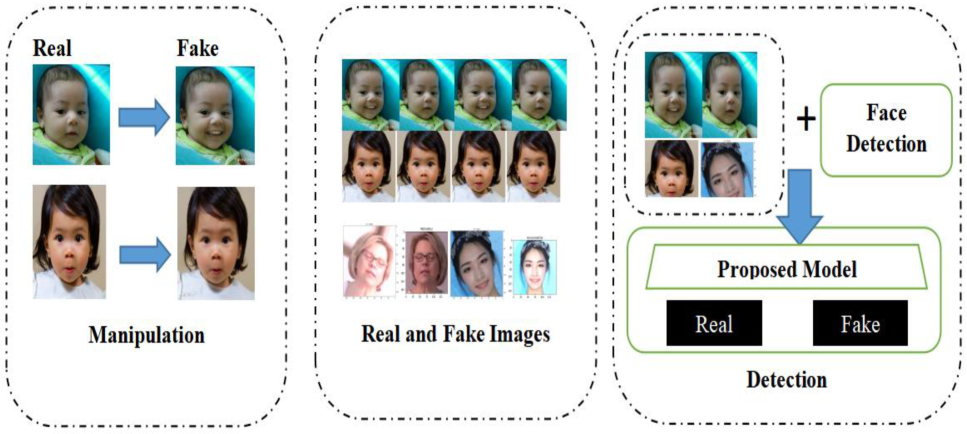
# 1. JavaScript人脸识别技术概述
## 1.1 人脸识别技术简介
人脸识别技术是一种通过计算机图像处理和识别技术,让机器能够识别人类面部特征的技术。近年来,随着人工智能技术的发展和硬件计算能力的提升,JavaScript人脸识别技术得到了迅速的发展和应用。
## 1.2 JavaScript在人脸识别中的应用
JavaScript作为一种强
【NLP新范式】:CBAM在自然语言处理中的应用实例与前景展望

# 1. NLP与深度学习的融合
在当今的IT行业,自然语言处理(NLP)和深度学习技术的融合已经产生了巨大影响,它们共同推动了智能语音助手、自动翻译、情感分析等应用的发展。NLP指的是利用计算机技术理解和处理人类语言的方式,而深度学习作为机器学习的一个子集,通过多层神经网络模型来模拟人脑处理数据和创建模式
MATLAB遗传算法与模拟退火策略:如何互补寻找全局最优解

# 1. 遗传算法与模拟退火策略的理论基础
遗传算法(Genetic Algorithms, GA)和模拟退火(Simulated Annealing, SA)是两种启发式搜索算法,它们在解决优化问题上具有强大的能力和独特的适用性。遗传算法通过模拟生物
故障恢复计划:机械运动的最佳实践制定与执行

# 1. 故障恢复计划概述
故障恢复计划是确保企业或组织在面临系统故障、灾难或其他意外事件时能够迅速恢复业务运作的重要组成部分。本章将介绍故障恢复计划的基本概念、目标以及其在现代IT管理中的重要性。我们将讨论如何通过合理的风险评估与管理,选择合适的恢复策略,并形成文档化的流程以达到标准化。
## 1.1 故障恢复计划的目的
故障恢复计划的主要目的是最小化突发事件对业务的
拷贝构造函数的陷阱:防止错误的浅拷贝
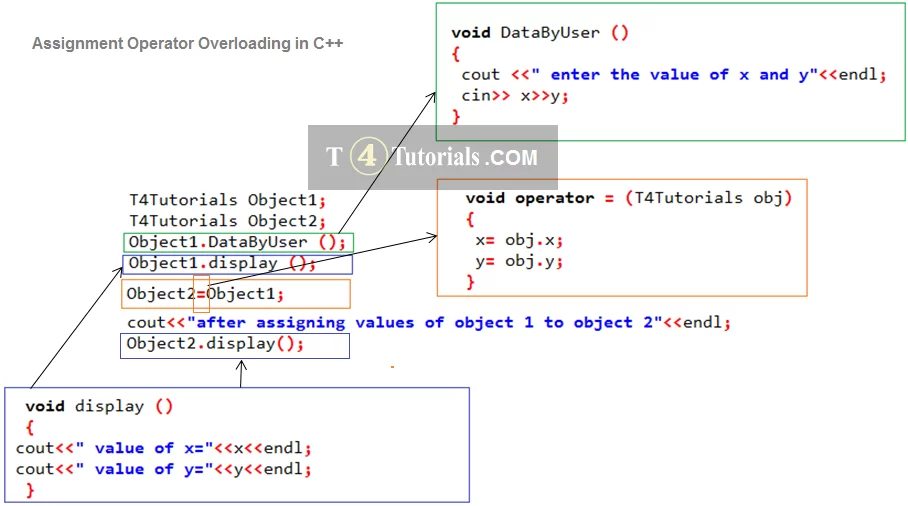
# 1. 拷贝构造函数概念解析
在C++编程中,拷贝构造函数是一种特殊的构造函数,用于创建一个新对象作为现有对象的副本。它以相同类类型的单一引用参数为参数,通常用于函数参数传递和返回值场景。拷贝构造函数的基本定义形式如下:
```cpp
class ClassName {
public:
ClassName(const ClassName& other); // 拷贝构造函数
MATLAB时域分析:动态系统建模与分析,从基础到高级的完全指南
# 1. MATLAB时域分析概述
MATLAB作为一种强大的数值计算与仿真软件,在工程和科学领域得到了广泛的应用。特别是对于时域分析,MATLAB提供的丰富工具和函数库极大地简化了动态系统的建模、分析和优化过程。在开始深入探索MATLAB在时域分析中的应用之前,本章将为读者提供一个基础概述,包括时域分析的定义、重要性以及MATLAB在其中扮演的角色。
时域
资源上传下载、课程学习等过程中有任何疑问或建议,欢迎提出宝贵意见哦~我们会及时处理!
点击此处反馈


专栏目录
最低0.47元/天 解锁专栏
买1年送1年
百万级
高质量VIP文章无限畅学
千万级
优质资源任意下载
C知道
免费提问 ( 生成式Al产品 )