Pandas数据可视化进阶指南:探索高级图表类型,提升数据呈现效果
发布时间: 2024-07-20 22:22:27 阅读量: 63 订阅数: 26 
# 1. Pandas数据可视化的基础
Pandas是一个强大的Python库,它提供了广泛的数据处理和分析功能,包括数据可视化。Pandas的数据可视化功能基于Matplotlib和Seaborn等底层库,允许用户创建各种图表类型,以探索和展示数据。
### 1.1 数据准备
在进行数据可视化之前,至关重要的是准备数据以确保其适合可视化。这包括处理缺失值、转换数据类型和标准化数据。Pandas提供了各种函数来简化这些任务,例如`dropna()`、`astype()`和`scale()`。
# 2. 高级图表类型探索
### 2.1 散点图和气泡图
#### 2.1.1 散点图的绘制和自定义
散点图用于展示两个变量之间的关系,每个数据点表示一个数据对。Pandas 提供了 `scatter()` 函数来绘制散点图:
```python
import pandas as pd
import matplotlib.pyplot as plt
# 创建数据框
df = pd.DataFrame({'x': [1, 2, 3, 4, 5], 'y': [2, 4, 6, 8, 10]})
# 绘制散点图
plt.scatter(df['x'], df['y'])
plt.xlabel('x')
plt.ylabel('y')
plt.title('散点图')
plt.show()
```
**参数说明:**
* `x`: x 轴数据
* `y`: y 轴数据
* `xlabel`: x 轴标签
* `ylabel`: y 轴标签
* `title`: 图表标题
**逻辑分析:**
1. `scatter()` 函数接收 x 轴和 y 轴数据,并绘制散点。
2. `xlabel()`、`ylabel()` 和 `title()` 函数用于设置轴标签和图表标题。
3. `show()` 函数显示图表。
#### 2.1.2 气泡图的绘制和大小映射
气泡图是一种散点图的变体,其中数据点的面积或颜色表示第三个变量。Pandas 提供了 `scatter()` 函数的 `s` 参数来绘制气泡图:
```python
# 创建数据框
df = pd.DataFrame({'x': [1, 2, 3, 4, 5], 'y': [2, 4, 6, 8, 10], 'size': [10, 20, 30, 40, 50]})
# 绘制气泡图
plt.scatter(df['x'], df['y'], s=df['size'])
plt.xlabel('x')
plt.ylabel('y')
plt.title('气泡图')
plt.show()
```
**参数说明:**
* `s`: 气泡大小
* 其他参数与散点图相同
**逻辑分析:**
1. `s` 参数指定气泡的大小,可以是单个值或一个列表。
2. 气泡的大小与第三个变量(`size`)成正比。
3. 其他参数与散点图相同。
### 2.2 直方图和密度图
#### 2.2.1 直方图的绘制和参数设置
直方图用于展示数据的分布,将数据划分为多个区间,并计算每个区间内的数据个数。Pandas 提供了 `hist()` 函数来绘制直方图:
```python
# 创建数据框
df = pd.DataFrame({'data': [1, 2, 3, 4, 5, 6, 7, 8, 9, 10]})
# 绘制直方图
df['data'].hist(bins=5)
plt.xlabel('数据')
plt.ylabel('频率')
plt.title('直方图')
plt.show()
```
**参数说明:**
* `bins`: 直方图的区间数量
* 其他参数与散点图相同
**逻辑分析:**
1. `hist()` 函数接收一个数据序列,并将其划分为指定数量的区间。
2. 函数计算每个区间内的数据个数,并绘制直方图。
3. `bins` 参数指定区间数量,默认为 10。
4. 其他参数与散点图相同。
#### 2.2.2 密度图的绘制和核密度估计
密度图是一种平滑的直方图,它使用核密度估计来估计数据的分布。Pandas 提供了 `kde()` 函数来绘制密度图:
```python
# 创建数据框
df = pd.DataFrame({'data': [1, 2, 3, 4, 5, 6, 7, 8, 9, 10]})
# 绘制密度图
df['data'].plot.kde()
plt.xlabel('数据')
plt.ylabel('密度')
plt.title('密度图')
plt.show()
```
**参数说明:**
* `kde`: 绘制密度图
* 其他参数与散点图相同
**逻辑分析:**
1. `kde()` 函数使用核密度估计来估计数据的分布。
2. 函数生成一条平滑的曲线,表示数据的概率密度函数。
3. 其他参数与散点图相同。
### 2.3 箱线图和提琴图
#### 2.3.1 箱线图的绘制和数据分布分析
箱线图用于展示数据的分布和离散程度,它显示了数据的最小值、第一四分位数、中位数、第三四分位数和最大值。Pandas 提供了 `boxplot()` 函数来绘制箱线图:
```python
# 创建数据框
df = pd.DataFrame({'data': [1, 2, 3, 4, 5, 6, 7, 8, 9, 10, 11, 12, 13, 14, 15]})
# 绘制箱线图
df['data'].plot.box()
plt.xlabel('数据')
plt.ylabel('值')
plt.title('箱线图')
plt.show()
```
**参数说明:

 百万级
高质量VIP文章无限畅学
百万级
高质量VIP文章无限畅学
 千万级
优质资源任意下载
千万级
优质资源任意下载
 C知道
免费提问 ( 生成式Al产品 )
C知道
免费提问 ( 生成式Al产品 )
0
0
相关推荐

专栏简介
《Pandas库入门宝典》专栏是数据处理领域的权威指南,涵盖了从基础知识到高级技巧的全面内容。专栏以循序渐进的方式介绍了Pandas库,从数据合并、分组分析、可视化到数据类型转换、内存管理和性能优化。通过深入浅出的讲解和丰富的实战案例,专栏帮助读者掌握Pandas库的精髓,提升数据处理能力。无论是数据分析新手还是经验丰富的从业者,本专栏都提供了宝贵的知识和实践指导,助力读者在数据处理领域取得成功。
专栏目录
最低0.47元/天 解锁专栏
买1年送3月
百万级
高质量VIP文章无限畅学
千万级
优质资源任意下载
C知道
免费提问 ( 生成式Al产品 )
最新推荐
JY01A直流无刷IC全攻略:深入理解与高效应用
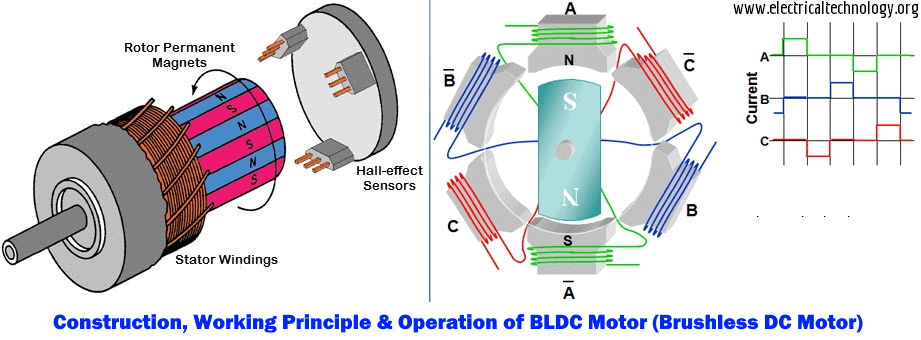
# 摘要
本文详细介绍了JY01A直流无刷IC的设计、功能和应用。文章首先概述了直流无刷电机的工作原理及其关键参数,随后探讨了JY01A IC的功能特点以及与电机集成的应用。在实践操作方面,本文讲解了JY01A IC的硬件连接、编程控制,并通过具体
【S参数转换表准确性】:实验验证与误差分析深度揭秘
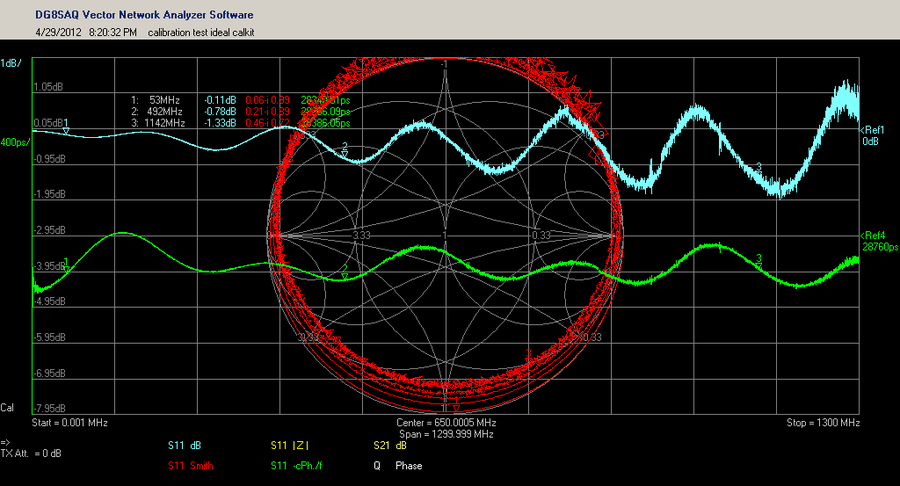
# 摘要
本文详细探讨了S参数转换表的准确性问题,首先介绍了S参数的基本概念及其在射频领域的应用,然后通过实验验证了S参数转换表的准确性,并分析了可能的误差来源,包括系统误差和随机误差。为了减小误差,本文提出了一系列的硬件优化措施和软件算法改进策略。最后,本文展望了S参数测量技术的新进展和未来的研究方向,指出了理论研究和实际应用创新的重要性。
# 关键字
S参
【TongWeb7内存管理教程】:避免内存泄漏与优化技巧
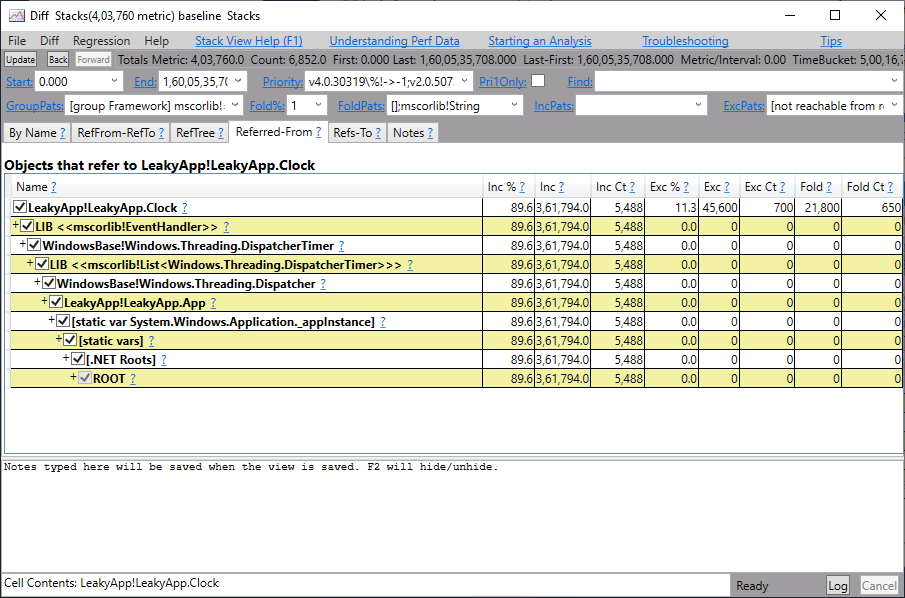
# 摘要
本文旨在深入探讨TongWeb7的内存管理机制,重点关注内存泄漏的理论基础、识别、诊断以及预防措施。通过详细阐述内存池管理、对象生命周期、分配释放策略和内存压缩回收技术,文章为提升内存使用效率和性能优化提供了实用的技术细节。此外,本文还介绍了一些性能优化的基本原则和监控分析工具的应用,以及探讨了企业级内存管理策略、自动内存管理工具和未来内存管理技术的发展趋
无线定位算法优化实战:提升速度与准确率的5大策略
# 摘要
本文综述了无线定位技术的原理、常用算法及其优化策略,并通过实际案例分析展示了定位系统的实施与优化。第一章为无线定位技术概述,介绍了无线定位技术的基础知识。第二章详细探讨了无线定位算法的分类、原理和常用算法,包括距离测量技术和具体定位算法如三角测量法、指纹定位法和卫星定位技术。第三章着重于提升定位准确率、加速定位速度和节省资源消耗的优化策略。第四章通过分析室内导航系统和物联网设备跟踪的实际应用场景,说明了定位系统优化实施
成本效益深度分析:ODU flex-G.7044网络投资回报率优化
# 摘要
本文旨在介绍ODU flex-G.7044网络技术及其成本效益分析。首先,概述了ODU flex-G.7044网络的基础架构和技术特点。随后,深入探讨成本效益理论,包括成本效益分析的基本概念、应用场景和局限性,以及投资回报率的计算与评估。在此基础上,对ODU flex-G.7044网络的成本效益进行了具体分析,考虑了直接成本、间接成本、潜在效益以及长期影响。接着,提出优化投资回报
【Delphi编程智慧】:进度条与异步操作的完美协调之道

# 摘要
本文旨在深入探讨Delphi编程环境中进度条的使用及其与异步操作的结合。首先,基础章节解释了进度条的工作原理和基础应用。随后,深入研究了Delphi中的异步编程机制,包括线程和任务管理、同步与异步操作的原理及异常处理。第三章结合实
C语言编程:构建高效的字符串处理函数
# 摘要
字符串处理是编程中不可或缺的基础技能,尤其在C语言中,正确的字符串管理对程序的稳定性和效率至关重要。本文从基础概念出发,详细介绍了C语言中字符串的定义、存储、常用操作函数以及内存管理的基本知识。在此基础上,进一步探讨了高级字符串处理技术,包括格式化字符串、算法优化和正则表达式的应用。
【抗干扰策略】:这些方法能极大提高PID控制系统的鲁棒性
# 摘要
PID控制系统作为一种广泛应用于工业过程控制的经典反馈控制策略,其理论基础、设计步骤、抗干扰技术和实践应用一直是控制工程领域的研究热点。本文从PID控制器的工作原理出发,系统介绍了比例(P)、积分(I)、微分(D)控制的作用,并探讨了系统建模、控制器参数整定及系统稳定性的分析方法。文章进一步分析了抗干扰技术,并通过案例分析展示了PID控制在工业温度和流量控制系统中的优化与仿真。最后,文章展望了PID控制系统的高级扩展,如
业务连续性的守护者:中控BS架构考勤系统的灾难恢复计划

# 摘要
本文旨在探讨中控BS架构考勤系统的业务连续性管理,概述了业务连续性的重要性及其灾难恢复策略的制定。首先介绍了业务连续性的基础概念,并对其在企业中的重要性进行了详细解析。随后,文章深入分析了灾难恢复计划的组成要素、风险评估与影响分析方法。重点阐述了中控BS架构在硬件冗余设计、数据备份与恢复机制以及应急响应等方面的策略。
自定义环形菜单
# 摘要
本文探讨了环形菜单的设计理念、理论基础、开发实践、测试优化以及创新应用。首先介绍了环形菜单的设计价值及其在用户交互中的应用。接着,阐述了环形菜单的数学基础、用户交互理论和设计原则,为深入理解环形菜单提供了坚实的理论支持。随后,文章详细描述了环形菜单的软件实现框架、核心功能编码以及界面与视觉设计的开发实践。针对功能测试和性能优化,本文讨论了测试方法和优化策略,确保环形菜单的可用性和高效性。最后,展望了环形菜单在新兴领域的
资源上传下载、课程学习等过程中有任何疑问或建议,欢迎提出宝贵意见哦~我们会及时处理!
点击此处反馈


专栏目录
最低0.47元/天 解锁专栏
买1年送3月
百万级
高质量VIP文章无限畅学
千万级
优质资源任意下载
C知道
免费提问 ( 生成式Al产品 )