图连通性探秘:无向与有向图连通组件解决方案
发布时间: 2024-09-11 03:32:44 阅读量: 54 订阅数: 42 

用 Python 代码判断有向图和无向图的连通性
# 1. 图连通性的基础概念
在本章中,我们将探索图论中的基础概念,特别是与图连通性相关的术语和原理。首先,图是由顶点(节点)和边组成的数学结构,它能够模拟各种对象之间的复杂关系。连通性是指在一个图中,能否从一个顶点到达另一个顶点的属性。理解图连通性的基础对于后续章节中对算法的研究至关重要。
## 1.1 图的定义和性质
图G由顶点集V和边集E组成,可表示为G=(V,E)。一个顶点称为孤立的如果它没有任何边与其相连。无向图的边不区分方向,而有向图的边则是有方向的。
## 1.2 连通和非连通图的区别
在无向图中,如果任意两个顶点之间至少存在一条路径相连,则称该图是连通的。反之,如果存在至少一个顶点无法到达其他所有顶点,则该图是非连通的。连通性是图论研究中的核心概念之一,它直接关系到图的结构完整性和信息流动的能力。
通过掌握这些基础概念,读者将为深入学习图连通组件理论和算法打下坚实的基础。接下来的章节中,我们将详细探讨无向图和有向图的连通组件及其相应的算法。
# 2. 无向图的连通组件理论与算法
无向图是图论中一个重要的概念,它由顶点集合和连接顶点的边集合组成,是构建复杂网络结构的基础。在无向图中,边是没有方向的,即如果顶点A和顶点B之间存在一条边,那么顶点B和顶点A之间也存在一条边。理解无向图的连通性是分析图的基本性质和设计图算法的前提。
## 2.1 无向图连通性基础
### 2.1.1 无向图的定义和性质
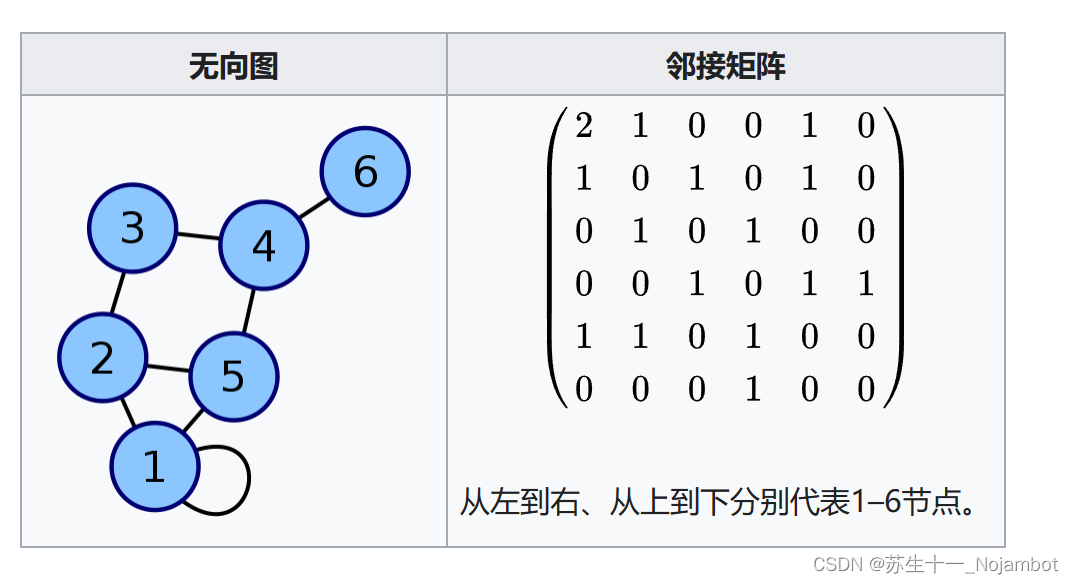
无向图G可以表示为G=(V, E),其中V代表顶点集合,E代表边集合。边e属于E,可以是(V[i], V[j])的形式,表示顶点i和顶点j之间有一条无向边。如果任意两个顶点之间都可以通过边到达,那么这个无向图就是连通的。反之,如果存在至少一对顶点不能通过边互相到达,该无向图就是非连通的。
在连通的无向图中,任意两个顶点都存在路径连接,这意味着无向图的顶点可以被划分为一组连通子图,每个子图内部是连通的,而子图之间是不连通的。这些连通子图被称为无向图的连通分量。
### 2.1.2 连通和非连通无向图的区别
连通无向图的性质和非连通图有很大差别。在连通图中,最少边的数量等于顶点数减一(即n-1条边,对于n个顶点)。这是因为一个连通图可以被看作是一棵树,而任何一棵树至少有n-1条边。
而在非连通图中,顶点之间不能相互到达,存在至少一对顶点没有边相连。非连通图至少包含两个连通分量,它们之间没有边相连。
## 2.2 无向图连通组件的算法分析
### 2.2.1 深度优先搜索(DFS)算法解析
深度优先搜索(DFS)是一种用于遍历或搜索树或图的算法。在图的上下文中,算法从某个顶点开始,沿着一条边尽可能深地搜索新的顶点,直到达到一个没有未探索的邻居的顶点为止,然后回溯。
为了寻找无向图的所有连通分量,可以从任何一个顶点开始执行DFS。以下是使用DFS寻找无向图连通分量的基本步骤:
1. 从图中的一个顶点v开始。
2. 将v标记为已访问,并将它加入当前连通分量。
3. 对每一个与v相连的顶点u执行以下步骤:
- 如果u未被访问过,则从u开始递归执行DFS。
4. 当前顶点v的所有邻居都被访问过之后,当前连通分量的搜索完成。
5. 重复步骤1-4,直到所有的顶点都被访问过。
下面是一个简单的DFS算法实现:
```python
def dfs(graph, v, visited):
visited[v] = True
print(v, end=' ')
for i in graph[v]:
if not visited[i]:
dfs(graph, i, visited)
# 示例图的邻接表表示
graph = {0: [1, 2], 1: [0, 3], 2: [0], 3: [1]}
visited = [False] * len(graph)
# 对每个未访问的顶点执行DFS
for i in range(len(graph)):
if not visited[i]:
dfs(graph, i, visited)
```
在这段代码中,我们用`visited`数组来跟踪每个顶点是否被访问过,以避免重复访问同一个顶点。`graph`是一个字典,键是顶点,值是一个列表,包含了与该顶点相邻的顶点。我们从顶点0开始执行DFS,并递归地访问所有未访问的相邻顶点。
### 2.2.2 广度优先搜索(BFS)算法解析
广度优先搜索(BFS)是一种遍历或搜索树或图的算法。在图的上下文中,算法从某个顶点开始,先访问所有邻接的顶点,然后对每一个邻接顶点,再访问其邻接顶点,如此迭代进行。
BFS同样适用于寻找无向图中的所有连通分量。其基本步骤如下:
1. 创建一个队列。
2. 将起始顶点v加入队列,并将其标记为已访问。
3. 当队列非空时执行以下步骤:
- 从队列中取出一个顶点u。
- 对每一个与u相邻的顶点w,如果w未被访问过,则将w加入队列,并标记为已访问。
4. 重复步骤3,直到队列为空。
BFS算法的Python实现代码如下:
```python
from collections import deque
def bfs(graph, v):
visited = set()
queue = deque([v])
visited.add(v)
while queue:
s = queue.popleft()
print(s, end=' ')
for i in graph[s]:
if i not in visited:
visited.add(i)
queue.append(i)
graph = {0: [1, 2], 1: [0, 3], 2: [0], 3: [1]}
for i in graph:
if i not in visited:
bfs(graph, i)
```
在这段代码中,我们用`visited`集合来记录已经访问过的顶点,用队列`queue`来存储即将访问的顶点。我们从顶点0开始,逐个访问其邻接顶点,直到队列为空。
## 2.3 实践:无向图连通组件的编程实现
### 2.3.1 编程语言的选择与环境搭建
选择适合图算法编程实现的编程语言很重要。通常,C++、Python或Java是不错的选择,因为它们都支持高效的数据结构和算法实现,并且拥有丰富的库。对于本实践,我们选择使用Python进行实现,因为其简洁的语法和强大的库支持使得算法原型开发更加高效。
环境搭建主要包括安装Python解释器、必要的第三方库,例如`networkx`用于图的表示和操作,以及`matplotlib`用于绘图和可视化。可以通过包管理工具如pip来安装这些库。
### 2.3.2 算法实现与案例分析
让我们从一个实际案例开始,来实现无向图的连通组件查找。假设我们有如下无向图:
```
0 -- 1
| |
| |
2 -- 3
```
我们将创建一个图的表示,并使用DFS或BFS算法来找出所有连通分量。
Python代码示例(使用DFS):
```python
# 定义图的结构
graph = {
0: [1, 2],
1: [0, 3],
2: [0],
3: [1]
}
def find_connected_components(graph):
visited = set()
components = []
for v in graph.keys():
if v not in visited:
connected_nodes = set()
stack = [v]
while stack:
node = stack.pop()
if node not in visited:
connected_nodes.add(node)
visited.add(node)
stack.extend(set(graph[node]) - connected_nodes)
components.append(connected_nodes)
return components
components = find_connected_components(graph)
print("连通分量:", components)
```
在这段代码中,我们遍历图中所有未访问的顶点,并使用DFS找出与每个顶点相连的所有顶点,直到没有新的顶点可以访问。最终的`components`列表包含了所有找到的连通分量。
这个过程不仅帮助我们理解算法的执行逻辑,还展示了如何将理论应用到实际问题中,这在IT行业中是一项极其重要的能力。通过对图连通性问题的深入分析和实践,我们可以构建更加高效和鲁棒的网

 百万级
高质量VIP文章无限畅学
百万级
高质量VIP文章无限畅学
 千万级
优质资源任意下载
千万级
优质资源任意下载
 C知道
免费提问 ( 生成式Al产品 )
C知道
免费提问 ( 生成式Al产品 )
0
0
相关推荐

专栏简介
本专栏全面解析了图数据结构,从基础概念到核心算法,深入剖析了图遍历技术(DFS 和 BFS)和图算法基础(最小生成树、最短路径)。专栏还探讨了图的智能搜索算法(A*)、连通性分析、拓扑排序、存储优化和动态生成技术。此外,专栏还介绍了图算法在社交网络中的应用、性能对比和可视化技术。通过对图算法的深入探索,包括并行化、分布式处理、递归算法、回溯算法、动态规划和启发式搜索,本专栏为读者提供了全面了解和掌握图数据结构和算法的宝贵资源。
专栏目录
最低0.47元/天 解锁专栏
买1年送3月
百万级
高质量VIP文章无限畅学
千万级
优质资源任意下载
C知道
免费提问 ( 生成式Al产品 )
最新推荐
【昆仑通态触摸屏连接PLC终极指南】:从入门到性能优化的10大秘籍

# 摘要
本文全面阐述了昆仑通态触摸屏与PLC的基本连接及其高级应用技巧,探讨了配置触摸屏的关键步骤、PLC连接设置、故障排查以及触摸屏与PLC之间的数据交换机制。进一步地,文章深入分析了昆仑通态触摸屏的高级通讯协议,包括工业通讯协议的选择、Modbus和Profibus协议的应用,以及通讯性能优化的策略。此外,通过实际项目案例,本文展示了触摸屏在自动化生产线中的应用,分析了性能调优、故障处理以及持续改进与维
国产安路FPGA PH1A芯片时序分析与优化:必备的5大技巧

# 摘要
安路FPGA PH1A芯片作为本研究的核心,本文首先对其进行了概述,并在随后的章节中详细探讨了FPGA时序分析的基础知识和优化技巧。文章从静态和动态时序分析的理论与实践出发,逐步深入到时钟域交叉、数据冒险、控制冒险的识别与处理,以及资源优化与布局布线的技巧。此外,通过对一个具体的设计实例进行分析,展示了时序分析工具在实际应用中的重要性以及如何解决时序问题。最后,本文探讨了高级时序优化技
【Zynq裸机LWIP初始化基础】:一步步带你入门网络配置

# 摘要
本论文旨在探讨Zynq硬件平台与LWIP协议栈的集成与配置,以及在此基础上进行的进阶网络应用开发。文章首先介绍了Zynq硬件和网络配置的基本概念,随后深入解析了LWIP协议栈的起源、特点及其在嵌入式系统中的作用。接着,详细阐述了LWIP协议栈的安装、结构组件以及如何在Zynq平台上进行有效配置。在交互基础方面,文章讲述了Zynq平台网络接口的初始化、LWIP网络接口的设置和网络事件的处理。随后,通过LWIP初始
【从RGB到CMYK】:设计师色彩转换的艺术与科学
# 摘要
本文系统地介绍了色彩模式的基础知识及其在数字媒体和印刷行业中的应用,特别深入探讨了RGB与CMYK色彩模型的原理、特点及转换实践。文章不仅阐述了色彩转换的理论基础,还介绍了色彩校正与管理的实践技巧,提供了从理论到实践的全面解析。通过对色彩转换中遇到的问题和解决方案的分析,以及设计项目中的案例分析,本文展望了色彩转换技术的未来发展趋势,并提出了设计师为应对这些变化所应采取的策略和准备。
# 关键字
色彩模式;RGB模型;CMYK模型;色彩转换;色彩校正;案例分析
参考资源链接:[CMYK标准色色值-设计师用专业CMYK标准色对照表](https://wenku.csdn.net/d
非接触卡片APDU指令全攻略:从基础到高级交互的实战指南
# 摘要
非接触式卡片技术在现代身份验证和支付系统中扮演着核心角色。本文首先对非接触式卡片及其应用协议数据单元(APDU)指令进行了全面概述,然后深入探讨了APDU指令的基础知识,包括其格式、结构和常用指令的详解。文章接着分析了非接触式卡片的通信协议,重点解读了ISO/IEC 14443标准,并探讨了NFC技术在非接触式卡片应用中的作用。文章还提供了关于非接触式卡片高级交互技巧的见解,包括
【CST816D数据手册深度剖析】:微控制器硬件接口与编程全攻略(2023年版)

# 摘要
本文全面介绍了CST816D微控制器的硬件架构和技术细节。从基础硬件概述开始,文章详细探讨了CST816D的硬件接口技术,包括I/O端口操作、中断系统设计、定时器/计数器高级应用等关键领域。接着,本文深
STAR CCM+流道抽取进阶技巧:5步提升模拟效率的专业秘笈
# 摘要
本文旨在全面介绍STAR-CCM+流道抽取技术,并探讨其在实际应用中的理论基础与方法论。通过详细分析流道抽取的重要性及其理论模型,本文阐述了不同技术方法在流道抽取中的作用,并对比了它们的优缺点。进一步地,文章深入讨论了高级抽取技巧、模型简化以及
金蝶云星空初级实施认证考试攻略:揭秘通关密钥!

# 摘要
本文全面介绍了金蝶云星空初级实施认证的相关内容,从产品知识到认证的准备与考试流程,再到认证后的职业发展,为准备参加金蝶云星空初级认证的考生提供了详细的指导。首先概述了金蝶云星空的核心理念、应用架构及其行业解决方案。其次,深入分析了认证考试的必考知识点,包括理论知识、操作技能和实战演练,并提供了备考策略与时间管理方法。最后,探讨了认证考试的具体流程、注意事项以及通过认证后如何促进职业
【云开发,轻松搞定后端】:微信小程序问卷案例中的云数据库应用技巧

# 摘要
云开发作为一种新兴的开发模式,通过整合云数据库和云函数等资源,为开发者提供了便捷、高效的开发环境。本文首先介绍云开发的基本概念与微信小程序开发基础,随后详细探讨了云数据库的操作实践、权限管理和安全机制,并通过微信小程序问卷案例展示了云数据库的具体应用和性能优化。接着,文章深入到云数据库的高级技巧和最佳实践,如事务处理、数据备份与恢复,以及优化案例。最后,探讨了云函数的概念、优势、编写
QN8035规范解读与应用:标准遵循的必要性与实践技巧
# 摘要
本文全面解读了QN8035规范,旨在为相关行业提供实践指导和理论支持。文章首先概述了QN8035规范的核心内容,分析了其发展历程、核心要求以及与行业标准的关联。其次,本文深入探讨了遵循QN8035规范的必要性,重点介绍了实施规范的步骤、企业内部贯彻培训的有效方法以及常见问题的解决方案。通过对比分析成功案例与问题案例,文章总结了QN8035规范的实践经验与教训。最后,本文展望了QN8035规范的未来发展趋势和潜在改进方向,并提出了对企业和行业的建议。
# 关键字
QN8035规范;理论基础;实践技巧;案例分析;行业标准;未来展望
参考资源链接:[QN8035设计指南:硬件与编程全面
资源上传下载、课程学习等过程中有任何疑问或建议,欢迎提出宝贵意见哦~我们会及时处理!
点击此处反馈


专栏目录
最低0.47元/天 解锁专栏
买1年送3月
百万级
高质量VIP文章无限畅学
千万级
优质资源任意下载
C知道
免费提问 ( 生成式Al产品 )