【算法大比拼】:SVM vs. 决策树 vs. 神经网络:谁主沉浮?
发布时间: 2024-09-03 18:11:32 阅读量: 167 订阅数: 63 

决策树、神经网络、SVM_
# 1. 机器学习算法概述
## 1.1 机器学习的定义与重要性
机器学习是一门让计算机能够从经验中学习的科学,它赋予了计算机自我进步的能力。通过算法对数据进行学习,机器可以识别复杂模式并做出智能决策或预测。在数据驱动的当今世界,机器学习已成为不可或缺的技术,广泛应用于推荐系统、图像识别、语音识别、自然语言处理等领域。
## 1.2 机器学习的主要类别
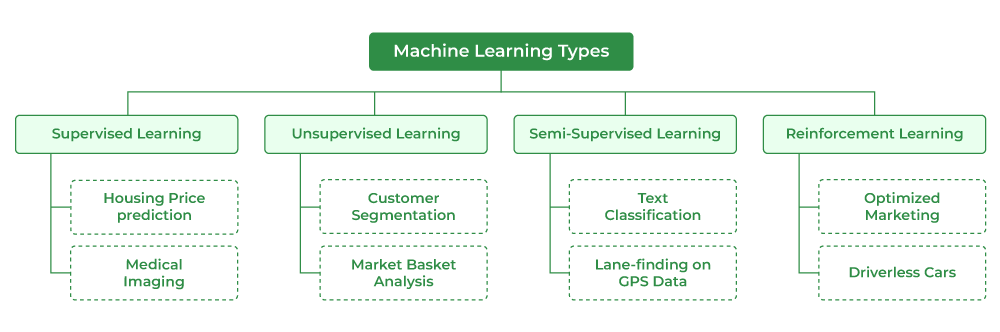
机器学习算法主要分为三种类型:监督学习、无监督学习和强化学习。
- 监督学习通过训练数据中的输入和输出,预测未知数据的输出。
- 无监督学习探索数据中的隐藏结构和模式,没有预定义的标签。
- 强化学习侧重于如何基于环境采取行动以最大化某种累积奖励。
## 1.3 机器学习的工作流程
机器学习的工作流程包括数据预处理、特征工程、模型选择、训练与测试几个关键步骤。其中数据预处理关注清洗和格式化数据,特征工程旨在提取重要特征,模型选择则是根据问题类型和数据特性挑选合适的算法,而训练与测试则涉及模型的拟合和评估。
在随后的章节中,我们将深入探讨支持向量机(SVM)等具体算法的原理、实战应用和优化策略,逐步揭示机器学习的强大功能和实践技巧。
# 2. 支持向量机(SVM)深度解析
支持向量机(SVM)作为机器学习中的一个经典算法,长久以来被广泛研究和应用。其核心思想是寻找一个超平面来对不同类别的数据进行分隔,使得分类间隔最大化。这一原理不仅适用于线性可分的数据,通过引入核技巧,SVM在处理非线性问题上也表现出色。本章节将深入探讨SVM的基本原理、优缺点以及实际应用。
## 2.1 SVM基本原理与数学模型
### 2.1.1 最大间隔分类器的概念
在讲到SVM时,一个关键的概念就是最大间隔分类器。在特征空间中,SVM寻找一个超平面,使不同类别数据间的间隔最大化。在二分类问题中,我们可以将数据表示为特征向量 x,类别标签为 y(+1 或 -1)。SVM的目标是找到一个超平面(即决策边界),满足对于所有的训练样本,其分类边界(间隔)都是最大的。
用数学的语言表达就是,要找到一个向量 w 和偏置 b,使得对于所有的数据点 (x_i, y_i),都有 y_i(w*x_i + b) ≥ 1。这个几何间隔是由 w 的范数决定的,所以要最大化间隔,等价于最小化 ||w|| 的平方,这可以通过解决一个二次规划问题来完成。
```mathematica
Minimize over w, b: ||w||^2
Subject to: y_i(w*x_i + b) ≥ 1, for all i = 1, ..., n
```
### 2.1.2 核技巧与非线性SVM
现实世界中的数据往往是线性不可分的,这个时候就需要非线性SVM登场了。核技巧是处理非线性问题的关键技术之一。它通过将原始数据映射到高维空间,来在高维空间中寻找线性可分的超平面。但是,直接在高维空间中进行计算是非常耗时的,核技巧通过对偶问题的核函数来避免这种高昂的计算成本。
核函数能够有效地计算高维空间中的点积,而无需显式地映射数据。常用的核函数包括线性核、多项式核、径向基(RBF)核和sigmoid核。通过选择合适的核函数和调整参数,非线性SVM能够在各种复杂度的数据上取得良好的分类效果。
```python
from sklearn.svm import SVC
from sklearn.datasets import make_classification
# 创建非线性可分的模拟数据
X, y = make_classification(n_samples=100, n_features=2, n_redundant=0, n_clusters_per_class=1, random_state=4)
# 使用RBF核的SVM模型
model = SVC(kernel='rbf')
model.fit(X, y)
```
## 2.2 SVM的优缺点与应用场景
### 2.2.1 SVM的性能优势
SVM之所以成为机器学习领域的宠儿,很大程度上得益于其在小样本数据集上的优秀表现。当数据集规模较小时,SVM往往能够获得比其他算法更好的泛化能力。其最大间隔原则让模型对异常值具有一定的鲁棒性,这在一定程度上提高了模型的可靠性。此外,通过使用不同的核函数,SVM可以适应各种复杂的数据结构,包括非线性问题。
### 2.2.2 SVM在现实问题中的局限性
尽管SVM在某些方面表现出色,但它也有局限性。首先,SVM的计算复杂度较高,特别是在处理大规模数据集时,训练速度可能显著降低。其次,SVM的参数调整是一个挑战,尤其是当核函数和正则化参数都需要选择时。还有,SVM对于数据预处理非常敏感,比如需要仔细地特征缩放和归一化,否则可能导致模型性能不佳。
## 2.3 SVM的实战演练
### 2.3.1 SVM分类器的实现与调优
要实现一个SVM分类器,我们可以使用像scikit-learn这样的库来简化操作。下面是一个简单的例子,展示了如何使用Python和scikit-learn来构建一个SVM分类器,并通过网格搜索对模型进行调优。
```python
from sklearn.datasets import load_iris
from sklearn.model_selection import train_test_split, GridSearchCV
from sklearn.svm import SVC
from sklearn.metrics import classification_report
# 加载数据集
iris = load_iris()
X, y = iris.data, iris.target
# 划分训练集和测试集
X_train, X_test, y_train, y_test = train_test_split(X, y, test_size=0.3, random_state=42)
# 创建SVM分类器
svc = SVC()
# 使用网格搜索寻找最佳参数
parameters = {'kernel':('linear', 'rbf'), 'C':[1, 10]}
svc_search = GridSearchCV(svc, parameters, cv=5)
svc_search.fit(X_train, y_train)
# 输出最佳参数和分类结果
print("Best parameters found: ", svc_search.best_params_)
print("Classification report for best parameters:")
print(classification_report(y_test, svc_search.predict(X_test)))
```
### 2.3.2 SVM回归的实现与案例分析
SVM不仅可以用于分类问题,还可以通过修改为支持向量回归(SVR)来处理回归问题。SVR的目标是找到一个函数,尽可能在误差范围内拟合到数据的分布。下面是一个使用SVR进行房价预测的简单例子。
```python
from sklearn.datasets import load_boston
from sklearn.svm import SVR
from sklearn.model_selection import train_test_split
from sklearn.preprocessing import StandardScaler
from sklearn.metrics import mean_squared_error
# 加载数据集
boston = load_boston()
X, y = boston.data, boston.target
# 标准化特征数据
scaler = StandardScaler()
X_scaled = scaler.fit_transform(X)
# 划分训练集和测试集
X_train, X_test, y_train, y_test = train_test_split(X_scaled, y, test_size=0.3, random_state=42)
# 创建SVR模型并拟合数据
svr = SVR(kernel='rbf', C=1.0, epsilon=0.2)
svr.fit(X_train, y_train)
# 预测测试集并计算均方误差
y_pred = svr.predict(X_test)
mse = mean_squared_error(y_test, y_pred)
print(f"Mean Squared Error: {mse}")
```
在这个例子中,我们使用了波士顿房价数据集,并对数据进行了标准化处理。通过选择合适的核函数和参数,SVR模型对房价进行回归分析。通过均方误差我们可以评估模型预测的准确性。
# 3. 决策树算法的原理与应用
## 3.1 决策树的工作机制
### 3.1.1 树结构的构建过程
决策树是一种经典的分类与回归方法,通过将数据集的特征分裂成多个区间,使得每个区间的样本尽可能属于同一类别(分类问题)或具有相似的输出值(回归问题)。构建决策树的过程涉及到特征选择、节点划分以及树的停止条件。
在构建决策树时,信息增益、基尼指数、均方误差等是常用的分裂标准。以信息增益为例,核心思想是选择信息增益最大的特征进行分裂,以期得到最大程度的纯度提升。信息增益的计算公式如下:
```
信息增益 = 熵(父节点) - [加权平均熵(子节点)]
```
其中,熵是度量数据集纯度的指标,信息增益越大,说明利用该特征进行数据划分后,数据的纯度提升得越多。
**代码示例:使用ID3算法计算信息增益**
```python
import numpy as np
# 以简单的数据集为例,计算信息增益
def calculate_entropy(data):
label_counts = np.bincount(data)
entropy = -np.sum([(count / np.sum(label_counts)) * np.log2(count / np.sum(label_counts)) for count in
```

 百万级
高质量VIP文章无限畅学
百万级
高质量VIP文章无限畅学
 千万级
优质资源任意下载
千万级
优质资源任意下载
 C知道
免费提问 ( 生成式Al产品 )
C知道
免费提问 ( 生成式Al产品 )
0
0
相关推荐

专栏简介
本专栏深入剖析了支持向量机(SVM)算法,从基础原理到实战应用,一文读懂。专栏涵盖了SVM的非线性分类、正则化、超参数调优、案例分析、算法对比、图像识别、优化算法、大规模数据集处理、理论进阶、数学基础、性能评估、生物信息学应用、数据降维、局限性以及金融领域应用等多个方面。通过深入浅出的讲解和丰富的案例,专栏旨在帮助读者全面掌握SVM算法,并将其应用于实际问题中,提升机器学习技能。
专栏目录
最低0.47元/天 解锁专栏
买1年送3月
百万级
高质量VIP文章无限畅学
千万级
优质资源任意下载
C知道
免费提问 ( 生成式Al产品 )
最新推荐
潮流分析的艺术:PSD-BPA软件高级功能深度介绍

# 摘要
电力系统分析在保证电网安全稳定运行中起着至关重要的作用。本文首先介绍了潮流分析的基础知识以及PSD-BPA软件的概况。接着详细阐述了PSD-BPA的潮流计算功能,包括电力系统的基本模型、潮流计算的数学原理以及如何设置潮流计算参数。本文还深入探讨了PSD-BPA的高级功
RTC4版本迭代秘籍:平滑升级与维护的最佳实践
# 摘要
本文重点讨论了RTC4版本迭代的平滑升级过程,包括理论基础、实践中的迭代与维护,以及维护与技术支持。文章首先概述了RTC4的版本迭代概览,然后详细分析了平滑升级的理论基础,包括架构与组件分析、升级策略与计划制定、技术要点。在实践章节中,本文探讨了版本控制与代码审查、单元测试
嵌入式系统中的BMP应用挑战:格式适配与性能优化
# 摘要
本文综合探讨了BMP格式在嵌入式系统中的应用,以及如何优化相关图像处理与系统性能。文章首先概述了嵌入式系统与BMP格式的基本概念,并深入分析了BMP格式在嵌入式系统中的应用细节,包括结构解析、适配问题以及优化存储资源的策略。接着,本文着重介绍了BMP图像的处理方法,如压缩技术、渲染技术以及资源和性能优化措施。最后,通过具体应用案例和实践,展示了如何在嵌入式设备中有效利用BMP图像,并探讨了开发工具链的重要性。文章展望了高级图像处理技术和新兴格式的兼容性,以及未来嵌入式系统与人工智能结合的可能方向。
# 关键字
嵌入式系统;BMP格式;图像处理;性能优化;资源适配;人工智能
参考资
SSD1306在智能穿戴设备中的应用:设计与实现终极指南
# 摘要
SSD1306是一款广泛应用于智能穿戴设备的OLED显示屏,具有独特的技术参数和功能优势。本文首先介绍了SSD1306的技术概览及其在智能穿戴设备中的应用,然后深入探讨了其编程与控制技术,包括基本编程、动画与图形显示以及高级交互功能的实现。接着,本文着重分析了SSD1306在智能穿戴应用中的设计原则和能效管理策略,以及实际应用中的案例分析。最后,文章对SSD1306未来的发展方向进行了展望,包括新型显示技术的对比、市场分析以及持续开发的可能性。
# 关键字
SSD1306;OLED显示;智能穿戴;编程与控制;用户界面设计;能效管理;市场分析
参考资源链接:[SSD1306 OLE
ECOTALK数据科学应用:机器学习模型在预测分析中的真实案例

# 摘要
本文对机器学习模型的基础理论与技术进行了综合概述,并详细探讨了数据准备、预处理技巧、模型构建与优化方法,以及预测分析案例研究。文章首先回顾了机器学习的基本概念和技术要点,然后重点介绍了数据清洗、特征工程、数据集划分以及交叉验证等关键环节。接
PM813S内存管理优化技巧:提升系统性能的关键步骤,专家分享!
# 摘要
PM813S作为一款具有先进内存管理功能的系统,其内存管理机制对于系统性能和稳定性至关重要。本文首先概述了PM813S内存管理的基础架构,然后分析了内存分配与回收机制、内存碎片化问题以及物理与虚拟内存的概念。特别关注了多级页表机制以及内存优化实践技巧,如缓存优化和内存压缩技术的应用。通过性能评估指标和调优实践的探讨,本文还为系统监控和内存性能提
CC-LINK远程IO模块AJ65SBTB1现场应用指南:常见问题快速解决
# 摘要
CC-LINK远程IO模块作为一种工业通信技术,为自动化和控制系统提供了高效的数据交换和设备管理能力。本文首先概述了CC-LINK远程IO模块的基础知识,接着详细介绍了其安装与配置流程,包括硬件的物理连接和系统集成要求,以及软件的参数设置与优化。为应对潜在的故障问题,本文还提供了故障诊断与排除的方法,并探讨了故障解决的实践案例。在高级应用方面,文中讲述了如何进行编程与控制,以及如何实现系统扩展与集成。最后,本文强调了CC-LINK远程IO模块的维护与管理的重要性,并对未来技术发展趋势进行了展望。
# 关键字
CC-LINK远程IO模块;系统集成;故障诊断;性能优化;编程与控制;维护
【光辐射测量教育】:IT专业人员的培训课程与教育指南

# 摘要
光辐射测量是现代科技中应用广泛的领域,涉及到基础理论、测量设备、技术应用、教育课程设计等多个方面。本文首先介绍了光辐射测量的基础知识,然后详细探讨了不同类型的光辐射测量设备及其工作原理和分类选择。接着,本文分析了光辐射测量技术及其在环境监测、农业和医疗等不同领域的应用实例。教育课程设计章节则着重于如何构建理论与实践相结合的教育内容,并提出了评估与反馈机制。最后,本文展望了光辐射测量教育的未来趋势,讨论了技术发展对教育内容和教
【Ubuntu 16.04系统更新与维护】:保持系统最新状态的策略
# 摘要
本文针对Ubuntu 16.04系统更新与维护进行了全面的概述,探讨了系统更新的基础理论、实践技巧以及在更新过程中可能遇到的常见问题。文章详细介绍了安全加固与维护的策略,包括安全更新与补丁管理、系统加固实践技巧及监控与日志分析。在备份与灾难恢复方面,本文阐述了
分析准确性提升之道:谢菲尔德工具箱参数优化攻略

# 摘要
本文介绍了谢菲尔德工具箱的基本概念及其在各种应用领域的重要性。文章首先阐述了参数优化的基础理论,包括定义、目标、方法论以及常见算法,并对确定性与随机性方法、单目标与多目标优化进行了讨论。接着,本文详细说明了谢菲尔德工具箱的安装与配置过程,包括环境选择、参数配置、优化流程设置以及调试与问题排查。此外,通过实战演练章节,文章分析了案例应用,并对参数调优的实验过程与结果评估给出了具体指
资源上传下载、课程学习等过程中有任何疑问或建议,欢迎提出宝贵意见哦~我们会及时处理!
点击此处反馈


专栏目录
最低0.47元/天 解锁专栏
买1年送3月
百万级
高质量VIP文章无限畅学
千万级
优质资源任意下载
C知道
免费提问 ( 生成式Al产品 )