箱线图在时间序列分析中的应用:探索数据分布的动态变化,掌握时间序列数据的奥秘
发布时间: 2024-07-12 17:56:44 阅读量: 117 订阅数: 45 
# 1. 时间序列分析概述
时间序列分析是一种统计技术,用于分析随着时间变化而收集的数据。它广泛应用于金融、经济、医疗保健和工业等领域,以了解数据模式、预测未来趋势并做出明智决策。
时间序列数据通常表现出时间相关性,即当前值受过去值的影响。因此,时间序列分析需要考虑数据的历史背景和时间依赖性。通过对时间序列数据的分析,我们可以提取有价值的信息,例如趋势、季节性、周期性和异常值,从而深入了解数据的行为和潜在规律。
# 2. 箱线图在时间序列分析中的理论基础
### 2.1 箱线图的基本原理和特点
箱线图是一种用于可视化数据分布的图表。它通过绘制数据的中位数、四分位数和极值来展示数据的中心趋势、离散度和分布形状。
箱线图的绘制原理如下:
1. **中位数:**将数据从小到大排序,中间值即为中位数。
2. **四分位数:**将数据分为四等份,分别为下四分位数(Q1)、中位数(Q2)和上四分位数(Q3)。
3. **极值:**数据中大于上四分位数 1.5 倍 IQR(四分位距)的值称为上极值,小于下四分位数 1.5 倍 IQR 的值称为下极值。
4. **箱体:**由下四分位数和上四分位数形成的矩形区域称为箱体,表示数据的中部 50%。
5. **触须:**从箱体边缘延伸到极值或最大/最小值(如果不存在极值)的线段称为触须。
### 2.2 箱线图在时间序列分析中的适用性
箱线图在时间序列分析中具有广泛的适用性,主要原因如下:
* **数据分布可视化:**箱线图可以清晰地展示时间序列数据的分布形状,包括中心趋势、离散度和极值。
* **异常值识别:**箱线图可以帮助识别时间序列数据中的异常值,这些异常值可能指示数据异常或异常事件。
* **趋势和周期性分析:**箱线图可以用于分析时间序列数据的趋势和周期性模式,为预测和决策提供依据。
* **多变量分析:**箱线图可以用于比较和分析多变量时间序列数据的分布和相关性。
# 3.1 时间序列数据的可视化和探索
#### 3.1.1 箱线图绘制方法和参数选择
**箱线图绘制方法**
箱线图的绘制方法相对简单,可以通过以下步骤完成:
1. **排序数据:**将时间序列数据从小到大排序。
2. **确定四分位数:**计算数据的中位数(Q2)、下四分位数(Q1)和上四分位数(Q3)。
3. **绘制箱体:**以Q1和Q3为上下边界,绘制一个矩形框。
4. **绘制中位线:**在箱体中间绘制一条线,表示中位数。
5. **绘制须发:**从Q1和Q3向外延伸两条线,称为须发。须发延伸的范围通常为1.5倍的四分位数间距(IQR),即IQR =

 百万级
高质量VIP文章无限畅学
百万级
高质量VIP文章无限畅学
 千万级
优质资源任意下载
千万级
优质资源任意下载
 C知道
免费提问 ( 生成式Al产品 )
C知道
免费提问 ( 生成式Al产品 )
0
0
相关推荐

专栏简介
《箱线图》专栏深入探究箱线图这一强大的数据可视化工具,揭示其在数据分析中的秘密武器地位。专栏通过一系列文章,全面介绍了箱线图的原理、绘制、解读和应用技巧,涵盖了从入门到精通的各个层面。专栏还深入探讨了箱线图在不同行业中的应用案例,从金融分析到医疗保健,从制造业到社会科学,展示了其在数据驱动决策中的重要作用。此外,专栏还对比了箱线图与其他数据可视化方法的优缺点,并探讨了其在异常值检测、时间序列分析、机器学习、预测建模等领域的应用。通过阅读本专栏,读者将掌握箱线图这一利器,驾驭数据分布,提升数据分析能力。
专栏目录
最低0.47元/天 解锁专栏
买1年送3月
百万级
高质量VIP文章无限畅学
千万级
优质资源任意下载
C知道
免费提问 ( 生成式Al产品 )
最新推荐
VR_AR技术学习与应用:学习曲线在虚拟现实领域的探索

# 1. 虚拟现实技术概览
虚拟现实(VR)技术,又称为虚拟环境(VE)技术,是一种使用计算机模拟生成的能与用户交互的三维虚拟环境。这种环境可以通过用户的视觉、听觉、触觉甚至嗅觉感受到,给人一种身临其境的感觉。VR技术是通过一系列的硬件和软件来实现的,包括头戴显示器、数据手套、跟踪系统、三维声音系统、高性能计算机等。
VR技术的应用
特征贡献的Shapley分析:深入理解模型复杂度的实用方法

# 1. 特征贡献的Shapley分析概述
在数据科学领域,模型解释性(Model Explainability)是确保人工智能(AI)应用负责任和可信赖的关键因素。机器学习模型,尤其是复杂的非线性模型如深度学习,往往被认为是“黑箱”,因为它们的内部工作机制并不透明。然而,随着机器学习越来越多地应用于关键决策领域,如金融风控、医疗诊断和交通管理,理解模型的决策过程变得至关重要
随机搜索在强化学习算法中的应用

# 1. 强化学习算法基础
强化学习是一种机器学习方法,侧重于如何基于环境做出决策以最大化某种累积奖励。本章节将为读者提供强化学习算法的基础知识,为后续章节中随机搜索与强化学习结合的深入探讨打下理论基础。
## 1.1 强化学习的概念和框架
强化学习涉及智能体(Agent)与环境(Environment)之间的交互。智能体通过执行动作(Action)影响环境,并根据环境的反馈获得奖
过拟合的统计检验:如何量化模型的泛化能力

# 1. 过拟合的概念与影响
## 1.1 过拟合的定义
过拟合(overfitting)是机器学习领域中一个关键问题,当模型对训练数据的拟合程度过高,以至于捕捉到了数据中的噪声和异常值,导致模型泛化能力下降,无法很好地预测新的、未见过的数据。这种情况下的模型性能在训练数据上表现优异,但在新的数据集上却表现不佳。
## 1.2 过拟合产生的原因
过拟合的产生通常与模
【统计学意义的验证集】:理解验证集在机器学习模型选择与评估中的重要性
# 1. 验证集的概念与作用
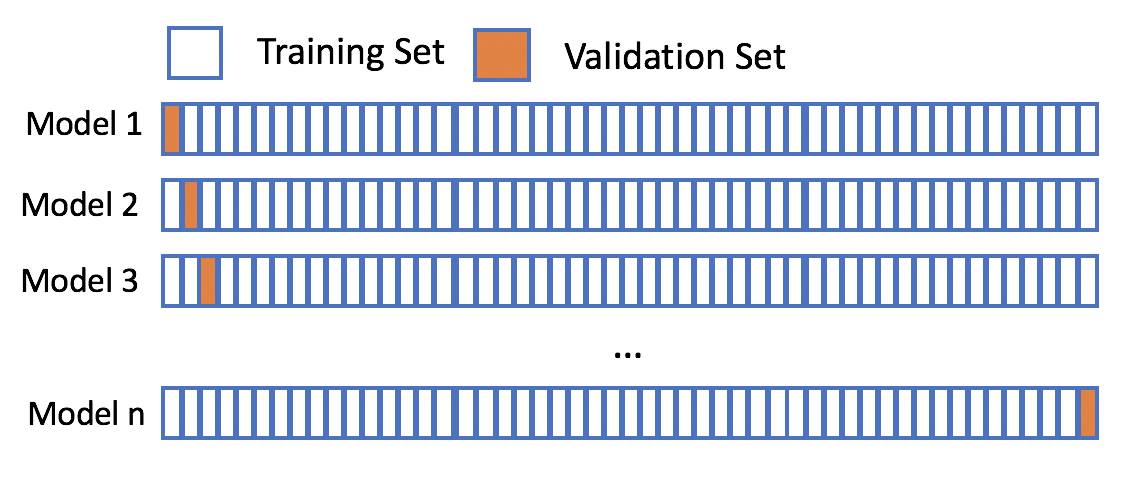
在机器学习和统计学中,验证集是用来评估模型性能和选择超参数的重要工具。**验证集**是在训练集之外的一个独立数据集,通过对这个数据集的预测结果来估计模型在未见数据上的表现,从而避免了过拟合问题。验证集的作用不仅仅在于选择最佳模型,还能帮助我们理解模型在实际应用中的泛化能力,是开发高质量预测模型不可或缺的一部分。
```markdown
## 1.1 验证集与训练集、测试集的区
网格搜索:多目标优化的实战技巧

# 1. 网格搜索技术概述
## 1.1 网格搜索的基本概念
网格搜索(Grid Search)是一种系统化、高效地遍历多维空间参数的优化方法。它通过在每个参数维度上定义一系列候选值,并
机器学习调试实战:分析并优化模型性能的偏差与方差
# 1. 机器学习调试的概念和重要性
## 什么是机器学习调试
机器学习调试是指在开发机器学习模型的过程中,通过识别和解决模型性能不佳的问题来改善模型预测准确性的过程。它是模型训练不可或缺的环节,涵盖了从数据预处理到最终模型部署的每一个步骤。
## 调试的重要性
有效的调试能够显著提高模型的泛化能力,即在未见过的数据上也能作出准确预测的能力。没有经过适当调试的模型可能无法应对实
激活函数在深度学习中的应用:欠拟合克星
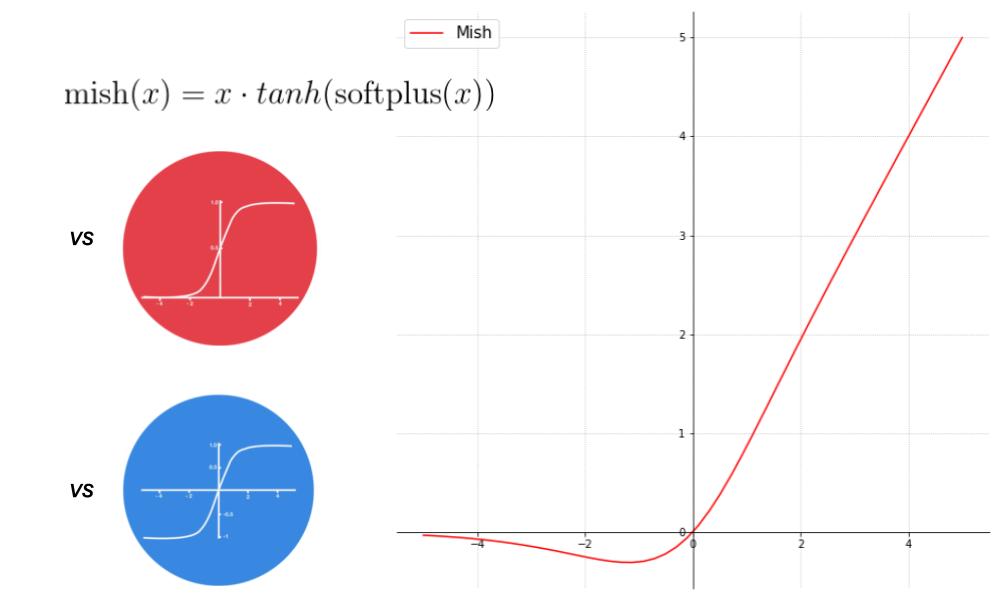
# 1. 深度学习中的激活函数基础
在深度学习领域,激活函数扮演着至关重要的角色。激活函数的主要作用是在神经网络中引入非线性,从而使网络有能力捕捉复杂的数据模式。它是连接层与层之间的关键,能够影响模型的性能和复杂度。深度学习模型的计算过程往往是一个线性操作,如果没有激活函数,无论网络有多少层,其表达能力都受限于一个线性模型,这无疑极大地限制了模型在现实问题中的应用潜力。
激活函数的基本
注意力机制与过拟合:深度学习中的关键关系探讨

# 1. 深度学习的注意力机制概述
## 概念引入
注意力机制是深度学习领域的一种创新技术,其灵感来源于人类视觉注意力的生物学机制。在深度学习模型中,注意力机制能够使模型在处理数据时,更加关注于输入数据中具有关键信息的部分,从而提高学习效率和任务性能。
## 重要性解析
贝叶斯优化软件实战:最佳工具与框架对比分析
# 1. 贝叶斯优化的基础理论
贝叶斯优化是一种概率模型,用于寻找给定黑盒函数的全局最优解。它特别适用于需要进行昂贵计算的场景,例如机器学习模型的超参数调优。贝叶斯优化的核心在于构建一个代理模型(通常是高斯过程),用以估计目标函数的行为,并基于此代理模型智能地选择下一点进行评估。
## 2.1 贝叶斯优化的基本概念
### 2.1.1 优化问题的数学模型
贝叶斯优化的基础模型通常包括目标函数 \(f(x)\),目标函数的参数空间 \(X\) 以及一个采集函数(Acquisition Function),用于决定下一步的探索点。目标函数 \(f(x)\) 通常是在计算上非常昂贵的,因此需
资源上传下载、课程学习等过程中有任何疑问或建议,欢迎提出宝贵意见哦~我们会及时处理!
点击此处反馈


专栏目录
最低0.47元/天 解锁专栏
买1年送3月
百万级
高质量VIP文章无限畅学
千万级
优质资源任意下载
C知道
免费提问 ( 生成式Al产品 )