A Preliminary Exploration of Excel Data Import in MATLAB
发布时间: 2024-09-15 16:03:01 阅读量: 27 订阅数: 28 
# 1. A Beginner's Guide to Importing Excel Data into MATLAB
## I. Introduction
A. Introduction to Data Interactivity between MATLAB and Excel
B. Research Background and Purpose of This Article
In this chapter, we will begin by introducing the data interactivity between MATLAB and Excel, discussing their importance in data processing and analysis. Next, we will elaborate on the research background and purpose of this article, providing readers with a comprehensive understanding of the content. Let us delve into the basic methods and techniques of importing Excel data into MATLAB together!
# 2. Basic Methods for Importing Excel Data into MATLAB
In MATLAB, we can import Excel data through various methods, including using built-in MATLAB functions and achieving efficient import through MATLAB plugins. The following will introduce these two basic methods separately.
# 3. III. Excel Data Preprocessing and Cleaning
After importing Excel data into MATLAB, it is usually necessary to perform some data preprocessing and cleaning operations to ensure the accuracy and reliability of the data. The following will introduce some common methods for Excel data preprocessing and cleaning.
#### A. Data Type Conversion and Missing Value Handling
When importing Excel data, situations of mismatched data types or missing values are often encountered. For data type conversion, MATLAB's built-in functions can be used for processing, such as `cell2table`, `table2array`, etc., to convert data into the required format for MATLAB. For handling missing values, rows or columns containing missing values can be deleted, or methods such as mean or median can be used to fill in the missing values.
**Example Code:**
```matlab
% Import Excel data
data = readtable('data.xlsx');
% Data type conversion
data.Var1 = string(data.Var1); % Convert the Var1 column to string type
data.Var2 = str2double(data.Var2); % Convert the Var2 column to double precision floating point type
% Missing value handling
data = rmmissing(data); % Delete rows containing missing values
data.Var3(isnan(data.Var3)) = mean(data.Var3, 'omitnan'); % Fill missing values in the Var3 column with the mean value
% Display the processed data
disp(data);
```
#### B. Data Filtering and Deduplication
During the data preprocessing phase, it is often necessary to filter data based on specific conditions or remove duplicate values. MATLAB provides a wealth of functions to achieve data filtering and deduplication operations, such as `find`, `unique`, etc.
**Example Code:**
```matlab
% Data filtering
filtered_data = data(data.Var2 > 50 & data.Var3 < 100, :); % Filter data where Var2 is greater than 50 and Var3 is less than 100
% Data deduplication
unique_data = unique(data, 'rows'); % Remove duplicate row data
% Display filtered and deduplicated data
disp(filtered_data);
disp(unique_data);
```
Through the above data preprocessing and cleaning operations, Excel data can be more standardized and suitable for subsequent analysis and processing after importing into MATLAB.
# 4. IV. Analysis and Visualization after Data Import
After successfully importing Excel data into MATLAB, we can then perform various analyses and visualization processes to better understand the information and trends behind the data.
#### A. Basic Statistical Analysis
After importing Excel data, we can use various functions provided by MATLAB to perform basic statistical analysis, such as calculating the mean, median, standard deviation, etc. The following is a simple example to calculate the mean and standard deviation of the imported Excel data:
```python
data = xlsread('data.xlsx'); % Read the imported Excel data
mean_value = mean(data); % Calculate the mean
std_deviation = std(data); % Calculate the standard deviation
disp('The mean value of the data is:');
disp(mean_value);
disp('The standard deviation of the data is:');
disp(std_deviation);
```
With the above code, we can easily obtain the mean and standard deviation of the Excel data, providing basic indicators for subsequent data analysis.
#### B. Data Visualization
In addition to basic statistical analysis, data visualization is a more intuitive and easily understandable way to understand data. MATLAB provides a wealth of plotting functions that can easily achieve the drawing of various charts, such as line charts, scatter plots, bar charts, etc. The following is a simple example showing how to draw a line chart of Excel data:
```python
data = xlsread('data.xlsx'); % Read the imported Excel data
plot(data); % Draw the data line chart
title('Excel Data Line Chart'); % Set the chart title
xlabel('Data Points'); % Set the x-axis label
ylabel('Data Values'); % Set the y-axis label
```
By visualizing the line chart, we can more intuitively observe the fluctuations and trends in the data, providing visual support for subsequent analysis.
In the process of analysis and visualization after data import, we can choose appropriate methods and tools based on specific needs, thereby exploring the meaning and structure of the data more deeply.
# 5. V. Advanced Applications and Techniques Discussion
After importing Excel data into MATLAB and performing basic processing, we can further explore some advanced applications and techniques to improve data processing efficiency and flexibility.
#### A. Batch Import of Multiple Excel Files
In real work, we often encounter situations where multiple Excel files need to be processed in batches. MATLAB provides convenient methods to achieve batch importing of multiple Excel files, which can be realized by using loop structures and functions.
```matlab
% Define the folder path
folder_path = 'C:\Your\Folder\Path';
% Get all Excel files in the folder
file_list = dir(fullfile(folder_path, '*.xlsx'));
% Loop to read each Excel file
for i = 1:length(file_list)
file_name = file_list(i).name;
full_file_path = fullfile(folder_path, file_name);
% Read Excel data
data = readmatrix(full_file_path); % Use readmatrix function to read data
% Perform data processing and analysis
% Add the data processing and analysis code you need here
end
```
With the above code, we can traverse all Excel files in the specified folder, read the data sequentially, and perform corresponding processing. This batch processing method can save a lot of manual processing time and improve work efficiency.
#### B. Big Data Volume Processing and Optimization Solutions
When dealing with large volumes of Excel files, in order to improve processing speed and reduce memory consumption, we can consider some optimization solutions. In MATLAB, we can optimize the efficiency of processing large volumes of data through appropriate techniques and functions, such as using appropriate data types, block reading and processing, etc.
```matlab
% Use readtable function to read large volumes of Excel files in blocks
opts = detectImportOptions('large_data.xlsx');
opts.NumHeaderLines = 1;
opts.VariableNamesRange = 'A1:E1';
data = readtable('large_data.xlsx',opts);
% Perform data processing and analysis
% Add the data processing and analysis code you need here
```
With the above example, we can achieve block reading of large volumes of Excel files through the parameter settings of the readtable function, thereby avoiding the memory pressure caused by reading in all data at once. This approach can effectively optimize the efficiency of processing large volumes of data.
Through the discussion in this section, we can further apply some advanced techniques to handle complex situations encountered in real work, improving data processing efficiency and flexibility.
# 6. VI. Conclusion and Outlook
In this article, we have delved into the methods and techniques for importing Excel data into MATLAB. By using MATLAB's built-in functions and plugins, we can easily achieve data import and processing, providing basic support for subsequent analysis. In the Excel data preprocessing phase, we introduced common operations such as data type conversion, missing value handling, data filtering and deduplication, ensuring data quality and accuracy.
In the analysis and visualization phase after data import, we showed how to perform basic statistical analysis and display the inherent rules and trends of data through visualization tools. This not only helps to deeply understand the characteristics of the data but also provides a reference basis for further exploration.
In the advanced applications and techniques discussion section, we explored how to batch import multiple Excel files and optimization solutions for processing large data volumes, enhancing data processing efficiency and accuracy.
In the future, with the continuous development of the data science field, the functions and performance of MATLAB in Excel data processing may be further enhanced and improved. We look forward to the emergence of more intelligent and automated data processing tools to help researchers and engineers more efficiently extract useful information from massive amounts of data, promoting the development of scientific research and engineering practice.

 百万级
高质量VIP文章无限畅学
百万级
高质量VIP文章无限畅学
 千万级
优质资源任意下载
千万级
优质资源任意下载
 C知道
免费提问 ( 生成式Al产品 )
C知道
免费提问 ( 生成式Al产品 )
0
0
相关推荐

专栏目录
最低0.47元/天 解锁专栏
买1年送3月
百万级
高质量VIP文章无限畅学
千万级
优质资源任意下载
C知道
免费提问 ( 生成式Al产品 )
最新推荐
AMESim液压仿真秘籍:专家级技巧助你从基础飞跃至顶尖水平

# 摘要
AMESim液压仿真软件是工程师们进行液压系统设计与分析的强大工具,它通过图形化界面简化了模型建立和仿真的流程。本文旨在为用户提供AMESim软件的全面介绍,从基础操作到高级技巧,再到项目实践案例分析,并对未来技术发展趋势进行展望。文中详细说明了AMESim的安装、界面熟悉、基础和高级液压模型的建立,以及如何运行、分析和验证仿真结果。通过探索自定义组件开发、多学科仿真集成以及高级仿真算法的应用,本文
【高频领域挑战】:VCO设计在微波工程中的突破与机遇
# 摘要
本论文深入探讨了压控振荡器(VCO)的基础理论与核心设计原则,并在微波工程的应用技术中展开详细讨论。通过对VCO工作原理、关键性能指标以及在微波通信系统中的作用进行分析,本文揭示了VCO设计面临的主要挑战,并提出了相应的技术对策,包括频率稳定性提升和噪声性能优化的方法。此外,论文还探讨了VCO设计的实践方法、案例分析和故障诊断策略,最后对VCO设计的创新思路、新技术趋势及未来发展挑战
实现SUN2000数据采集:MODBUS编程实践,数据掌控不二法门
# 摘要
本文系统地介绍了MODBUS协议及其在数据采集中的应用。首先,概述了MODBUS协议的基本原理和数据采集的基础知识。随后,详细解析了MODBUS协议的工作原理、地址和数据模型以及通讯模式,包括RTU和ASCII模式的特性及应用。紧接着,通过Python语言的MODBUS库,展示了MODBUS数据读取和写入的编程实践,提供了具体的实现方法和异常管理策略。本文还结合SUN20
【性能调优秘籍】:深度解析sco506系统安装后的优化策略
# 摘要
本文对sco506系统的性能调优进行了全面的介绍,首先概述了性能调优的基本概念,并对sco506系统的核心组件进行了介绍。深入探讨了核心参数调整、磁盘I/O、网络性能调优等关键性能领域。此外,本文还揭示了高级性能调优技巧,包括CPU资源和内存管理,以及文件系统性能的调整。为确保系统的安全性能,文章详细讨论了安全策略、防火墙与入侵检测系统的配置,以及系统审计与日志管理的优化。最后,本文提供了系统监控与维护的
网络延迟不再难题:实验二中常见问题的快速解决之道
# 摘要
网络延迟是影响网络性能的重要因素,其成因复杂,涉及网络架构、传输协议、硬件设备等多个方面。本文系统分析了网络延迟的成因及其对网络通信的影响,并探讨了网络延迟的测量、监控与优化策略。通过对不同测量工具和监控方法的比较,提出了针对性的网络架构优化方案,包括硬件升级、协议配置调整和资源动态管理等。
期末考试必备:移动互联网商业模式与用户体验设计精讲

# 摘要
移动互联网的迅速发展带动了商业模式的创新,同时用户体验设计的重要性日益凸显。本文首先概述了移动互联网商业模式的基本概念,接着深入探讨用户体验设计的基础,包括用户体验的定义、重要性、用户研究方法和交互设计原则。文章重点分析了移动应用的交互设计和视觉设计原则,并提供了设计实践案例。之后,文章转向移动商业模式的构建与创新,探讨了商业模式框架
【多语言环境编码实践】:在各种语言环境下正确处理UTF-8与GB2312
# 摘要
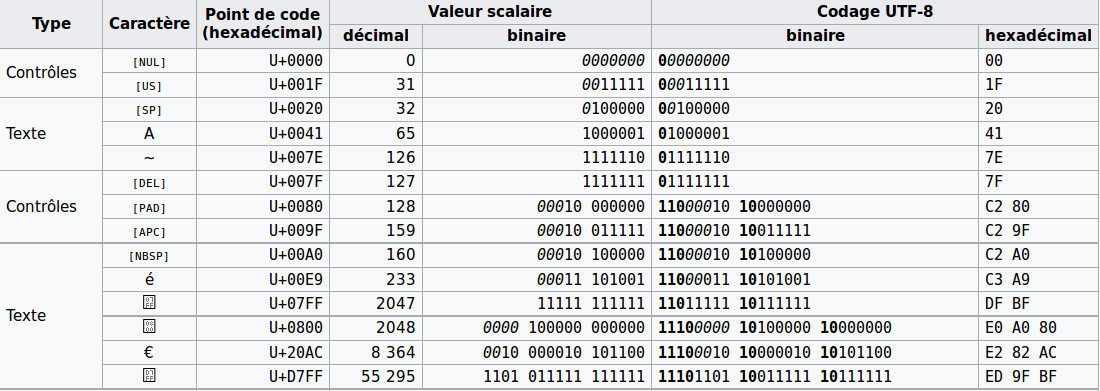
随着全球化的推进和互联网技术的发展,多语言环境下的编码问题变得日益重要。本文首先概述了编码基础与字符集,随后深入探讨了多语言环境所面临的编码挑战,包括字符编码的重要性、编码选择的考量以及编码转换的原则和方法。在此基础上,文章详细介绍了UTF-8和GB2312编码机制,并对两者进行了比较分析。此外,本文还分享了在不同编程语言中处理编码的实践技巧,
【数据库在人事管理系统中的应用】:理论与实践:专业解析
# 摘要
本文探讨了人事管理系统与数据库的紧密关系,分析了数据库设计的基础理论、规范化过程以及性能优化的实践策略。文中详细阐述了人事管理系统的数据库实现,包括表设计、视图、存储过程、触发器和事务处理机制。同时,本研究着重讨论了数据库的安全性问题,提出认证、授权、加密和备份等关键安全策略,以及维护和故障处理的最佳实践。最后,文章展望了人事管理系统的发展趋
【Docker MySQL故障诊断】:三步解决权限被拒难题
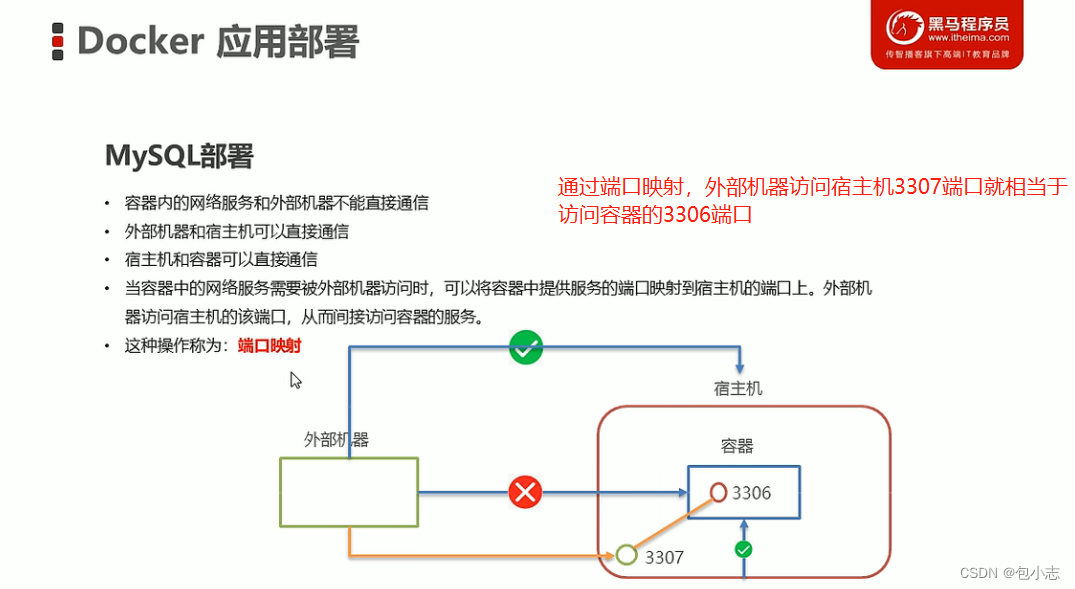
# 摘要
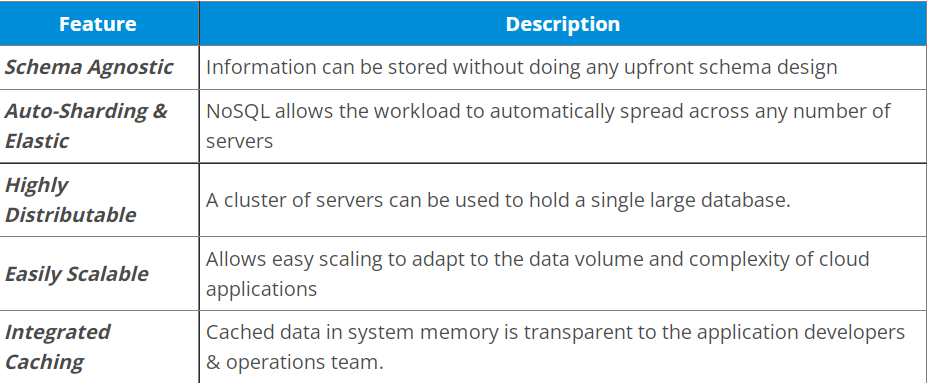
随着容器化技术的广泛应用,Docker已成为管理MySQL数据库的流行方式。本文旨在对Docker环境下MySQL权限问题进行系统的故障诊断概述,阐述了MySQL权限模型的基础理论和在Docker环境下的特殊性。通过理论与实践相结合,提出了诊断权限问题的流程和常见原因分析。本文还详细介绍了如何利用日志文件、配置检查以及命令行工具进行故障定位与修复,并探讨了权限被拒问题的解决策略和预防措施
资源上传下载、课程学习等过程中有任何疑问或建议,欢迎提出宝贵意见哦~我们会及时处理!
点击此处反馈


专栏目录
最低0.47元/天 解锁专栏
买1年送3月
百万级
高质量VIP文章无限畅学
千万级
优质资源任意下载
C知道
免费提问 ( 生成式Al产品 )