视差图转深度图提升工业检测:优化生产流程,赋能智能制造
发布时间: 2024-08-12 17:37:16 阅读量: 30 订阅数: 29 

视差图转深度图1
# 1. 视差图与深度图**
视差图和深度图是计算机视觉中用于表示三维场景的两种重要数据结构。视差图记录了场景中像素之间的视差,而深度图则表示场景中每个像素到相机的距离。
视差图和深度图之间的关系可以表示为:
```
depth = baseline * focal_length / disparity
```
其中:
- depth:深度值
- baseline:相机基线(两相机光心之间的距离)
- focal_length:相机焦距
- disparity:视差值
理解视差图和深度图之间的关系对于将视差图转换为深度图至关重要,这将是下一章讨论的重点。
# 2. 视差图转深度图的理论基础
### 2.1 立体视觉原理
立体视觉是一种利用两个或多个相机从不同角度拍摄同一场景,并通过计算视差来获取深度信息的视觉技术。其原理基于人类的双目视觉,当人类用两只眼睛观察同一物体时,由于两眼之间的视差,大脑会自动融合两幅图像,产生立体感。
### 2.2 视差计算方法
视差是同一场景中对应点在不同相机图像中的位置差异。计算视差的方法有多种,常见的有:
- **块匹配法:**将图像划分为小块,并通过搜索相邻图像中与当前块最相似的块来计算视差。
- **相位相关法:**利用图像的傅里叶变换,通过计算相位差来获得视差。
- **极线法:**假设场景中物体表面为平面,通过求解极线方程来计算视差。
### 2.3 深度图生成算法
视差图记录了场景中每个像素点的视差值,但需要进一步处理才能生成深度图。深度图表示场景中每个像素点的深度值,单位通常为米或毫米。生成深度图的算法主要有:
- **三角测量法:**根据视差图、相机内参和外参,通过三角测量计算深度值。
- **动态规划法:**利用视差图的平滑性,通过动态规划算法逐像素计算深度值。
- **神经网络法:**将视差图作为输入,通过训练神经网络来直接输出深度图。
```python
import numpy as np
import cv2
def stereo_match(left_image, right_image, window_size=5):
"""
使用块匹配法计算视差图。
参数:
left_image: 左目图像
right_image: 右目图像
window_size: 块匹配窗口大小
返回:
视差图
"""
# 转换为灰度图
left_gray = cv2.cvtColor(left_image, cv2.COLOR_BGR2GRAY)
right_gray = cv2.cvtColor(right_image, cv2.COLOR_BGR2GRAY)
# 初始化视差图
disparity_map = np.zeros(left_gray.shape, np.int16)
# 遍历每个像素
for i in range(left_gray.shape[0]):
for j in range(left_gray.shape[1]):
# 计算窗口内的最小平方误差
min_ssd = float('inf')
for offset in range(-window_size//2, window_size//2+1):
if j + offset < 0 or j + offset >= right_gray.shape[1]:
continue
ssd = np.sum((left_gray[i, j] - right_gray[i, j + offset])**2)
if ssd < min_ssd:
min_ssd = ssd
disparity_map[i, j] = offset
return disparity_map
```
**代码逻辑分析:**
该代码块实现了块匹配法计算视差图。它遍历左目图像的每个像素,并计算以当前像素为中心的窗口内,在右目图像中与当前像素最相似的像素的视差。相似性度量使用平方和误差(SSD)。
**参数说明:**
- `left_image`: 左目图像,类型为 NumPy 数组。
- `right_image`: 右目图像,类型为 NumPy 数组。
- `window_size`: 块匹配窗口大小,默认为 5。
# 3.1 OpenCV库在视差图转深度图中的应用
OpenCV(Open Source Computer Vision Library)是一个开源的计算机视觉库,提供了丰富的图像处理和计算机视觉算法。在视差图转深度图的应用中,OpenCV提供了多种实用的函数和算法。
**1. 视差计算**
OpenCV提供了`cv2.StereoBM`和`cv2.StereoSGBM`等函数,用于计算视差图。这些函数基于立体匹配算法,通过比较左右图像中的对应像素,计算出像素之间的视差值。
```python
import cv2
# 读取左右图像
left_image = cv2.imread("left.png")
right_image = cv2.imread("right.png")
# 初始化立体匹配算法
stereo = cv2.StereoBM_create()
# 计算视差图
disparity = stereo.compute(left_image, right_image)
```
**2. 深度图生成**
计算出视差图后,可以通过以下公式将视差图转换为深度图:
```
depth = baseline * focal_length / disparity
```
其中:
* `baseline`是左右摄像机的基线距离
* `focal_length`是摄像机的焦距
OpenCV提供了`cv2.reprojectImageTo3D`函数,可以根据视差图和相机参数生成深度图。
```python
# 获取相机参数
baseline = 0.1 # 单位:米
focal_length = 1000 # 单位:像素
# 生成深度图
depth = cv2.reprojectImageTo3D(disparity, Q, handleMissingValues=True)
```
**3. 优势**
使用OpenC

 百万级
高质量VIP文章无限畅学
百万级
高质量VIP文章无限畅学
 千万级
优质资源任意下载
千万级
优质资源任意下载
 C知道
免费提问 ( 生成式Al产品 )
C知道
免费提问 ( 生成式Al产品 )
0
0
相关推荐

专栏简介
**专栏简介**
本专栏深入探讨了视差图转深度图的原理、算法、挑战和应对策略,并提供了优化策略和开源工具。它涵盖了计算机视觉、机器人、增强现实、自动驾驶、精准医疗、遥感等领域的应用。专栏还分析了误差、并行化处理、GPU加速和深度学习应用,以提高精度、效率和智能化。通过揭示视差图转深度图的奥秘,本专栏旨在赋能3D视觉技术,推动其在各个领域的创新和发展。
专栏目录
最低0.47元/天 解锁专栏
买1年送3月
百万级
高质量VIP文章无限畅学
千万级
优质资源任意下载
C知道
免费提问 ( 生成式Al产品 )
最新推荐
爱普生R230打印机:废墨清零的终极指南,优化打印效果与性能

# 摘要
本文全面介绍了爱普生R230打印机的功能特性,重点阐述了废墨清零的技术理论基础及其操作流程。通过对废墨系统的深入探讨,文章揭示了废墨垫的作用限制和废墨计数器的工作逻辑,并强调了废墨清零对防止系统溢出和提升打印机性能的重要性。此外,本文还分享了提高打印效果的实践技巧,包括打印头校准、色彩管理以及高级打印设置的调整方法。文章最后讨论了打印机的维护策略和性能优化手段,以及在遇到打印问题时的故障排除
【Twig在Web开发中的革新应用】:不仅仅是模板

# 摘要
本文旨在全面介绍Twig模板引擎,包括其基础理论、高级功能、实战应用以及进阶开发技巧。首先,本文简要介绍了Twig的背景及其基础理论,包括核心概念如标签、过滤器和函数,以及数据结构和变量处理方式。接着,文章深入探讨了Twig的高级
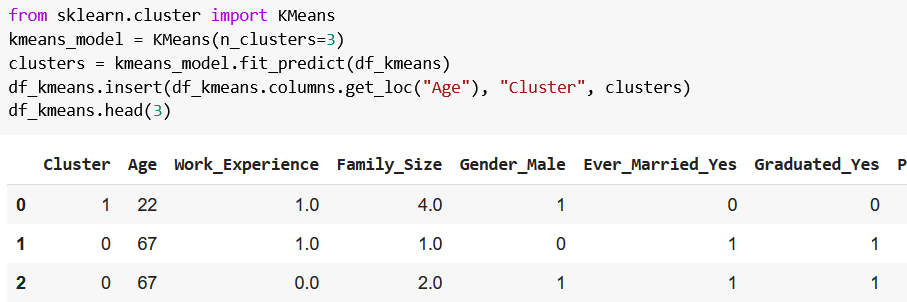
如何评估K-means聚类效果:专家解读轮廓系数等关键指标
# 摘要
K-means聚类算法是一种广泛应用的数据分析方法,本文详细探讨了K-means的基础知识及其聚类效果的评估方法。在分析了内部和外部指标的基础上,本文重点介绍了轮廓系数的计算方法和应用技巧,并通过案例研究展示了K-means算法在不同领域的实际应用效果。文章还对聚类效果的深度评估方法进行了探讨,包括簇间距离测量、稳定性测试以及高维数据聚类评估。最后,本
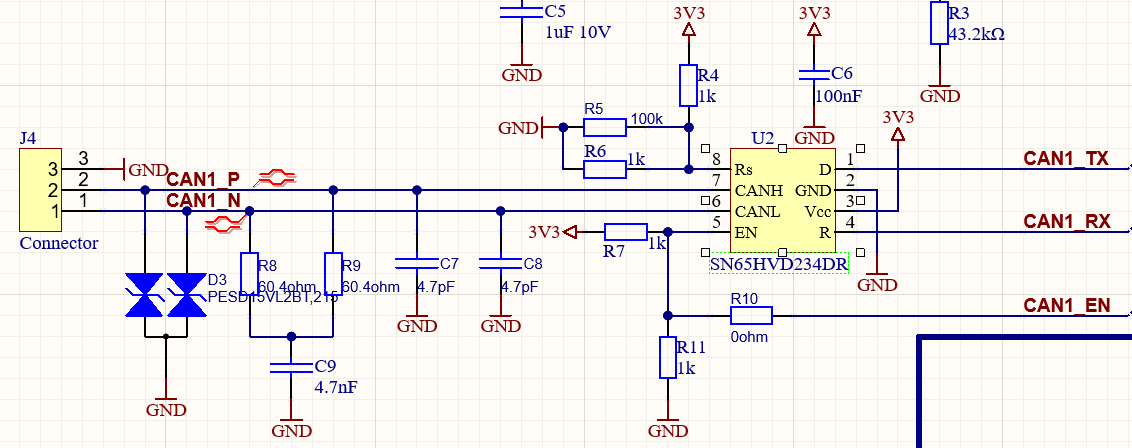
STM32 CAN寄存器深度解析:实现功能最大化与案例应用
# 摘要
本文对STM32 CAN总线技术进行了全面的探讨和分析,从基础的CAN控制器寄存器到复杂的通信功能实现及优化,并深入研究了其高级特性。首先介绍了STM32 CAN总线的基本概念和寄存器结构,随后详细讲解了CAN通信功能的配置、消息发送接收机制以及错误处理和性能优化策略。进一步,本文通过具体的案例分析,探讨了STM32在实时数据监控系统、智能车载网络通信以
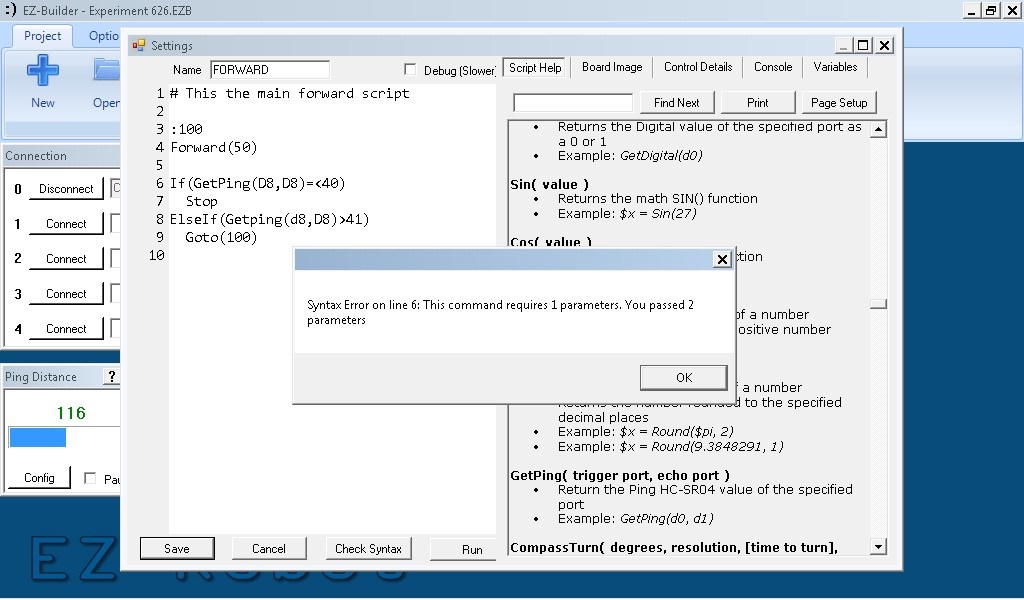
【GP错误处理宝典】:GP Systems Scripting Language常见问题与解决之道
# 摘要
GP Systems Scripting Language是一种为特定应用场景设计的脚本语言,它提供了一系列基础语法、数据结构以及内置函数和运算符,支持高效的数据处理和系统管理。本文全面介绍了GP脚本的基本概念、基础语法和数据结构,包括变量声明、数组与字典的操作和标准函数库。同时,详细探讨了流程控制与错误处理机制,如条件语句、循环结构和异常处
【电子元件精挑细选】:专业指南助你为降噪耳机挑选合适零件

# 摘要
随着个人音频设备技术的迅速发展,降噪耳机因其能够提供高质量的听觉体验而受到市场的广泛欢迎。本文从电子元件的角度出发,全面分析了降噪耳机的设计和应用。首先,我们探讨了影响降噪耳机性能的电子元件基础,包括声学元件、电源管理元件以及连接性与控制元
ARCGIS高手进阶:只需三步,高效创建1:10000分幅图!

# 摘要
本文深入探讨了ARCGIS环境下1:10000分幅图的创建与管理流程。首先,我们回顾了ARCGIS的基础知识和分幅图的理论基础,强调了1:10000比例尺的重要性以及地理信息处理中的坐标系统和转换方法。接着,详细阐述了分幅图的创建流程,包括数据的准备与导入、创建和编辑过程,以及输出格式和版本管理。文中还介绍了一些高级技巧,如自动化脚本的使用和空间分析,以
【数据质量保障】:Talend确保数据精准无误的六大秘诀
# 摘要
数据质量对于确保数据分析与决策的可靠性至关重要。本文探讨了Talend这一强大数据集成工具的基础和在数据质量管理中的高级应用。通过介绍Talend的核心概念、架构、以及它在数据治理、监控和报告中的功能,本文强调了Talend在数据清洗、转换、匹配、合并以及验证和校验等方面的实践应用。进一步地,文章分析了Talend在数据审计和自动化改进方面的高级功能,包括与机器学习技术的结合。最后,通过金融服务和医疗保健行业的案
【install4j跨平台部署秘籍】:一次编写,处处运行的终极指南

# 摘要
本文深入探讨了使用install4j工具进行跨平台应用程序部署的全过程。首先介绍了install4j的基本概念和跨平台部署的基础知识,接着详细阐述了其安装步骤、用户界面布局以及系统要求。在此基础上,文章进一步阐述了如何使用install4j创建具有高度定制性的安装程序,包括定义应用程序属性、配置行为和屏幕以及管理安装文件和目录。此外,本文还
【Quectel-CM AT命令集】:模块控制与状态监控的终极指南

# 摘要
本论文旨在全面介绍Quectel-CM模块及其AT命令集,为开发者提供深入的理解与实用指导。首先,概述Quectel-CM模块的基础知识与AT命令基础,接着详细解析基本通信、网络功能及模块配置命令。第三章专注于AT命令的实践应用,包括数据传输、状态监控
资源上传下载、课程学习等过程中有任何疑问或建议,欢迎提出宝贵意见哦~我们会及时处理!
点击此处反馈


专栏目录
最低0.47元/天 解锁专栏
买1年送3月
百万级
高质量VIP文章无限畅学
千万级
优质资源任意下载
C知道
免费提问 ( 生成式Al产品 )