没有合适的资源?快使用搜索试试~ 我知道了~
首页大数据在工程应用中的最新进展——《Big Data in Engineering Applications》
大数据在工程应用中的最新进展——《Big Data in Engineering Applications》
需积分: 9 2 下载量 16 浏览量
更新于2024-07-18
收藏 12.42MB PDF 举报
"Springer《大数据在工程应用》系列书籍《Studies in Big Data》第44卷,由Sanjiban Sekhar Roy、Pijush Samui、Ravinesh Deo和Stavros Ntalampiras四位编辑共同编撰,由Janusz Kacprzyk担任系列编辑,隶属于波兰科学院,位于华沙。该系列旨在快速发布大数据领域的最新进展和创新,涵盖了大数据理论、研究、开发和应用,尤其与工程、计算机科学、物理学、经济学和生命科学等领域紧密相关。 书中的重点在于深入剖析大型、复杂和/或分布式数据集,这些数据来自各种数字化源头,包括传感器、物理仪器测量、模拟实验、众包、社交网络以及互联网交易产生的数据,如电子邮件和视频点击流等。系列内容丰富多样,包括计算智能方面的专题,如神经网络、进化计算、软计算和模糊系统等。 《Studies in Big Data》第44卷强调了对大规模数据进行分析和理解的重要性,如何通过高效处理和挖掘这些海量信息,推动工程实践和技术进步。每一本书都力求提供深度洞察,为研究人员、工程师和企业家提供了理解和利用大数据解决实际问题的平台。此外,该系列也适合研究生和专业人士作为参考教材,以跟踪并掌握最新的大数据发展趋势。"
资源详情
资源推荐
P
c
:=
x
c
w
,
y
c
l
∈ 0, 1½
2
, with c
w
: = coil width and c
l
: = coil length. ð3Þ
Consequently, the reachable synchronization accuracy can be calculated
dependent on the coil c, the coil dimensions c
w
, c
l
and the resolution stage s ∈ 0, 8½
as
Δx
c, s
=
c
w
s
resp Δy
c, s
=
c
l
s
ð4Þ
Some exemplary values for Δx
c, s
and Δy
c, s
are also given in Table 2.
Once each coil position is normalized, the transformation of point-based raw
data into the grid structure can be performed quite easy by simple cell-based
aggregation of all measurements falling into one specific grid cell. Regarding 1D
and 2D continuous measurements, the aggregations stored in the grid structure are
minimum, maximum, mean and count of the measuring values. Event-based data
(like surface defects) are usually stored as recta ngular regions combined with a
certain identifier describing the type of the event (e.g. defect class) and can either be
aggregated as absolute counts per grid cell or overlapping area relative to the full
cell area.
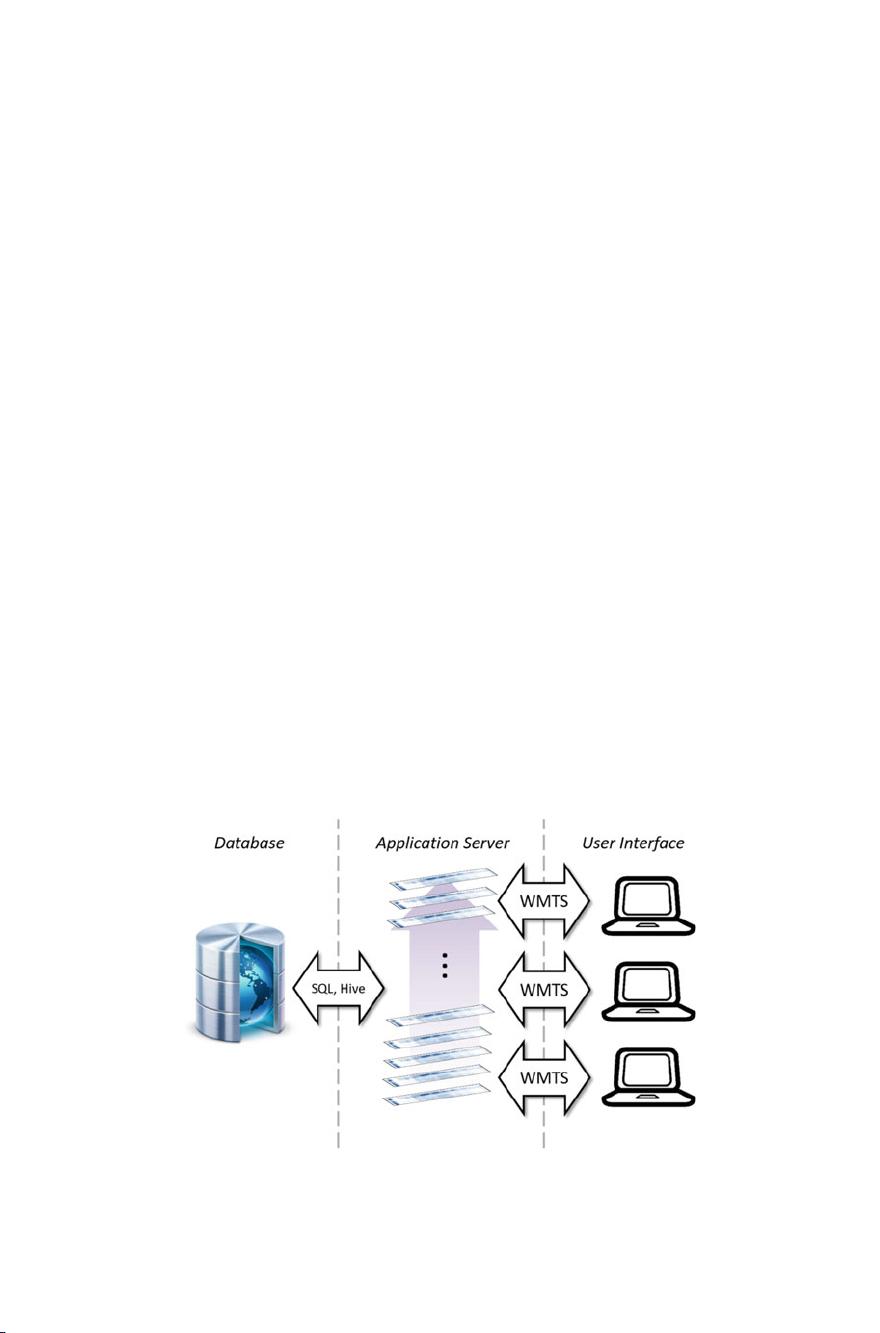
Given this multi-grid data representation, the question remains how to enable the
combination of data across production stages. This again can be easily solved by
not only simulta neous storage of data across different resolutions, but also across
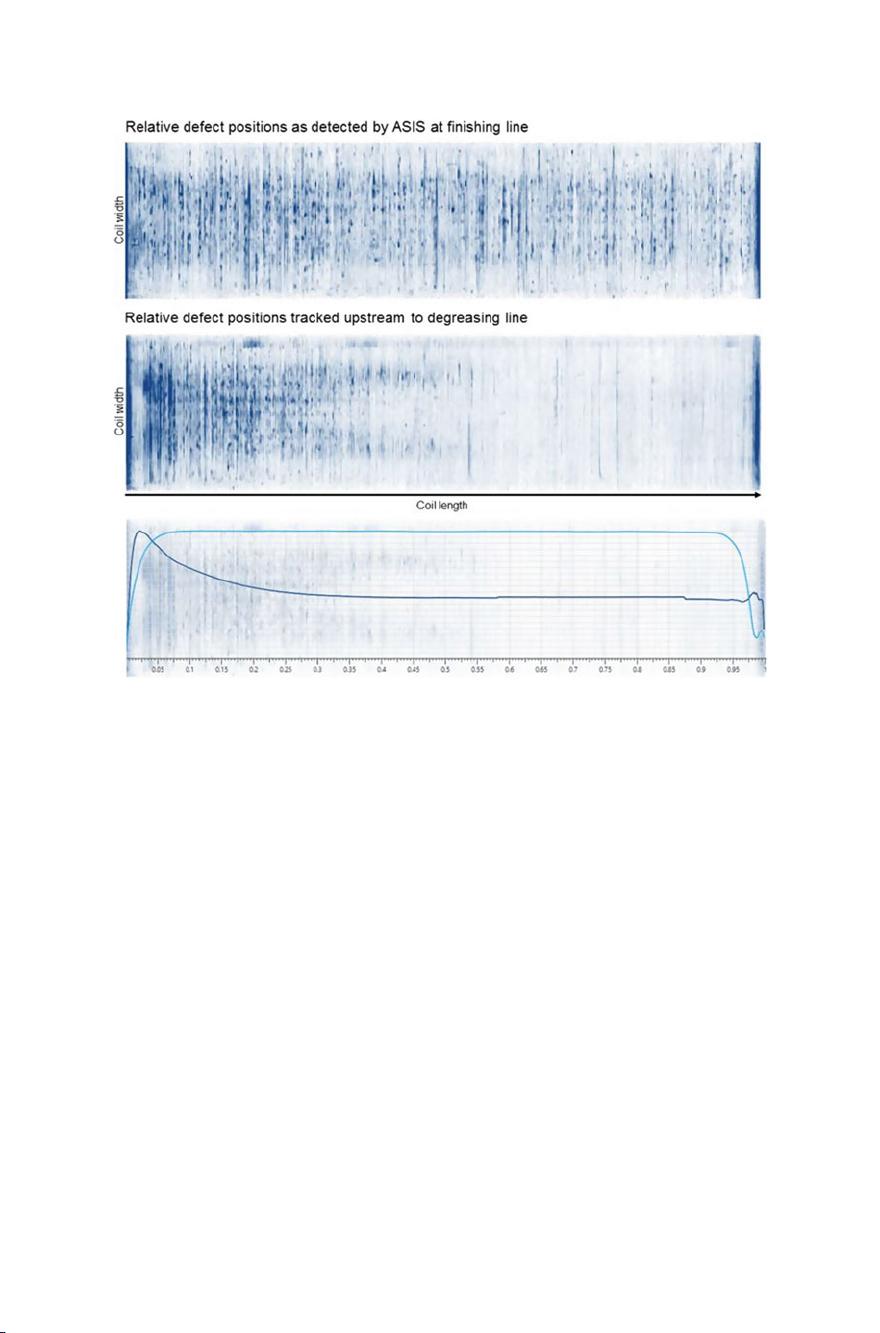
different perspectives. Assumed that the information about all coil transform ations
is given during data transformation, the data can be tracked upstream and/or
downstream and further grid data can be created and stored for each measurement
from the perspective of other production steps. The data is stored for each plant
separately according to the available material tracking information. Thus, the data is
available simultaneously in different plant coordinates enab ling fast HR data access
by means of redundant data storage.
Table 2 Grid definitions and exemplary sizes of grid cells for a coil length of 7500 m and a coil
width of 1500 mm
Stage Tiles CD Tiles MD Δx
c, s
(c
w
: = 1500 mm) (mm)
Δy
c, s
(c
l
: = 7500 m) (m)
0 1 2 1500 3750
1 2 4 750 1875
2 4 8 375 937.5
3 8 16 187.5 468.75
4 16 32 93.75 234.38
5 32 64 46.88 117.19
6 64 128 23.44 58.59
7 128 256 11.72 29.3
8 256 512 5.86 14.65
Applying Big Data Concepts to Improve Flat Steel … 9
Finally, to analyse production data and find causes of quality problems it is
essential to be able to filter data according to different production parameters, like
material, thickness, production period, etc. Thus, further filter conditions have to be
added to each grid entry of the same HR-type (see Fig. 4) to keep filter capabilities
of the data representation. The grid attributes finally stored can be classified into
five different categories:
• Coil Filter—Unique coil identifier that allows filtering grid entries by coil
attributes like material type, thickness, process parameters, etc.
• Identifier—Unique grid cell identifier needed for fast aggregation (Stage,
TileID)
• Sub Filter—Further type specific filter conditions (defect class, measuring
device, etc.)
• Data—Per grid cell aggregated measuring data (min, max, mean, count)
This production data model is able to synchronize and aggregate HR data of
different kind from different perspectives very fast. Therefore, it acts as a kind of
database index on the available HR raw data supporting dedicated querying of grid
data.
4 Implementation
The production data model described above was implemented as classical three-tier
architecture as shown in Fig. 5. This architecture has the benefit that it separates
presentation, application proces sing, and data management functionality.
Fig. 5 Schema for HR data access
10 J. Brandenburger et al.
At the bottom of this architecture, a database management system (DBMS)
implements the HR-data model. In this approach, it is not relevant if the database is
a standard RDBMS or a Hadoop cluster. The application server has to cope with it
and use the correct query syntax to provide the desired grid data by means of
parallel querying the employed database. On top of this architecture, a browser
application communicates with the application server following a unified
web-service definition that is based on the Web-Map-Tile-Service (WMTS) stan-
dard provided by the Open-Geospatial Consortium [13]. In the implemented setup
the querying of the data follows a two-step approach:
1. Query all coils meeting certain filter conditions applied by the user
2. Query grid data according to the selected coils
The resulting grid data can be provided either aggregated (for visualisation) or
per-piece (for cause-and-effect analysis). If material tracking should be considered
one important detail of the final implementation is, that each coil queried in the first
step knows its own production history. This allows switching the viewpoint to
another process step without re-querying the selected coil-set. Furthermore, it is
possible to select only coils that where processed at a certain line being another
important aspect when searching for quality problem causes. For further details on
the web-service definition, please refer to [14].
5 Application
To proof the usability of the architecture depicted in Fig. 5 it was finally imple-
mented at two industrial sites. The production data was transformed to grid data and
continuously imported in the HR data model. Based on the available data a solution
for the fast data visualisation was realized supporting instant-interactive data
analysis and a solution for refined cause-and-effect analysis was implemented.
5.1 Visualisation
The system implemented at thyssenkrupp Rasselstein GmbH finally involved
1137 HR-measurements from 24 main aggregates of the complete tinplate pro-
duction chain together with the full material tracking information. This includes
data from the hot strip mill to the finishi ng lines at the end of the production. As
database, an MS SQL Server 2012 has been chosen with a capacity of 20 TB being
sufficient to cover approx. 1 year of full production grid data.
It was necessary to put a lot of effort in the implementation of the import services
to be able to store the available HR data to the server without flooding. Extensive
use of methods like bulk inserts, parallel processing and index-free temporary tables
Applying Big Data Concepts to Improve Flat Steel … 11
were required to finally achieve ‘coil-realtime’, meaning that the time required for
data storage can follow the production. It can be reasonable assumed that this will
be no issue using a database system dedicated to Big-Data processing. On the other
hand, it has to be investigated if the query performance of such a system can be
competitive with the index structures provided by the standard RDBMS.
Figure 6 shows a performance statistic over two months of system usage. In this
period the median response time of the system, providing defect data was 215 ms.
This response time refers to the first visualisation of the lowest resolution stage
queried. The querying process was implemented by means of parallel SQL-queries
for 8 equally sized full width stripes distributed over the full coil length. In this trial
the multi-scale visualisation started with stage 2 and refined over stage 6 before
finally stage 8 results were presented.
On average (median) the browser application was able to provide the full res-
olution defect data to the user (8 stripes at stage 8 resolution) in less than 1.5 s.
Furthermore, it can be seen that the usage of the system in the testing period was
mainly focused on the analysis of 1D and event-based data, whereas 2D-continuous
data played only a minor role.
5.1.1 Paw-Scratch Example
The following example clearly demonstrates the benefit of the developed solution
as it show s how a quality problem could be successfully solved using the interactive
visualisation solution presented in this chapter. The quality problem investigated
was the so-called ‘ paw-scratch’—defect that often looks like a paw print of an
animal. This defect is well detected by ASIS and can be classified very reliable by
using context information in post-processing rules [9]. Thus, it is a good choice for
Fig. 6 Performance statistics of HR server over 2 months usage
12 J. Brandenburger et al.
a detailed ASIS data analysis as no manual data verification is required [15]. The
investigation started with the analysis of paw-scratch defects as detected by an
ASIS installed at the finishing line. The visualisation on top of Fig. 7 shows the
distribution of this type of defect over a set of more than 2000 coils affected by this
defect and combines more than 500.000 single defects in one image. Herein the
most blue grid positions represent more than 500 single paw-scratch detections.
The picture in the middle of Fig. 7 shows the same result as the top picture after
each single ASIS result of each individual coil has been tracked to one of the two
degreasing lines located at the thyssenkrupp site in Andernach. In this case, a
characteristic distribution of the pa w-scratch defects becomes visible and it appears
that significant more paw-scratches were located at the beginning of the coils.
This example impressively shows what happens if no tracking information is
considered for data analysis. Due to the individual coil transformations as described
in Sect. 2.2, the characteristic defect distribution at the causative line gets com-
pletely lost throughout the production chain. Thus, in this case no reasonable
Fig. 7 Relative defect positions of paw-scratch defects at the finishing (top) and tracked to the
degreasing line (middle). Bottom: in-coil aggregated mean values of related process variables
(light: line speed, dark: strip tension)
Applying Big Data Concepts to Improve Flat Steel … 13
剩余380页未读,继续阅读
寒沧
- 粉丝: 271
- 资源: 161
上传资源 快速赚钱
- 我的内容管理 展开
- 我的资源 快来上传第一个资源
- 我的收益 登录查看自己的收益
- 我的积分 登录查看自己的积分
- 我的C币 登录后查看C币余额
- 我的收藏
- 我的下载
- 下载帮助
最新资源
- AirKiss技术详解:无线传递信息与智能家居连接
- Hibernate主键生成策略详解
- 操作系统实验:位示图法管理磁盘空闲空间
- JSON详解:数据交换的主流格式
- Win7安装Ubuntu双系统详细指南
- FPGA内部结构与工作原理探索
- 信用评分模型解析:WOE、IV与ROC
- 使用LVS+Keepalived构建高可用负载均衡集群
- 微信小程序驱动餐饮与服装业创新转型:便捷管理与低成本优势
- 机器学习入门指南:从基础到进阶
- 解决Win7 IIS配置错误500.22与0x80070032
- SQL-DFS:优化HDFS小文件存储的解决方案
- Hadoop、Hbase、Spark环境部署与主机配置详解
- Kisso:加密会话Cookie实现的单点登录SSO
- OpenCV读取与拼接多幅图像教程
- QT实战:轻松生成与解析JSON数据
资源上传下载、课程学习等过程中有任何疑问或建议,欢迎提出宝贵意见哦~我们会及时处理!
点击此处反馈
安全验证
文档复制为VIP权益,开通VIP直接复制
信息提交成功