深入监督学习:过拟合与欠拟合的识别与处理策略
发布时间: 2024-09-02 08:19:06 阅读量: 147 订阅数: 64 
# 1. 监督学习的基本概念
监督学习是机器学习中的一个重要分支,它涉及从带有标签的训练数据中学习一个模型,以便对新的、未见过的数据进行预测。在这一章节中,我们将初步探索监督学习的核心概念,包括标签、特征、模型以及预测等基本术语。
## 监督学习的基本原理
监督学习通常以分类和回归两种任务形式出现。在分类任务中,预测的目标是离散的标签,例如垃圾邮件检测中的“垃圾”或“非垃圾”。而在回归任务中,预测的目标是连续值,比如房价预测中的具体价格数值。
## 监督学习的数据结构
监督学习依赖于标注过的数据集,这些数据集包含输入特征(特征向量)和与之对应的输出标签。数据的质量和数量直接影响学习模型的性能。
## 监督学习的模型训练与预测
在模型训练阶段,我们使用算法对数据进行拟合,形成从输入到输出的映射关系。在预测阶段,新数据被输入模型中以得到输出结果。
通过理解这些基础知识,我们可以更好地进入后续章节,探讨如何解决监督学习中的过拟合与欠拟合问题,以及相关的预防策略和实际应用案例。
# 2. 过拟合与欠拟合的理论基础
### 2.1 监督学习中的模型复杂度
在监督学习中,模型的复杂度是影响其性能的关键因素之一。模型复杂度与模型的泛化能力紧密相关,合理选择模型复杂度是确保学习任务成功的重要环节。
#### 2.1.1 模型复杂度与泛化能力
模型复杂度可以理解为模型对数据复杂结构的捕捉能力,它主要受到模型结构的复杂性、参数的数量以及特征空间维度的影响。一般而言,一个模型的复杂度越高,其对训练数据的拟合能力越强,但这也可能带来泛化能力的下降。
**复杂度高**:如果模型过于复杂,模型可能不仅仅捕捉到了数据中的真实关系,还可能捕获了数据的噪声和异常值,这就是过拟合现象。过拟合的模型在训练数据上表现很好,但在未见数据上的表现会大打折扣。
**复杂度低**:相对的,如果模型过于简单,它可能无法充分捕捉数据中蕴含的复杂关系,即欠拟合现象。欠拟合的模型在训练数据上和未见数据上表现都不理想。
#### 2.1.2 过拟合与欠拟合的定义及其影响
过拟合和欠拟合是监督学习中经常遇到的两个主要问题。它们在不同程度上影响了模型的泛化能力。
**过拟合**:当一个模型过度学习了训练数据的特征,包括噪声和不重要的特征,而不能很好地推广到新的数据时,就发生了过拟合。过拟合的模型在训练集上的表现通常远好于测试集,表现为训练误差小而测试误差大。
**欠拟合**:相反,如果模型过于简单,无法捕捉数据的真实规律,使得模型在训练集和测试集上的表现都不理想,这种情况称为欠拟合。
### 2.2 过拟合与欠拟合的识别方法
有效识别过拟合和欠拟合是模型优化的第一步,以下是一些常用的识别方法。
#### 2.2.1 训练集与测试集表现差异分析
在机器学习中,通常将数据集分为训练集和测试集两部分。通过比较模型在训练集和测试集上的表现,可以直观地判断模型是否存在过拟合或欠拟合。
如果训练集上的表现明显优于测试集,可能发生了过拟合。相反,如果训练集和测试集上的表现都较差,可能是模型过于简单,发生了欠拟合。
```python
# 示例代码:使用scikit-learn评估模型
from sklearn.datasets import load_iris
from sklearn.model_selection import train_test_split
from sklearn.ensemble import RandomForestClassifier
from sklearn.metrics import accuracy_score
# 加载数据集
iris = load_iris()
X, y = iris.data, iris.target
# 分割数据集
X_train, X_test, y_train, y_test = train_test_split(X, y, test_size=0.3, random_state=42)
# 创建随机森林分类器
clf = RandomForestClassifier(n_estimators=100)
# 训练模型
clf.fit(X_train, y_train)
# 预测训练集和测试集
y_train_pred = clf.predict(X_train)
y_test_pred = clf.predict(X_test)
# 计算准确率
train_acc = accuracy_score(y_train, y_train_pred)
test_acc = accuracy_score(y_test, y_test_pred)
print(f"Train Accuracy: {train_acc:.2f}")
print(f"Test Accuracy: {test_acc:.2f}")
```
#### 2.2.2 学习曲线的绘制与解读
学习曲线是在不同的训练集大小下模型性能(通常是训练误差和测试误差)的图表展示。通过绘制学习曲线,可以更直观地理解模型是否过拟合或欠拟合。
如果模型过拟合,学习曲线会显示在训练集上误差较小,而在测试集上误差较大。如果模型欠拟合,学习曲线则会显示在训练集和测试集上的误差都较大。
```python
# 示例代码:绘制学习曲线
from sklearn.model_selection import learning_curve
import matplotlib.pyplot as plt
import numpy as np
def plot_learning_curve(estimator, X, y, title="Learning Curve", ylim=None, cv=None, n_jobs=None, train_sizes=np.linspace(.1, 1.0, 5)):
plt.figure()
plt.title(title)
if ylim is not None:
plt.ylim(*ylim)
plt.xlabel("Training examples")
plt.ylabel("Score")
train_sizes, train_scores, test_scores = learning_curve(
estimator, X, y, cv=cv, n_jobs=n_jobs, train_sizes=train_sizes)
train_scores_mean = np.mean(train_scores, axis=1)
test_scores_mean = np.mean(test_scores, axis=1)
plt.grid()
plt.plot(train_sizes, train_scores_mean, 'o-', color="r", label="Training score")
plt.plot(train_sizes, test_scores_mean, 'o-', color="g", label="Cross-validation score")
plt.legend(loc="best")
return plt
plot_learning_curve(clf, X, y, cv=10)
plt.show()
```
#### 2.2.3 正则化项的分析与应用
正则化是解决过拟合问题的常用技术之一。它通过对模型的复杂度进行惩罚,以期降低过拟合的风险。
在机器学习中,常见的正则化项有L1和L2正则化。L1正则化倾向于产生稀疏的权重矩阵,而L2正则化则倾向于降低权重值的大小,使权重分布更加平滑。
```python
# 示例代码:在scikit-learn中应用L2正则化
from sklearn.linear_model import RidgeClassifier
# 创建岭回归分类器(L2正则化)
ridge_clf = RidgeClassifier(alpha=1.0)
# 训练模型并绘制学习曲线
plot_learning_curve(ridge_clf, X, y, cv=10)
plt.show()
```
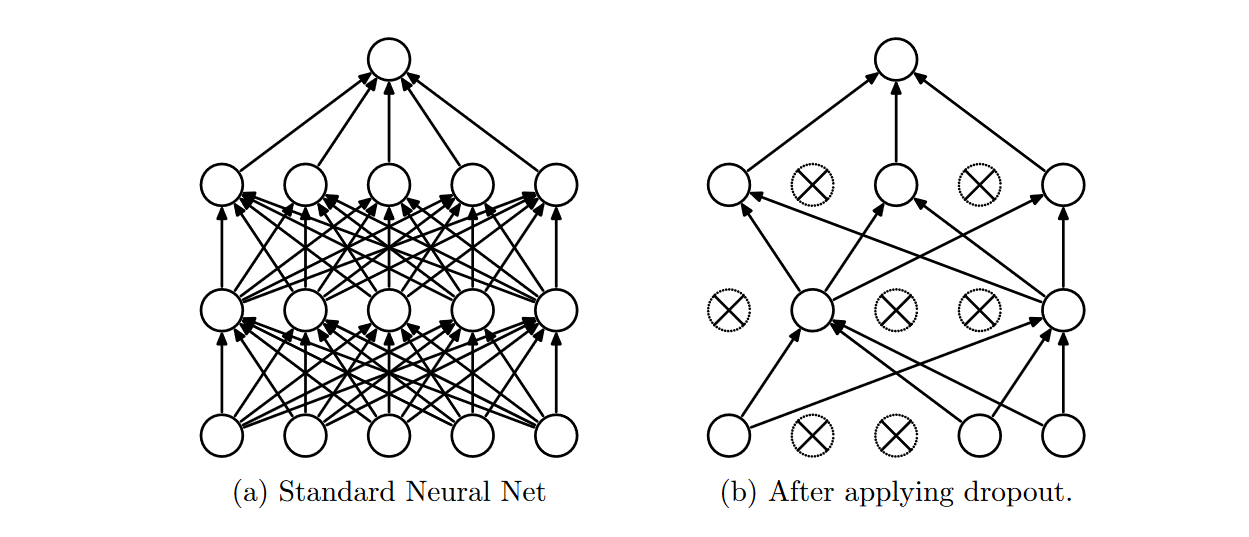
以上内容介绍了模型复杂度和过拟合、欠拟合的基本概念,识别方法以及正则化项的应用。在下一节中,我们将深入探讨预防过拟合与欠拟合的具体策略,包括数据增强、模型选择和优化,以及Dropout等技术的应用。
# 3. 预防过拟合与欠拟合的策略
## 3.1 数据增强与预处理
### 3.1.1 数据增强技术的应用
数据增强是机器学习领域中用于提高模型泛化能力的常用技术,尤其在图像和语音识别等领域,数据增强可以极大地增加样本的多样性,从而减少过拟合现象的发生。
数据增强技术的核心思想是通过对原始数据进行一系列变换来人工扩大数据集,这些变换包括但不限于旋转、缩放、裁剪、颜色变换、添加噪声、时间反转等。以图像数据为例,简单的旋转和翻转可以增加数据的多样性,使得模型不易记住特定的、不变的样本特征,而是学习到更为泛化的特征。
在代码层面上,数据增强可以通过各种图像处理库如Pillow或OpenCV实现。例如,使用Pillow库对图像进行随机旋转的Python代码片段如下:
```python
from PIL import Image, ImageEnhance
import random
def augment_image(image_path):
# 加载图像
img = Image.open(image_path)
# 随机旋转
angle = random.randint(-30, 30)
img = img.rotate(angle)
# 可以继续添加其他增强操作,如裁剪、缩放等
return img
```
在实际应用中,数据增强的策略选择应根据问题的特定需求而定。例如,在医学图像处理中,由于图像的特性,可能不会使用太激进的增强方式,而在自然图像处理中,则可以尝试更丰富的变换。
### 3.1.2 特征选择与降维方法
特征选择和降维是另一种预防过拟合的常用技术。通过移除冗余或无关的特征,可以减少模型学习过程中的噪声和方差,从而提高泛化能力。
特征选择通常有三种策略:过滤法、包装法和嵌入法。
- **过滤法**(Filter):使用统计测试对每个特征与标签之间的关系进行评估,根据得分排序特征,并选择顶部的特征。这种方法计算效率高,但可能忽略特征之间的相互作用。
```python
import numpy as np
from sklearn.feature_selection import SelectKBest, f_classif
def select_features_by_filter(X, y):
# 使用方差分析F检验选择特征
selector = Se
```

 百万级
高质量VIP文章无限畅学
百万级
高质量VIP文章无限畅学
 千万级
优质资源任意下载
千万级
优质资源任意下载
 C知道
免费提问 ( 生成式Al产品 )
C知道
免费提问 ( 生成式Al产品 )
0
0
相关推荐

专栏简介
本专栏深入探讨了监督学习和无监督学习这两大机器学习范式之间的差异。它涵盖了从基础概念到高级技术的广泛主题。对于初学者来说,本专栏提供了构建分类模型和探索隐藏模式的入门指南。对于经验丰富的从业者来说,它提供了识别和处理过拟合和欠拟合的策略,以及优化聚类算法和特征工程的技巧。此外,本专栏还深入研究了监督学习在实际问题中的应用,以及无监督学习在异常检测和数据降维中的作用。通过案例研究、算法选择指南和性能评估技巧,本专栏为读者提供了在机器学习领域取得成功的全面指南。
专栏目录
最低0.47元/天 解锁专栏
买1年送3月
百万级
高质量VIP文章无限畅学
千万级
优质资源任意下载
C知道
免费提问 ( 生成式Al产品 )
最新推荐
实战技巧:如何使用MAE作为模型评估标准
# 1. 模型评估标准MAE概述
在机器学习与数据分析的实践中,模型的评估标准是确保模型质量和可靠性的关键。MAE(Mean Absolute Error,平均绝对误差)作为一种常用的评估指标,其核心在于衡量模型预测值与真实值之间差异的绝对值的平均数。相比其他指标,MAE因其直观、易于理解和计算的特点,在不同的应用场景中广受欢迎。在本章中,我们将对MAE的基本概念进行介绍,并探讨其在模型评估
图像融合技术实战:从理论到应用的全面教程
# 1. 图像融合技术概述
随着信息技术的快速发展,图像融合技术已成为计算机视觉、遥感、医学成像等多个领域关注的焦点。**图像融合**,简单来说,就是将来自不同传感器或同一传感器在不同时间、不同条件下的图像数据,经过处理后得到一个新的综合信息。其核心目标是实现信息的有效集成,优化图像的视觉效果,增强图像信息的解释能力或改善特定任务的性能。
从应用层面来看,图像融合技术主要分为三类:**像素级**融合,直接对图
【图像分类模型自动化部署】:从训练到生产的流程指南
# 1. 图像分类模型自动化部署概述
在当今数据驱动的世界中,图像分类模型已经成为多个领域不可或缺的一部分,包括但不限于医疗成像、自动驾驶和安全监控。然而,手动部署和维护这些模型不仅耗时而且容易出错。随着机器学习技术的发展,自动化部署成为了加速模型从开发到生产的有效途径,从而缩短产品上市时间并提高模型的性能和可靠性。
本章旨在为读者提供自动化部署图像分类模型的基本概念和流程概览,
【误差度量方法比较】:均方误差与其他误差度量的全面比较
# 1. 误差度量方法的基本概念
误差度量是评估模型预测准确性的关键手段。在数据科学与机器学习领域中,我们常常需要借助不同的指标来衡量预测值与真实值之间的差异大小,而误差度量方法就是用于量化这种差异的技术。理解误差度量的基本概念对于选择合适的评估模型至关重要。本章将介绍误差度量方法的基础知识,包括误差类型、度量原则和它们在不同场景下的适用性。
## 1.1 误差度量的重要性
在数据分析和模型训
跨平台推荐系统:实现多设备数据协同的解决方案

# 1. 跨平台推荐系统概述
## 1.1 推荐系统的演变与发展
推荐系统的发展是随着互联网内容的爆炸性增长和用户个性化需求的提升而不断演进的。最初,推荐系统主要基于规则来实现,而后随着数据量的增加和技术的进步,推荐系统转向以数据驱动为主,使用复杂的算法模型来分析用户行为并预测偏好。如今,跨平台推荐系统正逐渐成为研究和应用的热点,旨
优化之道:时间序列预测中的时间复杂度与模型调优技巧
# 1. 时间序列预测概述
在进行数据分析和预测时,时间序列预测作为一种重要的技术,广泛应用于经济、气象、工业控制、生物信息等领域。时间序列预测是通过分析历史时间点上的数据,以推断未来的数据走向。这种预测方法在决策支持系统中占据着不可替代的地位,因为通过它能够揭示数据随时间变化的规律性,为科学决策提供依据。
时间序列预测的准确性受到多种因素的影响,例如数据
NLP数据增强神技:提高模型鲁棒性的六大绝招

# 1. NLP数据增强的必要性
自然语言处理(NLP)是一个高度依赖数据的领域,高质量的数据是训练高效模型的基础。由于真实世界的语言数据往往是有限且不均匀分布的,数据增强就成为了提升模型鲁棒性的重要手段。在这一章中,我们将探讨NLP数据增强的必要性,以及它如何帮助我们克服数据稀疏性和偏差等问题,进一步推
硬件加速在目标检测中的应用:FPGA vs. GPU的性能对比
# 1. 目标检测技术与硬件加速概述
目标检测技术是计算机视觉领域的一项核心技术,它能够识别图像中的感兴趣物体,并对其进行分类与定位。这一过程通常涉及到复杂的算法和大量的计算资源,因此硬件加速成为了提升目标检测性能的关键技术手段。本章将深入探讨目标检测的基本原理,以及硬件加速,特别是FPGA和GPU在目标检测中的作用与优势。
## 1.1 目标检测技术的演进与重要性
目标检测技术的发展与深度学习的兴起紧密相关
TensorFlow核心组件全掌握:打造你的深度学习专家级技能
# 1. TensorFlow简介与安装配置
## 1.1 TensorFlow的起源与特性
TensorFlow是由Google Brain团队开发的开源机器学习框架。它设计用于实现高度可扩展的深度学习算法。TensorFlow的特点包括跨平台支持、可扩展性和灵活性。其核心API设计简洁,允许快速实现各种复杂模型。此外,TensorFl
【商业化语音识别】:技术挑战与机遇并存的市场前景分析
# 1. 商业化语音识别概述
语音识别技术作为人工智能的一个重要分支,近年来随着技术的不断进步和应用的扩展,已成为商业化领域的一大热点。在本章节,我们将从商业化语音识别的基本概念出发,探索其在商业环境中的实际应用,以及如何通过提升识别精度、扩展应用场景来增强用户体验和市场竞争力。
## 1.1 语音识别技术的兴起背景
语音识别技术将人类的语音信号转化为可被机器理解的文本信息,它
资源上传下载、课程学习等过程中有任何疑问或建议,欢迎提出宝贵意见哦~我们会及时处理!
点击此处反馈


专栏目录
最低0.47元/天 解锁专栏
买1年送3月
百万级
高质量VIP文章无限畅学
千万级
优质资源任意下载
C知道
免费提问 ( 生成式Al产品 )