功率谱图解:直观解读信号频率特性,轻松掌握信号频率分布
发布时间: 2024-07-10 03:48:26 阅读量: 103 订阅数: 48 

# 1. 功率谱图的理论基础
功率谱图是一种强大的工具,用于分析信号的频率成分。它基于傅里叶变换,将时域信号转换为频域信号,揭示信号中存在的频率和幅度信息。
频域信号的幅度平方代表了信号在特定频率下的功率。功率谱图是功率随频率变化的图形表示,它提供了信号中不同频率成分的分布情况。通过分析功率谱图,可以识别信号的特征频率,确定谐波成分,并检测噪声和故障。
# 2. 功率谱图的计算方法
### 2.1 时域信号与频域信号的转换
#### 2.1.1 傅里叶变换
傅里叶变换是一种将时域信号转换为频域信号的数学工具。它将一个时变函数分解为一系列正弦波和余弦波,每个波都有特定的频率和幅度。
**傅里叶变换公式:**
```
X(f) = ∫_{-\infty}^{\infty} x(t) e^(-2πift) dt
```
其中:
* `X(f)` 是频域信号
* `x(t)` 是时域信号
* `f` 是频率
**代码示例:**
```python
import numpy as np
import matplotlib.pyplot as plt
# 定义时域信号
t = np.linspace(0, 1, 1000)
x = np.sin(2 * np.pi * 10 * t) + np.sin(2 * np.pi * 20 * t)
# 计算傅里叶变换
X = np.fft.fft(x)
# 绘制频谱图
plt.plot(np.abs(X))
plt.xlabel('Frequency (Hz)')
plt.ylabel('Amplitude')
plt.title('傅里叶变换频谱图')
plt.show()
```
**逻辑分析:**
* `np.fft.fft(x)` 函数执行傅里叶变换,将时域信号 `x` 转换为频域信号 `X`。
* `np.abs(X)` 计算 `X` 的绝对值,得到功率谱。
* `plt.plot(np.abs(X))` 绘制功率谱图,显示信号的频率成分。
#### 2.1.2 快速傅里叶变换(FFT)
快速傅里叶变换(FFT)是一种高效的算法,用于计算傅里叶变换。它通过将信号分解为较小的块并使用递归算法来减少计算量。
**代码示例:**
```python
import numpy as np
import matplotlib.pyplot as plt
# 定义时域信号
t = np.linspace(0, 1, 1000)
x = np.sin(2 * np.pi * 10 * t) + np.sin(2 * np.pi * 20 * t)
# 计算FFT
X = np.fft.fft(x)
# 绘制频谱图
plt.plot(np.abs(X))
plt.xlabel('Frequency (Hz)')
plt.ylabel('Amplitude')
plt.title('FFT频谱图')
plt.show()
```
**逻辑分析:**
* `np.fft.fft(x)` 函数执行FFT,将时域信号 `x` 转换为频域信号 `X`。
* `np.abs(X)` 计算 `X` 的绝对值,得到功率谱。
* `plt.plot(np.abs(X))` 绘制功率谱图,显示信号的频率成分。
### 2.2 功率谱图的计算步骤
#### 2.2.1 信号采样和窗函数
在计算功率谱图之前,需要对信号进行采样和窗函数处理。采样将连续信号转换为离散信号,而窗函数则用于减少傅里叶变换中产生的频谱泄漏。
**代码示例:**
```python
import numpy as np
import scipy.signal as signal
# 定义时域信号
t = np.linspace(0, 1, 1000)
x = np.sin(2 * np.pi * 10 * t) + np.sin(2 * np.pi * 20 * t)
# 采样率
fs = 1000
# 窗函数
window = signal.hamming(len(x))
# 应用窗函数
x_windowed = x * window
```
**逻辑分析:**
* `signal.hamming(len(x))` 函数生成一个汉明窗函数,其长度与信号 `x` 相同。
* `x_windowed = x * window` 将窗函数应用于信号 `x`,以减少频谱泄漏。
#### 2.2.2 傅里叶变换和功率谱计算
一旦信号被采样和窗函数处理,就可以使用傅里叶变换计算功率谱图。
**代码示例:**
```python
import numpy as n
```

 百万级
高质量VIP文章无限畅学
百万级
高质量VIP文章无限畅学
 千万级
优质资源任意下载
千万级
优质资源任意下载
 C知道
免费提问 ( 生成式Al产品 )
C知道
免费提问 ( 生成式Al产品 )
0
0
相关推荐

专栏简介
“功率谱”专栏深入探究功率谱分析在信号处理中的重要作用。从小白到大师,全面掌握信号频率的奥秘。深入剖析信号频率成分,解锁信号处理新境界。揭示信号能量分布的秘密,掌握信号能量分布规律。从理论到实践,掌握功率谱估计的奥秘。直观解读信号频率特性,轻松掌握信号频率分布。探索功率谱的广泛应用场景,从通信到生物医学。揭示功率谱与相关函数、统计分析、谱估计、信号处理、时频分析、噪声分析、故障诊断、振动分析、图像处理、雷达信号处理、语音信号处理、生物医学信号处理、通信信号处理、控制系统分析之间的紧密联系。通过深入浅出的讲解和丰富的案例分析,专栏旨在帮助读者全面掌握功率谱分析,提升信号处理技能,解决实际问题。
专栏目录
最低0.47元/天 解锁专栏
买1年送3月
百万级
高质量VIP文章无限畅学
千万级
优质资源任意下载
C知道
免费提问 ( 生成式Al产品 )
最新推荐
【特征工程稀缺技巧】:标签平滑与标签编码的比较及选择指南
# 1. 特征工程简介
## 1.1 特征工程的基本概念
特征工程是机器学习中一个核心的步骤,它涉及从原始数据中选取、构造或转换出有助于模型学习的特征。优秀的特征工程能够显著提升模型性能,降低过拟合风险,并有助于在有限的数据集上提炼出有意义的信号。
## 1.2 特征工程的重要性
在数据驱动的机器学习项目中,特征工程的重要性仅次于数据收集。数据预处理、特征选择、特征转换等环节都直接影响模型训练的效率和效果。特征工程通过提高特征与目标变量的关联性来提升模型的预测准确性。
## 1.3 特征工程的工作流程
特征工程通常包括以下步骤:
- 数据探索与分析,理解数据的分布和特征间的关系。
- 特
【特征选择工具箱】:R语言中的特征选择库全面解析

# 1. 特征选择在机器学习中的重要性
在机器学习和数据分析的实践中,数据集往往包含大量的特征,而这些特征对于最终模型的性能有着直接的影响。特征选择就是从原始特征中挑选出最有用的特征,以提升模型的预测能力和可解释性,同时减少计算资源的消耗。特征选择不仅能够帮助我
【交互特征的影响】:分类问题中的深入探讨,如何正确应用交互特征

# 1. 交互特征在分类问题中的重要性
在当今的机器学习领域,分类问题一直占据着核心地位。理解并有效利用数据中的交互特征对于提高分类模型的性能至关重要。本章将介绍交互特征在分类问题中的基础重要性,以及为什么它们在现代数据科学中变得越来越不可或缺。
## 1.1 交互特征在模型性能中的作用
交互特征能够捕捉到数据中的非线性关系,这对于模型理解和预测复杂模式至关重要。例如
数据不平衡到平衡:7种实用技巧优化你的机器学习训练集

# 1. 数据不平衡的问题概述
在机器学习和数据分析的实践中,数据不平衡是一个常见的问题,它指的是数据集中不同类别的样本数量相差悬殊。这种不平衡会直接影响模型训练的效果,导致模型对数量较多的类别过分敏感,而对数量较少的类别预测能力低下。在极端情况下,模型可能完全忽略掉少数类,只对多数类进行预测,这在许多应用领域,如医疗诊断、欺诈检测等场景中,后果可能是灾难性的。因此,理解和处理
【时间序列分析】:如何在金融数据中提取关键特征以提升预测准确性

# 1. 时间序列分析基础
在数据分析和金融预测中,时间序列分析是一种关键的工具。时间序列是按时间顺序排列的数据点,可以反映出某
p值在机器学习中的角色:理论与实践的结合

# 1. p值在统计假设检验中的作用
## 1.1 统计假设检验简介
统计假设检验是数据分析中的核心概念之一,旨在通过观察数据来评估关于总体参数的假设是否成立。在假设检验中,p值扮演着决定性的角色。p值是指在原
【PCA算法优化】:减少计算复杂度,提升处理速度的关键技术

# 1. PCA算法简介及原理
## 1.1 PCA算法定义
主成分分析(PCA)是一种数学技术,它使用正交变换来将一组可能相关的变量转换成一组线性不相关的变量,这些新变量被称为主成分。
## 1.2 应用场景概述
PCA广泛应用于图像处理、降维、模式识别和数据压缩等领域。它通过减少数据的维度,帮助去除冗余信息,同时尽可能保
自然语言处理中的独热编码:应用技巧与优化方法
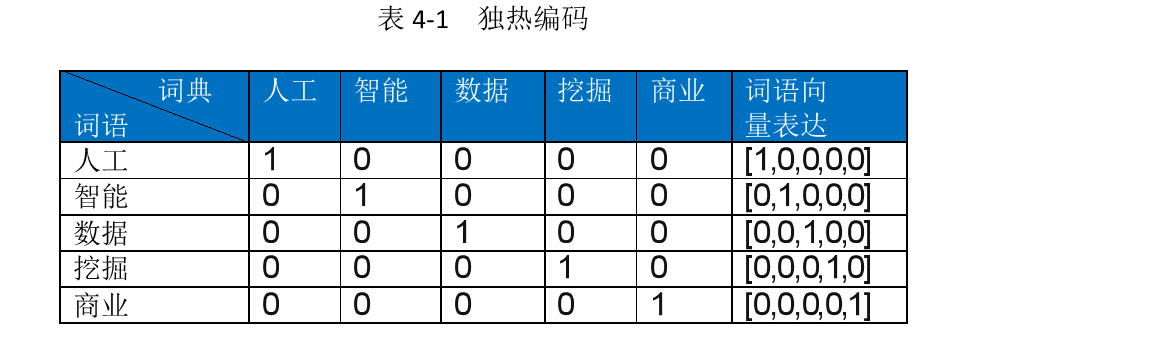
# 1. 自然语言处理与独热编码概述
自然语言处理(NLP)是计算机科学与人工智能领域中的一个关键分支,它让计算机能够理解、解释和操作人类语言。为了将自然语言数据有效转换为机器可处理的形式,独热编码(One-Hot Encoding)成为一种广泛应用的技术。
## 1.1 NLP中的数据表示
在NLP中,数据通常是以文本形式出现的。为了将这些文本数据转换为适合机器学习模型的格式,我们需要将单词、短语或句子等元
【复杂数据的置信区间工具】:计算与解读的实用技巧
# 1. 置信区间的概念和意义
置信区间是统计学中一个核心概念,它代表着在一定置信水平下,参数可能存在的区间范围。它是估计总体参数的一种方式,通过样本来推断总体,从而允许在统计推断中存在一定的不确定性。理解置信区间的概念和意义,可以帮助我们更好地进行数据解释、预测和决策,从而在科研、市场调研、实验分析等多个领域发挥作用。在本章中,我们将深入探讨置信区间的定义、其在现实世界中的重要性以及如何合理地解释置信区间。我们将逐步揭开这个统计学概念的神秘面纱,为后续章节中具体计算方法和实际应用打下坚实的理论基础。
# 2. 置信区间的计算方法
## 2.1 置信区间的理论基础
### 2.1.1
大样本理论在假设检验中的应用:中心极限定理的力量与实践
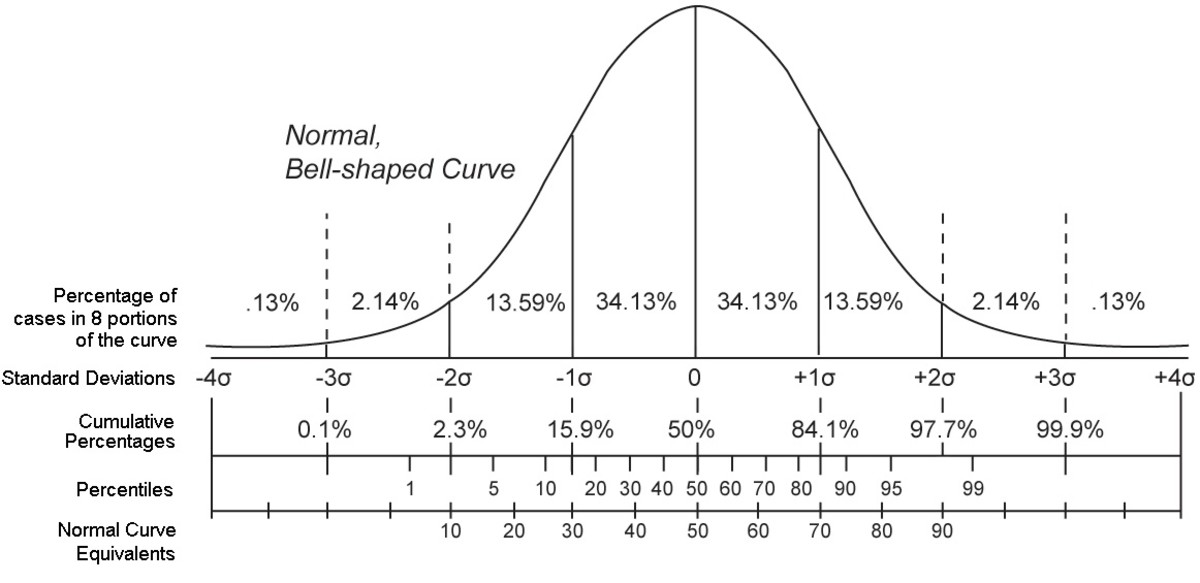
# 1. 中心极限定理的理论基础
## 1.1 概率论的开篇
概率论是数学的一个分支,它研究随机事件及其发生的可能性。中心极限定理是概率论中最重要的定理之一,它描述了在一定条件下,大量独立随机变量之和(或平均值)的分布趋向于正态分布的性
资源上传下载、课程学习等过程中有任何疑问或建议,欢迎提出宝贵意见哦~我们会及时处理!
点击此处反馈


专栏目录
最低0.47元/天 解锁专栏
买1年送3月
百万级
高质量VIP文章无限畅学
千万级
优质资源任意下载
C知道
免费提问 ( 生成式Al产品 )