功率谱与噪声分析:揭示功率谱在噪声分析中的重要性,有效识别和处理噪声
发布时间: 2024-07-10 04:05:58 阅读量: 230 订阅数: 62 

matlab_脉搏信号分析_噪声抑制和基线纠漂_时域分析_功率谱分析
# 1. 功率谱基础**
功率谱是描述信号能量在频率域分布的函数。它通过傅里叶变换将时域信号转换为频域信号,展示了信号在不同频率下的能量分布情况。功率谱在噪声分析中具有重要意义,因为它可以帮助识别噪声源、分析噪声特性,并制定噪声抑制策略。
在功率谱中,横轴表示频率,纵轴表示功率谱密度(PSD)。PSD表示单位频率范围内的信号功率。通过观察功率谱,可以直观地了解信号的频谱分布,识别是否存在噪声峰值,并分析噪声的频谱特性。
# 2. 噪声分析
噪声是任何不想要的信号,它会干扰有用信号的传输或处理。在电子系统中,噪声可能来自各种来源,包括热噪声、散粒噪声和闪烁噪声。为了有效地设计和分析电子系统,了解噪声的类型、特性和分析方法至关重要。
### 2.1 噪声的类型和特性
**2.1.1 热噪声**
热噪声是由于导体中电子的热运动而产生的。它与导体的温度成正比,并且在所有频率下都是均匀分布的。热噪声的功率谱密度(PSD)为:
```
P_n = 4kTRB
```
其中:
* P_n 为噪声功率(W)
* k 为玻尔兹曼常数(1.38 × 10^-23 J/K)
* T 为导体的温度(K)
* R 为导体的电阻(Ω)
* B 为噪声带宽(Hz)
**2.1.2 散粒噪声**
散粒噪声是由于电荷载流子(例如电子或空穴)的随机发射和复合而产生的。它与器件的偏置电流成正比,并且在低频时更为明显。散粒噪声的 PSD 为:
```
P_n = 2qI_B
```
其中:
* P_n 为噪声功率(W)
* q 为电子电荷(1.6 × 10^-19 C)
* I_B 为器件的偏置电流(A)
* B 为噪声带宽(Hz)
**2.1.3 闪烁噪声**
闪烁噪声又称为 1/f 噪声,因为它在低频时与频率成反比。它是由器件中的表面缺陷或陷阱引起的。闪烁噪声的 PSD 为:
```
P_n = K / f
```
其中:
* P_n 为噪声功率(W)
* K 为常数,取决于器件的材料和结构
* f 为频率(Hz)
### 2.2 噪声分析方法
噪声分析有两种主要方法:
**2.2.1 功率谱密度分析**
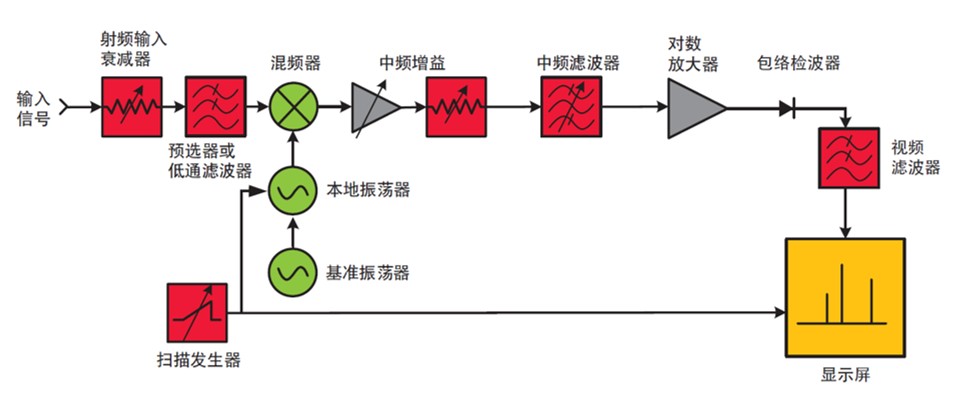
功率谱密度分析测量噪声功率在不同频率下的分布。它使用频谱分析仪或傅立叶变换来计算 PSD。PSD 图可以揭示噪声的类型、来源和特性。
**2.2.2 噪声系数分析**
噪声系数是衡量放大器或其他电路噪声性能的指标。它定义为输入信噪比与输出信噪比之比。噪声系数越低,电路的噪声性能越好。
**2.2.3 噪声温度分析**
噪声温度是表征噪声源的另一种方法。它定义为等效于热噪声源的温度,该热噪声源产生与给定噪声源相同的噪声功率。噪声温度越高,噪声源的噪声性能越差。
# 3. 功率谱在噪声分析中的应用
### 3.1 噪声源识别
功率谱分析可以帮助识别噪声源。通过分析噪声信号的功率谱,可以观察到不同频率成分的分布情况。如果某个频率成分的功率明显高于其他频率,则可以推断出该频率成分是由某个特定噪声源引起的。
例如,在分析电子电路的噪声时,如果发现某个频率成分的功率明显高于其他频率,则可以推断出该频率成分是由电路中的某个元件引起的。通过进一步分析该频率成分的特性,可以确定该元件的噪声类型和特性。
### 3.2 噪声特性分析
功率谱分析还可以用于分析噪声的特性。通过分析噪声信号的功率谱,可以获得噪声的功率谱密度、噪声带宽、噪声系数等参数。这些参数可以反映噪声的强度、分布和影响程度。
例如,在分析通信系统的噪声时,通过分析噪声信号的功率谱,可以获得噪声的功率谱密度。噪声功率谱密度反映了噪声在不同频率范围内的分布情况,可以帮助系统设计人员确定通信系统的信噪比和误码率。
### 3.3 噪声抑制策略
功率谱分析还可以用于制定噪声抑制策略。通过分析噪声信号的功率谱,可以识别出噪声的主要频率成分。针对这些频率成分,可以采取相应的噪声抑制措施。
例如,在设计电子电路时,可以通过分析噪声信号的功率谱,识别出电路中某个元件引起的噪声频率成分。然后,可以通过更换该元件或采用其他噪声抑制技术来抑制该频率成分的噪声。
#### 噪声抑制技术示例
常用的噪声抑制技术包括:
- **滤波技术:**通过使用滤波器滤除噪声信号中的特定频率成分。
- **降噪算法:**通过使用降噪算法从噪声信号中提取有用信号。
- **隔离技术:**通过隔离噪声源和信号源来减少噪声的传播。
- **屏蔽技术:**通过使用屏蔽材料来阻挡噪声的传播。
# 4. 功率谱分析实践
### 4.1 功率谱分析工具和方法
**功率谱分析工具**
* **频谱分析仪:**专业仪器,提供高精度、高分辨率的功率谱测量。
* **FFT 分析器:**基于快速傅里叶变换(FFT)算法,快速计算功率谱。
* **MATLAB/Python:**编程语言,提供丰富的信号处理和功率谱分析库。
**功率谱分析方法**
* **直接法:**直接计算信号

 百万级
高质量VIP文章无限畅学
百万级
高质量VIP文章无限畅学
 千万级
优质资源任意下载
千万级
优质资源任意下载
 C知道
免费提问 ( 生成式Al产品 )
C知道
免费提问 ( 生成式Al产品 )
0
0
相关推荐

专栏简介
“功率谱”专栏深入探究功率谱分析在信号处理中的重要作用。从小白到大师,全面掌握信号频率的奥秘。深入剖析信号频率成分,解锁信号处理新境界。揭示信号能量分布的秘密,掌握信号能量分布规律。从理论到实践,掌握功率谱估计的奥秘。直观解读信号频率特性,轻松掌握信号频率分布。探索功率谱的广泛应用场景,从通信到生物医学。揭示功率谱与相关函数、统计分析、谱估计、信号处理、时频分析、噪声分析、故障诊断、振动分析、图像处理、雷达信号处理、语音信号处理、生物医学信号处理、通信信号处理、控制系统分析之间的紧密联系。通过深入浅出的讲解和丰富的案例分析,专栏旨在帮助读者全面掌握功率谱分析,提升信号处理技能,解决实际问题。
专栏目录
最低0.47元/天 解锁专栏
买1年送3月
百万级
高质量VIP文章无限畅学
千万级
优质资源任意下载
C知道
免费提问 ( 生成式Al产品 )
最新推荐
ARM处理器:揭秘模式转换与中断处理优化实战
# 摘要
本文详细探讨了ARM处理器模式转换和中断处理机制的基础知识、理论分析以及优化实践。首先介绍ARM处理器的运行模式和中断处理的基本流程,随后分析模式转换的触发机制及其对中断处理的影响。文章还提出了一系列针对模式转换与中断
高可靠性系统的秘密武器:IEC 61709在系统设计中的权威应用

# 摘要
IEC 61709标准作为高可靠性系统设计的重要指导,详细阐述了系统可靠性预测、元器件选择以及系统安全与维护的关键要素。本文从标准概述出发,深入解析其对系统可靠性基础理论的贡献以及在高可靠性概念中的应用。同时,本文讨论了IEC 61709在元器件选择中的指导作用,包括故障模式分析和选型要求。此外,本文还探讨了该标准在系统安全评估和维护策略中的实际应用,并分析了现代系统设计新趋势下
【CEQW2高级用户速成】:掌握性能优化与故障排除的关键技巧
# 摘要
本文旨在全面探讨系统性能优化与故障排除的有效方法与实践。从基础的系统性能分析出发,涉及性能监控指标、数据采集与分析、性能瓶颈诊断等关键方面。进一步,文章提供了硬件升级、软件调优以及网络性能优化的具体策略和实践案例,强调了故障排除的重要性,并介绍了故障排查的步骤、方法和高级技术。最后,强调最佳实践的重要性,包括性能优化计划的制定、故障预防与应急响应机制,以及持续改进与优化的
Zkteco智慧考勤数据ZKTime5.0:5大技巧高效导入导出

# 摘要
Zkteco智慧考勤系统作为企业级时间管理和考勤解决方案,其数据导入导出功能是日常管理中的关键环节。本文旨在提供对ZKTime5.0版本数据导入导出操作的全面解析,涵盖数据结构解析、操作界面指导,以及高效数据导入导出的实践技巧。同时,本文还探讨了高级数据处理功能,包括数据映射转换、脚本自动化以及第三方工具的集成应用。通过案例分析,本文分享了实际应用经验,并对考勤系统
揭秘ABAP事件处理:XD01增强中事件使用与调试的终极攻略

# 摘要
本文全面介绍了ABAP事件处理的相关知识,包括事件的基本概念、类型、声明与触发机制,以及如何进行事件的增强与实现。深入分析了XD01事件的具体应用场景和处理逻辑,并通过实践案例探讨了事件增强的挑战和解决方案。文中还讨论了ABAP事件调试技术,如调试环境的搭建、事件流程的跟踪分析,以及调试过程中的性能优化技巧。最后,本文探讨了高级事件处理技术,包含事件链、事件分发、异常处理和事件日志记录,并着眼
数值分析经典题型详解:哈工大历年真题集锦与策略分析

# 摘要
本论文首先概述了数值分析的基本概念及其在哈工大历年真题中的应用。随后详细探讨了数值误差、插值法、逼近问题、数值积分与微分等核心理论,并结合历年真题提供了解题思路和实践应用。论文还涉及数值分析算法的编程实现、效率优化方法以及算法在工程问题中的实际应用。在前沿发展部分,分析了高性能计算、复杂系统中的数值分析以及人工智能
Java企业级应用安全构建:local_policy.jar与US_export_policy.jar的实战运用

# 摘要
随着企业级Java应用的普及,Java安全架构的安全性问题愈发受到重视。本文系统地介绍了Java安全策略文件的解析、创建、修改、实施以及管理维护。通过深入分析local_policy.jar和US_export_policy.jar的安全策略文件结构和权限配置示例,本文探讨了企业级应用中安全策略的具体实施方法,包括权限
【海康产品定制化之路】:二次开发案例精选

# 摘要
本文综合概述了海康产品定制化的基础理论与实践技巧。首先,对海康产品的架构进行了详细解析,包括硬件平台和软件架构组件。接着,系统地介绍了定制化开发流程,涵盖需求分析、项目规划、开发测试、部署维护等
提高效率:proUSB注册机文件优化技巧与稳定性提升

# 摘要
本文详细介绍了proUSB注册机的功能和优化策略。首先,对proUSB注册机的工作原理进行了阐述,并对其核心算法和注册码生成机制进行了深入分析。接着,从代码、系统和硬件三个层面探讨了提升性能的策略。进一步地,本文分析了提升稳定性所需采取的故障排除、容错机制以及负载均衡措施,并通过实战案例展示了优化实施和效果评估。最后,本文对proUSB注册机的未来发展趋
资源上传下载、课程学习等过程中有任何疑问或建议,欢迎提出宝贵意见哦~我们会及时处理!
点击此处反馈


专栏目录
最低0.47元/天 解锁专栏
买1年送3月
百万级
高质量VIP文章无限畅学
千万级
优质资源任意下载
C知道
免费提问 ( 生成式Al产品 )