功率谱与通信信号处理:探索功率谱在通信信号处理中的应用,提升通信质量
发布时间: 2024-07-10 04:25:20 阅读量: 93 订阅数: 64 

# 1. 功率谱基础**
功率谱是描述信号功率在不同频率上的分布的函数。它提供了信号频率成分的洞察,对于通信信号处理至关重要。
功率谱的单位是瓦特/赫兹 (W/Hz),表示在特定频率范围内的平均功率。它可以表示为连续函数或离散函数,具体取决于信号的性质。
理解功率谱对于分析通信信号的频率特性、识别噪声和干扰源以及优化通信系统性能至关重要。
# 2. 功率谱在通信信号处理中的应用
### 2.1 信号频谱分析
#### 2.1.1 频谱估计方法
频谱估计是确定信号功率谱密度的过程。常用的频谱估计方法包括:
- **周期图法:**将信号分成固定长度的段,并计算每段的功率谱密度。
- **Welch法:**对周期图法进行改进,通过重叠和加窗来提高频谱估计的准确性。
- **巴特利特法:**一种非参数频谱估计方法,使用信号的全部数据来计算功率谱密度。
- **汉宁窗法:**一种加窗方法,可减少频谱泄漏。
```python
import numpy as np
from scipy.fftpack import fft
# 信号
signal = np.random.randn(1000)
# 周期图法
psd_periodogram = np.abs(fft(signal))**2
# Welch法
psd_welch = np.abs(fft(signal))**2
psd_welch = np.mean(np.abs(psd_welch)[:, :int(psd_welch.shape[1]/2)], axis=0)
# 巴特利特法
psd_bartlett = np.abs(fft(signal))**2
psd_bartlett = np.mean(np.abs(psd_bartlett)[:, :int(psd_bartlett.shape[1]/2)], axis=0)
# 汉宁窗法
window = np.hanning(signal.shape[0])
psd_hanning = np.abs(fft(signal * window))**2
psd_hanning = np.mean(np.abs(psd_hanning)[:, :int(psd_hanning.shape[1]/2)], axis=0)
```
#### 2.1.2 频谱分析在通信中的应用
频谱分析在通信中广泛应用于:
- **信号分类:**通过分析信号的频谱特征来识别不同类型的信号。
- **信道建模:**通过测量信道的功率谱密度来表征其传输特性。
- **干扰检测:**通过分析频谱中是否存在干扰信号来检测干扰。
- **频谱管理:**通过频谱分析来分配和管理频谱资源。
### 2.2 信道建模和信道容量
#### 2.2.1 信道功率谱密度
信道功率谱密度 (PSD) 描述了信道在不同频率上的功率传输特性。它用于表征信道的衰落和噪声特性。
#### 2.2.2 信道容量计算
信道容量是信道在给定信噪比 (SNR) 下可以传输的最大信息速率。它由信道的功率谱密度和噪声功率谱密度决定。
```python
import numpy as np
# 信道功率谱密度
psd_channel = np.array([1, 0.5, 0.25, 0.125])
# 噪声功率谱密度
psd_noise = np.array([0.1, 0.1, 0.1, 0.1])
# 信噪比
snr = 10
# 信道容量
capacity = np.sum(np.log2(1 + snr * psd_channel / psd_noise))
```
### 2.3 噪声建模和噪声抑制
#### 2.3.1 噪声功率谱密度
噪声功率谱密度 (PSD) 描述了噪声在不同频率上的功率

 百万级
高质量VIP文章无限畅学
百万级
高质量VIP文章无限畅学
 千万级
优质资源任意下载
千万级
优质资源任意下载
 C知道
免费提问 ( 生成式Al产品 )
C知道
免费提问 ( 生成式Al产品 )
0
0
相关推荐

专栏简介
“功率谱”专栏深入探究功率谱分析在信号处理中的重要作用。从小白到大师,全面掌握信号频率的奥秘。深入剖析信号频率成分,解锁信号处理新境界。揭示信号能量分布的秘密,掌握信号能量分布规律。从理论到实践,掌握功率谱估计的奥秘。直观解读信号频率特性,轻松掌握信号频率分布。探索功率谱的广泛应用场景,从通信到生物医学。揭示功率谱与相关函数、统计分析、谱估计、信号处理、时频分析、噪声分析、故障诊断、振动分析、图像处理、雷达信号处理、语音信号处理、生物医学信号处理、通信信号处理、控制系统分析之间的紧密联系。通过深入浅出的讲解和丰富的案例分析,专栏旨在帮助读者全面掌握功率谱分析,提升信号处理技能,解决实际问题。
专栏目录
最低0.47元/天 解锁专栏
买1年送3月
百万级
高质量VIP文章无限畅学
千万级
优质资源任意下载
C知道
免费提问 ( 生成式Al产品 )
最新推荐
WZl客户端补丁编辑器全流程剖析:如何从源码到成品
# 摘要
本文主要探讨了WZl客户端补丁编辑器的设计与实现,包括源码分析与理解、用户界面设计、功能模块开发、异常处理与优化以及测试与部署。首先,对编辑器的源码结构和核心技术原理进行了详细解析,阐述了补丁生成算法、压缩和解压缩机制。其次,本文详细介绍了编辑器的设计和实现过程,包括界面布局、功能模块划分以及文件读写和补丁逻辑处理的实现。同时,也对异常处理和性能优化提出了相应的策略和措施。此外,本文还对编辑器的
信息系统项目时间管理:制定与跟踪项目进度的黄金法则

# 摘要
项目时间管理是确保项目按时完成的关键环节,涉及工作分解结构(WBS)的构建、项目进度估算、关键路径法(CPM)的应用等核心技术。本文全面探讨了项目时间管理的概念、重要性、进度计划的制定和跟踪控制策略,并且分析了多项目环境中的时间管理挑战、风险评估以及时间管理的创新方法。通过案例研究,本文总结了时间管理的最佳实践与技巧,旨在为项目管理者提供实用的工具和策略,以提高项目执行效率
R420读写器GPIO脚本自动化:简化复杂操作的终极脚本编写手册
# 摘要
本文主要探讨了R420读写器与GPIO脚本的综合应用。第一章介绍了R420读写器的基本概念和GPIO脚本的应用概述。第二章详细阐述了GPIO脚本的基础知识、自动化原理以及读写器的工作机制和信号控制原理。第三章通过实践操作,说明了如何编写基本和复杂操作的GPIO脚本,并探讨了R420读写器与外部设备的交互。第四章则聚焦于自动化脚本的优化与高级应用开发,包括性能优化策略、远程控制和网络功能集成,以及整合R420
EIA-481-D实战案例:电路板设计中的新标准应用与效率提升
# 摘要
EIA-481-D标准作为电路板设计领域的一项新标准,对传统设计方法提出了挑战,同时也为行业发展带来了新机遇。本文首先概述了EIA-481-D标准的产生背景及其核心要素,揭示了新标准对优化设计流程和跨部门协作的重要性。随后,探讨了该标准在电路板设计中的实际应用,包括准备工作、标准化流程的执行以及后续的测试与评估。文章重点分析了EIA-481-D标准带来
利用Xilinx SDK进行Microblaze程序调试:3小时速成课
# 摘要
本文详细介绍了Microblaze处理器与Xilinx SDK的使用方法,涵盖了环境搭建、程序编写、编译、调试以及实战演练的全过程。首先,概述了Microblaze处理器的特点和Xilinx SDK环境的搭建,包括软件安装、系统要求、项目创建与配置。随后,深入探讨了在Microblaze平台上编写汇编和C语言程序的技巧,以及程序的编译流程和链接脚本的编写。接着,文章重点讲述了使用Xilinx
LIN 2.1与LIN 2.0全面对比:升级的最佳理由

# 摘要
随着车载网络技术的迅速发展,LIN(Local Interconnect Network)技术作为一项重要的低成本车辆通信标准,已经实现了从2.0到2.1的演进。本文旨在全面概述LIN 2.1技术的关键改进,包括性能优化、诊断能力提升及安全性增强等方面。文章深入探讨了LIN 2.1在汽车通信中的实际
【数据同步技术挑战攻略】:工厂管理系统中的应用与应对

# 摘要
数据同步技术是确保信息系统中数据准确性和一致性的重要手段。本文首先概述了数据同步技术及其理论基础,包括数据一致性的定义和同步机制类型。接着,本文探讨了数据同步技术的
【Adobe Illustrator高级技巧曝光】:20年经验设计专家分享的秘密武器库
# 摘要
本文全面探讨了Adobe Illustrator在图形设计领域的应用,涵盖了从基础操作到高效工作流程优化的各个方面。首先介绍了Illustrator的基本功能和高级图形设计技巧,包括路径、锚点、图层、蒙版以及颜色和渐变的处理。其次,强调了工作流程的优化,包括自定义工作区、智能对象与符号管理,以及输出和预览设置的高效化。接着深入讨
TRACE32高级中断调试:快速解决中断响应难题
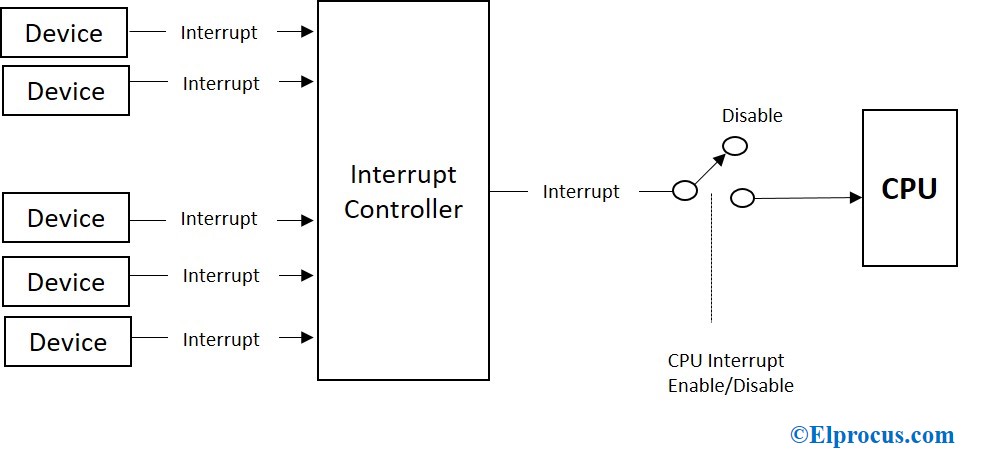
# 摘要
中断机制是现代嵌入式系统设计中的关键组成部分,直接影响到系统的响应时间和性能。本文从中断机制的基础知识出发,介绍了TRACE32工具在高级中断调试中的功能与优势,并探讨了其在实际应用中的实践技巧。通过对中断系统工作原理的理论分析,以及 TRACE32 在测量、分析和优化中断响应时间方面的技术应用,本文旨在提高开发者对中断调试的理解和操作能力。同时,通过分析常见中断问题案例,本文展示了 TRACE32 在实际项目
资源上传下载、课程学习等过程中有任何疑问或建议,欢迎提出宝贵意见哦~我们会及时处理!
点击此处反馈


专栏目录
最低0.47元/天 解锁专栏
买1年送3月
百万级
高质量VIP文章无限畅学
千万级
优质资源任意下载
C知道
免费提问 ( 生成式Al产品 )