【Python数据处理中的图解】:图算法的应用详解
发布时间: 2024-09-11 21:08:41 阅读量: 174 订阅数: 40 
# 1. 图算法简介和应用场景
在计算机科学和数学领域,图算法是用来解决图论问题的一系列算法和技术。图是一种由顶点(节点)以及连接这些顶点的边组成的抽象数据结构,能够有效表达实体之间的复杂关系。图算法广泛应用于社交网络分析、网络优化、推荐系统、生物信息学等多个领域。
## 1.1 图算法在社交网络中的应用
在社交网络中,用户和用户之间的连接关系可以用图来表示,图算法可以帮助我们理解网络的结构特性,比如社区检测、影响力扩散和传播等。例如,通过识别社交网络中的关键节点(中心人物),我们可以对信息的传播路径和范围进行预测和控制。
## 1.2 图算法在推荐系统中的应用
推荐系统利用图算法来挖掘用户和物品之间的隐含关系,通过分析用户的历史行为数据生成个性化推荐。例如,基于图的协同过滤算法通过构建用户-物品的二部图,计算节点间的相似性,从而对用户可能感兴趣的商品进行推荐。
## 1.3 图算法在路网规划中的应用
在路网规划与分析中,地图可以被建模为一个加权有向图,其中节点代表路口,边代表路段,边的权重可以表示距离、行驶时间或者成本。图算法,特别是最短路径算法,比如迪杰斯特拉算法和弗洛伊德算法,在计算两点间的最优路径、交通流量预测和拥堵分析中发挥着重要作用。
在接下来的章节中,我们将深入探索图算法的基础理论,了解其复杂度分析,并且通过Python编程实现具体的图算法案例,进一步扩展和优化算法以适应各种实际问题。
# 2. 图算法的基础理论
## 2.1 图的基本概念
### 2.1.1 图的定义和表示方法
图是图算法中的基础数据结构,它由顶点(vertices)和边(edges)组成。顶点表示实体,边表示实体间的关系。图可以是有向的(边具有方向)或无向的(边没有方向)。
在数学和计算机科学中,图可以表示为G(V, E),其中V代表顶点集合,E代表边集合。一个边可以表示为两个顶点的有序对(u, v),其中u和v是V中的元素,并称作这条边的端点。
图的表示方法主要有以下几种:
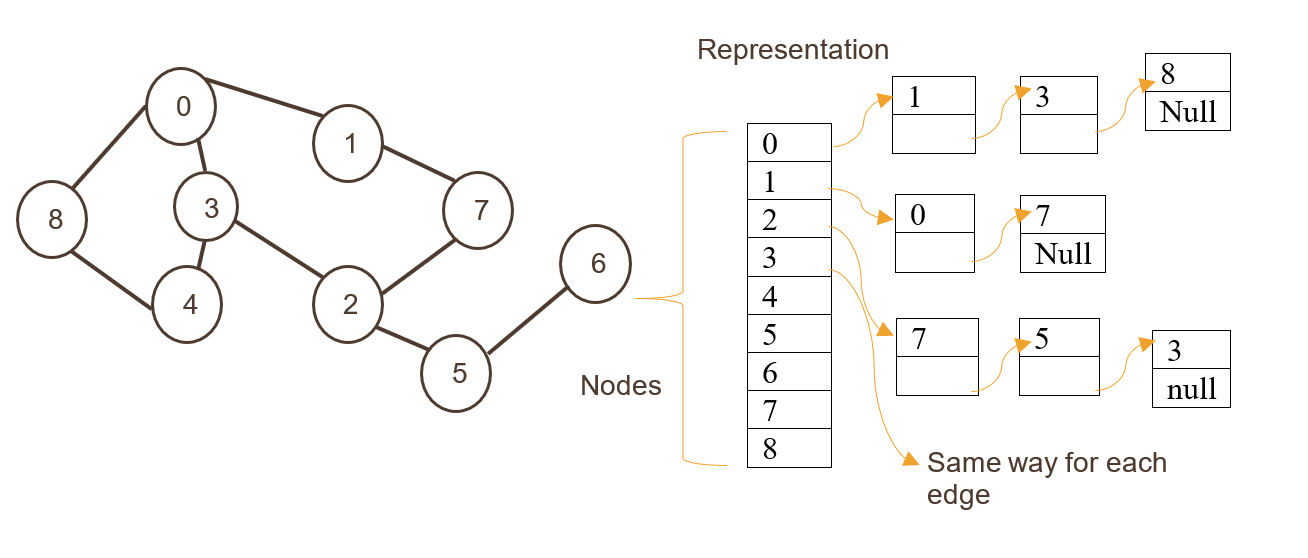
- 邻接矩阵:使用二维数组表示图,适合于稀疏图。
- 邻接表:使用链表或数组表示每个顶点的邻居,适合于稠密图。
- 边表:存储图的边信息,包括边的起点和终点。
**邻接矩阵示例代码:**
```python
import numpy as np
# 创建一个4个顶点的空无向图
V = 4
G = np.zeros((V, V), dtype=int)
# 添加边 (0, 1), (0, 2), (1, 2), (2, 3)
G[0][1] = G[1][0] = 1
G[0][2] = G[2][0] = 1
G[1][2] = G[2][1] = 1
G[2][3] = G[3][2] = 1
print("Adjacency Matrix:")
print(G)
```
**邻接表示例代码:**
```python
# 创建一个空图
graph = {i: [] for i in range(V)}
# 添加边 (0, 1), (0, 2), (1, 2), (2, 3)
graph[0].append(1)
graph[1].append(0)
graph[0].append(2)
graph[2].append(0)
graph[1].append(2)
graph[2].append(1)
graph[2].append(3)
graph[3].append(2)
print("Adjacency List:")
for key in graph:
print(f"{key}: {graph[key]}")
```
### 2.1.2 图的遍历算法
图的遍历算法主要有深度优先搜索(DFS)和广度优先搜索(BFS)。
**深度优先搜索**:
- 概念:尽可能深地搜索图的分支。
- 方法:使用递归实现或栈实现。
- 用途:拓扑排序,解决迷宫问题等。
**广度优先搜索**:
- 概念:先访问离根节点最近的节点,然后访问离根节点次近的节点。
- 方法:使用队列实现。
- 用途:找到最短路径,拓扑排序等。
**DFS Python代码实现:**
```python
def dfs(graph, start, visited=None):
if visited is None:
visited = set()
visited.add(start)
print(start, end=' ')
for next in graph[start] - visited:
dfs(graph, next, visited)
return visited
visited = dfs(graph, 0)
```
**BFS Python代码实现:**
```python
from collections import deque
def bfs(graph, start):
visited = set()
queue = deque([start])
while queue:
vertex = queue.popleft()
if vertex not in visited:
print(vertex, end=' ')
visited.add(vertex)
queue.extend(graph[vertex] - visited)
return visited
visited = bfs(graph, 0)
```
## 2.2 图算法的基本类型
### 2.2.1 最短路径算法
最短路径问题旨在找出加权图中两个顶点之间的最短路径。最常见的算法是Dijkstra算法和Floyd-Warshall算法。
**Dijkstra算法**:
- 算法步骤:
- 创建最短路径树集合S,最初包含起始顶点。
- 创建一个距离表,记录源点到每个顶点的最短路径长度估计值。
- 对于未访问的顶点,选择距离表中距离最小的顶点作为下一个访问的顶点。
- 更新未访问顶点的距离表值。
- 应用场景:GPS导航,网络中的路由算法等。
**Dijkstra算法Python实现:**
```python
import sys
def dijkstra(graph, src):
dist = {vertex: float('infinity') for vertex in graph}
dist[src] = 0
priority_queue = [(0, src)]
while priority_queue:
current_distance, current_vertex = priority_queue.pop(0)
for neighbor, weight in graph[current_vertex].items():
distance = current_distance + weight
if distance < dist[neighbor]:
dist[neighbor] = distance
priority_queue.append((distance, neighbor))
return dist
dijkstra_result = dijkstra(graph, 0)
```
### 2.2.2 最小生成树算法
最小生成树是加权无向图的一个子集,它是一个树结构,包含图中所有的顶点,并且边的总权重尽可能小。
**Kruskal算法**:
- 算法步骤:
- 将图中的所有边按照权重从小到大排序。
- 初始化一个最小生成树,开始时为空。
- 遍历排序后的边列表,将当前边加入最小生成树中,如果加入后没有形成环,则这条边被接受。
- 重复步骤3直到最小生成树中有V-1条边。
- 应用场景:网络设计,电路布线等。
**Kruskal算法Python实现:**
```python
class DisjointSet:
def __init__(self, vertices):
self.parent = {}
for vertex in vertices:
self.parent[vertex] = vertex
def find(self, item):
if self.parent[item] != item:
self.parent[item] = self.find(self.parent[item])
return self.parent[item]
def union(self, set1, set2):
root1 = self.find(set1)
root2 = self.find(set2)
if root1 != root2:
sel
```

 百万级
高质量VIP文章无限畅学
百万级
高质量VIP文章无限畅学
 千万级
优质资源任意下载
千万级
优质资源任意下载
 C知道
免费提问 ( 生成式Al产品 )
C知道
免费提问 ( 生成式Al产品 )
0
0
相关推荐

专栏简介
本专栏旨在深入探讨 Python 中的数据结构及其在数据分析和处理中的应用。通过一系列文章,我们将从基础知识开始,逐步介绍高级技巧和实战应用。涵盖的内容包括:
* 数据结构基础和数据处理流程构建
* 高效数据管理的秘诀
* 列表和字典的深入使用
* 集合操作的优化技巧
* 堆栈和队列的先进先出与后进先出原理
* 树结构在复杂数据关系中的运用
* 图算法的应用详解
* 数据结构在函数式编程中的应用
* 多线程与多进程数据结构处理技巧
* Pandas 库中数据结构的使用技巧
* 数据结构在数据清洗、转换、映射和机器学习数据预处理中的应用
专栏目录
最低0.47元/天 解锁专栏
买1年送3月
百万级
高质量VIP文章无限畅学
千万级
优质资源任意下载
C知道
免费提问 ( 生成式Al产品 )
最新推荐
【商业化语音识别】:技术挑战与机遇并存的市场前景分析
# 1. 商业化语音识别概述
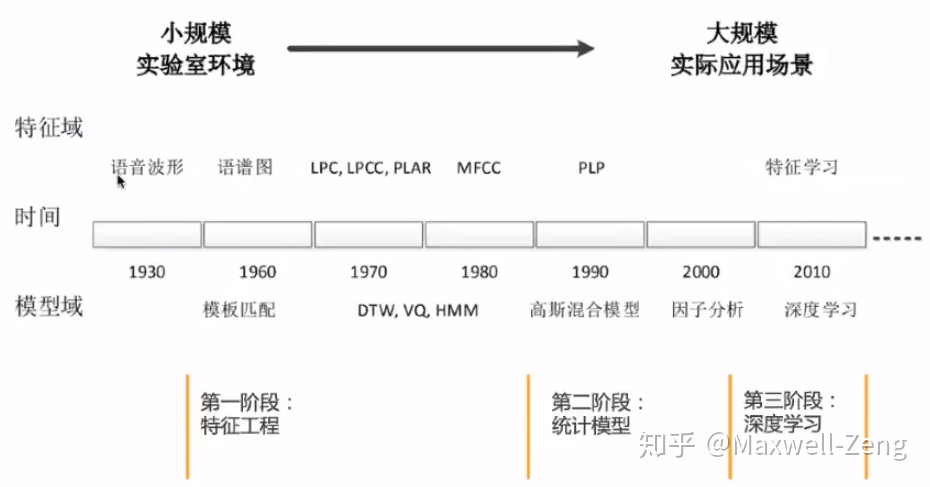
语音识别技术作为人工智能的一个重要分支,近年来随着技术的不断进步和应用的扩展,已成为商业化领域的一大热点。在本章节,我们将从商业化语音识别的基本概念出发,探索其在商业环境中的实际应用,以及如何通过提升识别精度、扩展应用场景来增强用户体验和市场竞争力。
## 1.1 语音识别技术的兴起背景
语音识别技术将人类的语音信号转化为可被机器理解的文本信息,它
PyTorch超参数调优:专家的5步调优指南
# 1. PyTorch超参数调优基础概念
## 1.1 什么是超参数?
在深度学习中,超参数是模型训练前需要设定的参数,它们控制学习过程并影响模型的性能。与模型参数(如权重和偏置)不同,超参数不会在训练过程中自动更新,而是需要我们根据经验或者通过调优来确定它们的最优值。
## 1.2 为什么要进行超参数调优?
超参数的选择直接影响模型的学习效率和最终的性能。在没有经过优化的默认值下训练模型可能会导致以下问题:
- **过拟合**:模型在
跨平台推荐系统:实现多设备数据协同的解决方案

# 1. 跨平台推荐系统概述
## 1.1 推荐系统的演变与发展
推荐系统的发展是随着互联网内容的爆炸性增长和用户个性化需求的提升而不断演进的。最初,推荐系统主要基于规则来实现,而后随着数据量的增加和技术的进步,推荐系统转向以数据驱动为主,使用复杂的算法模型来分析用户行为并预测偏好。如今,跨平台推荐系统正逐渐成为研究和应用的热点,旨
【图像分类模型自动化部署】:从训练到生产的流程指南
# 1. 图像分类模型自动化部署概述
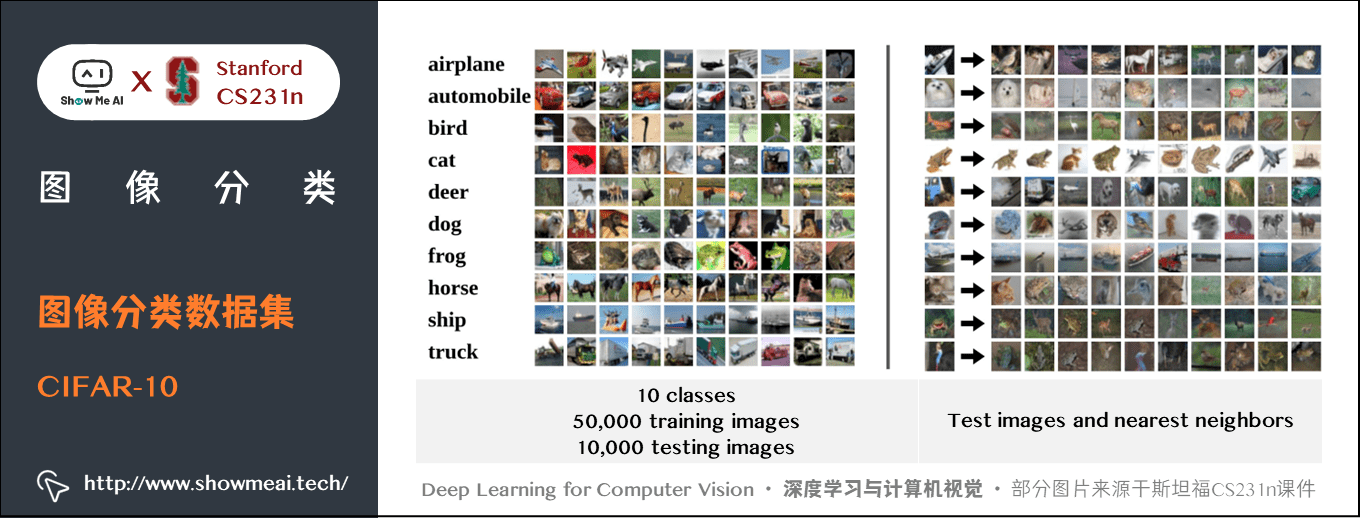
在当今数据驱动的世界中,图像分类模型已经成为多个领域不可或缺的一部分,包括但不限于医疗成像、自动驾驶和安全监控。然而,手动部署和维护这些模型不仅耗时而且容易出错。随着机器学习技术的发展,自动化部署成为了加速模型从开发到生产的有效途径,从而缩短产品上市时间并提高模型的性能和可靠性。
本章旨在为读者提供自动化部署图像分类模型的基本概念和流程概览,
硬件加速在目标检测中的应用:FPGA vs. GPU的性能对比
# 1. 目标检测技术与硬件加速概述
目标检测技术是计算机视觉领域的一项核心技术,它能够识别图像中的感兴趣物体,并对其进行分类与定位。这一过程通常涉及到复杂的算法和大量的计算资源,因此硬件加速成为了提升目标检测性能的关键技术手段。本章将深入探讨目标检测的基本原理,以及硬件加速,特别是FPGA和GPU在目标检测中的作用与优势。
## 1.1 目标检测技术的演进与重要性
目标检测技术的发展与深度学习的兴起紧密相关
【数据集加载与分析】:Scikit-learn内置数据集探索指南

# 1. Scikit-learn数据集简介
数据科学的核心是数据,而高效地处理和分析数据离不开合适的工具和数据集。Scikit-learn,一个广泛应用于Python语言的开源机器学习库,不仅提供了一整套机器学习算法,还内置了多种数据集,为数据科学家进行数据探索和模型验证提供了极大的便利。本章将首先介绍Scikit-learn数据集的基础知识,包括它的起源、
【循环神经网络】:TensorFlow中RNN、LSTM和GRU的实现

# 1. 循环神经网络(RNN)基础
在当今的人工智能领域,循环神经网络(RNN)是处理序列数据的核心技术之一。与传统的全连接网络和卷积网络不同,RNN通过其独特的循环结构,能够处理并记忆序列化信息,这使得它在时间序列分析、语音识别、自然语言处理等多
Keras正则化技术应用:L1_L2与Dropout的深入理解
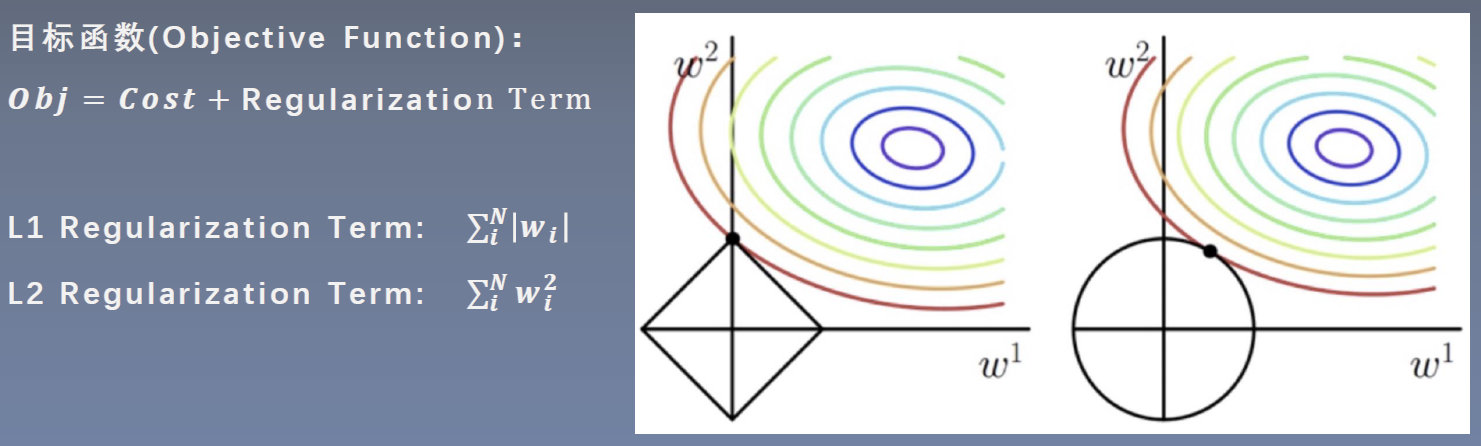
# 1. Keras正则化技术概述
在机器学习和深度学习中,正则化是一种常用的技术,用于防止模型过拟合。它通过对模型的复杂性施加
图像融合技术实战:从理论到应用的全面教程
# 1. 图像融合技术概述
随着信息技术的快速发展,图像融合技术已成为计算机视觉、遥感、医学成像等多个领域关注的焦点。**图像融合**,简单来说,就是将来自不同传感器或同一传感器在不同时间、不同条件下的图像数据,经过处理后得到一个新的综合信息。其核心目标是实现信息的有效集成,优化图像的视觉效果,增强图像信息的解释能力或改善特定任务的性能。
从应用层面来看,图像融合技术主要分为三类:**像素级**融合,直接对图
优化之道:时间序列预测中的时间复杂度与模型调优技巧
# 1. 时间序列预测概述
在进行数据分析和预测时,时间序列预测作为一种重要的技术,广泛应用于经济、气象、工业控制、生物信息等领域。时间序列预测是通过分析历史时间点上的数据,以推断未来的数据走向。这种预测方法在决策支持系统中占据着不可替代的地位,因为通过它能够揭示数据随时间变化的规律性,为科学决策提供依据。
时间序列预测的准确性受到多种因素的影响,例如数据
资源上传下载、课程学习等过程中有任何疑问或建议,欢迎提出宝贵意见哦~我们会及时处理!
点击此处反馈


专栏目录
最低0.47元/天 解锁专栏
买1年送3月
百万级
高质量VIP文章无限畅学
千万级
优质资源任意下载
C知道
免费提问 ( 生成式Al产品 )