MATLAB Curve Annotation Unveiled: Titles, Labels, Legends - Making Charts Clearer
发布时间: 2024-09-14 08:17:59 阅读量: 36 订阅数: 33 
# Unveiling MATLAB Curve Annotations: Titles, Labels, Legends for Clearer Charts
## 1. Overview of MATLAB Curve Annotations
MATLAB curve annotations are powerful tools designed to enhance the clarity of data visualizations and engineering drawings. They allow users to add text, labels, and legends to graphs to convey critical information and insights. With MATLAB's built-in functions and custom scripts, creating and customizing various types of curve annotations—from simple axis labels to complex dynamic interactive annotations—is straightforward.
## 2. Customizing Titles and Labels
Titles and labels are essential elements of a graph that help readers understand the meaning and content of the chart. MATLAB offers a wealth of options to customize titles and labels, making them more informative and aesthetically pleasing.
### 2.1 Setting and Formatting Titles
#### 2.1.1 Text Content and Font Styles of Titles
Title text is one of the most important pieces of information in a chart; it should clearly and concisely describe the content of the chart. MATLAB allows users to set the text content and font style of titles, including font type, size, color, and boldface.
```matlab
% Setting title text
title('MATLAB Curve Annotation Example');
% Setting title font style
title('MATLAB Curve Annotation Example', 'FontName', 'Times New Roman', 'FontSize', 14, 'FontWeight', 'bold', 'Color', 'blue');
```
#### 2.1.2 Positioning and Alignment of Titles
The positioning and alignment of the title can affect the aesthetics and readability of the chart. MATLAB allows users to set the horizontal and vertical position of the title, as well as the alignment.
```matlab
% Setting horizontal position of title
title('MATLAB Curve Annotation Example', 'HorizontalAlignment', 'left');
% Setting vertical position of title
title('MATLAB Curve Annotation Example', 'VerticalAlignment', 'bottom');
% Setting alignment of title
title('MATLAB Curve Annotation Example', 'HorizontalAlignment', 'center', 'VerticalAlignment', 'middle');
```
### 2.2 Setting and Formatting Labels
#### 2.2.1 Text Content and Font Styles of Axis Labels
Axis labels are used to identify values on the axes, and they should be clear and understandable. MATLAB allows users to set the text content and font style of axis labels, including font type, size, color, and boldface.
```matlab
% Setting x-axis label text
xlabel('Time (seconds)');
% Setting x-axis label font style
xlabel('Time (seconds)', 'FontName', 'Arial', 'FontSize', 12, 'FontWeight', 'bold', 'Color', 'red');
```
#### 2.2.2 Positioning and Alignment of Axis Labels
The positioning and alignment of axis labels can affect the aesthetics and readability of the chart. MATLAB allows users to set the horizontal and vertical position of axis labels, as well as the alignment.
```matlab
% Setting horizontal position of x-axis label
xlabel('Time (seconds)', 'HorizontalAlignment', 'left');
% Setting vertical position of x-axis label
xlabel('Time (seconds)', 'VerticalAlignment', 'bottom');
% Setting alignment of x-axis label
xlabel('Time (seconds)', 'HorizontalAlignment', 'center', 'VerticalAlignment', 'middle');
```
#### 2.2.3 Setting and Formatting Tick Lines
Tick lines indicate the values on the axes, and they should be clear and easy to see. MATLAB allows users to set the style, color, size, and spacing of tick lines.
```matlab
% Setting x-axis tick line style
xticks(0:10:100);
% Setting x-axis tick line color
xticks(0:10:100, 'Color', 'blue');
% Setting x-axis tick line size
xticks(0:10:100, 'FontSize', 12);
% Setting x-axis tick line spacing
xticks(0:10:100, 'TickInterval', 2);
```
## 3.1 Adding and Removing Legends
#### 3.1.1 Positioning and Sizing of Legends
In MATLAB, the `legend` function can be used to add a legend. The syntax of the `legend` function is as follows:
```matlab
legend('Label1', 'Label2', ..., 'Labeln', 'Option')
```
Where `'Label1', 'Label2', ..., 'Labeln'` are the labels for each curve in the legend, and `'Option'` is an optional legend option.
The position of the legend can be specified using the `'Location'` ***mon position options include:
* `'best'`: automatically selects the best location
* `'north'`: at the top of the chart
* `'south'`: at the bottom of the chart
* `'east'`: to the right of the chart
* `'west'`: to the left of the chart
The size of the legend can be specified using the `'Position'` option. The `'Position'` option is a four-element vector that specifies the coordinates of the lower left corner, width, and height of the legend. For example, the following code places the legend in t

 百万级
高质量VIP文章无限畅学
百万级
高质量VIP文章无限畅学
 千万级
优质资源任意下载
千万级
优质资源任意下载
 C知道
免费提问 ( 生成式Al产品 )
C知道
免费提问 ( 生成式Al产品 )
0
0
相关推荐

专栏目录
最低0.47元/天 解锁专栏
买1年送3月
百万级
高质量VIP文章无限畅学
千万级
优质资源任意下载
C知道
免费提问 ( 生成式Al产品 )
最新推荐
深入解析MODBUS RTU模式:构建工业通信环境的不二选择

# 摘要
本文旨在全面介绍MODBUS RTU模式的各个方面,包括其基础通信协议、实践应用以及与现代技术的融合。首先,概述了MODBUS RTU模式,并详细解析了其数据格式、错误检测机制以及指令集。然后,分析了MODBUS RTU在工业控制领域的应用,涵盖了设备间数据交互、故障诊断和通信环境的搭建与优化。此外,探讨了MODBUS RTU与TCP/IP的桥接技术
【从零开始到MySQL权限专家】:逐层破解ERROR 1045的终极方案

# 摘要
本文旨在深入探讨MySQL权限系统及与之相关的ERROR 1045错误。首先,我们解释了MySQL权限系统的基本概念及其在数据库管理中的作用。随后,文章详细分析了ERROR 1045错误的多种产生原因,例如密码、用户名错误及权限配置问题,并探讨了该错误对数据库访问、操作和安全性的影响。在理论分
【解锁编码转换秘籍】:彻底搞懂UTF-8与GB2312的互换技巧(专家级指南)
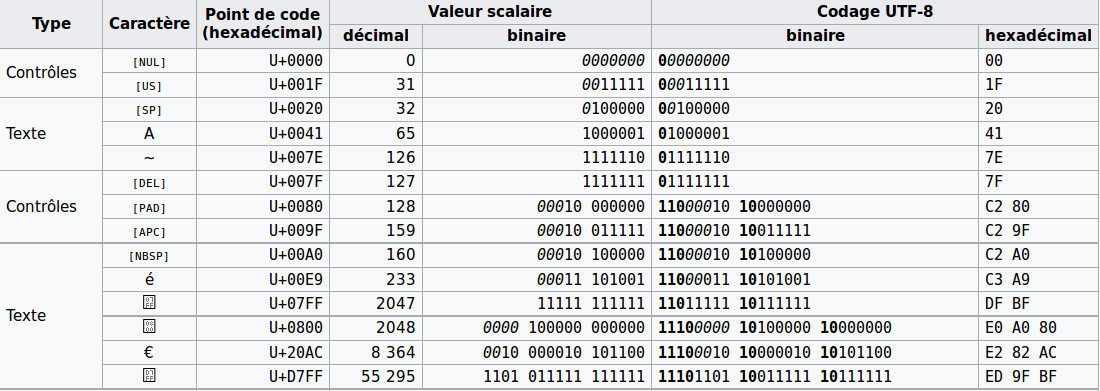
# 摘要
本文全面探讨了编码转换的必要性、基础概念,以及UTF-8与GB2312编码的转换技术。文章首先介绍了编码转换的基本原理与重要性,接着深入解析UTF-8编码的机制及其在不同编程环境中的应用和常见问题。接着,文章转向GB2312编码,讨论其历史背景、实践应用以及面临的挑战。之后,文章详细介绍了UTF-8与GB2312之间转换的技巧、实践和常见
【性能调优全解析】:数控机床PLC梯形图逻辑优化与效率提升手册
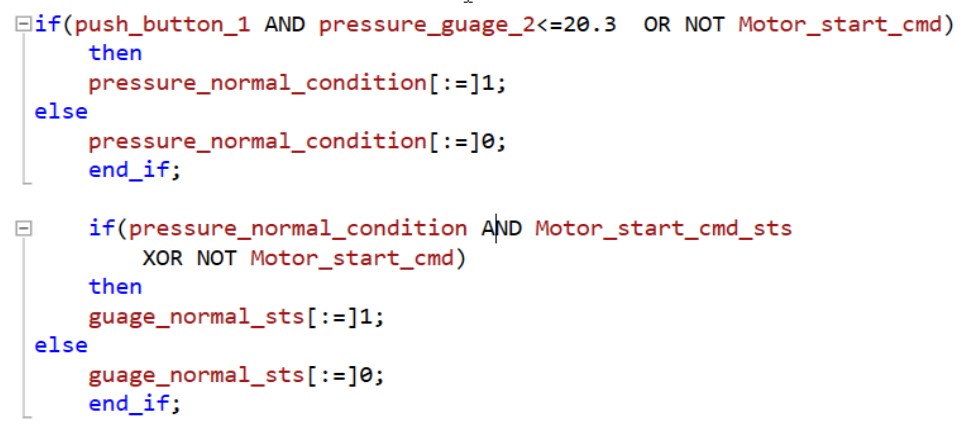
# 摘要
本文首先介绍了数控机床与PLC梯形图的基础知识,随后深入探讨了PLC梯形图的逻辑设计原则和优化理论。文中详细阐述了逻辑优化的目的和常用技术,并提供了优化步骤与方法,以及实际案例分析。接着,本文聚焦于PLC梯形图效率提升的实践,包括程序结构优化、高速处理器与存储技术的应用,以及硬件升级的最佳实践。文章最后对性能监控与故障诊断的重要性
揭秘流量高峰期:网络流量分析的终极技巧
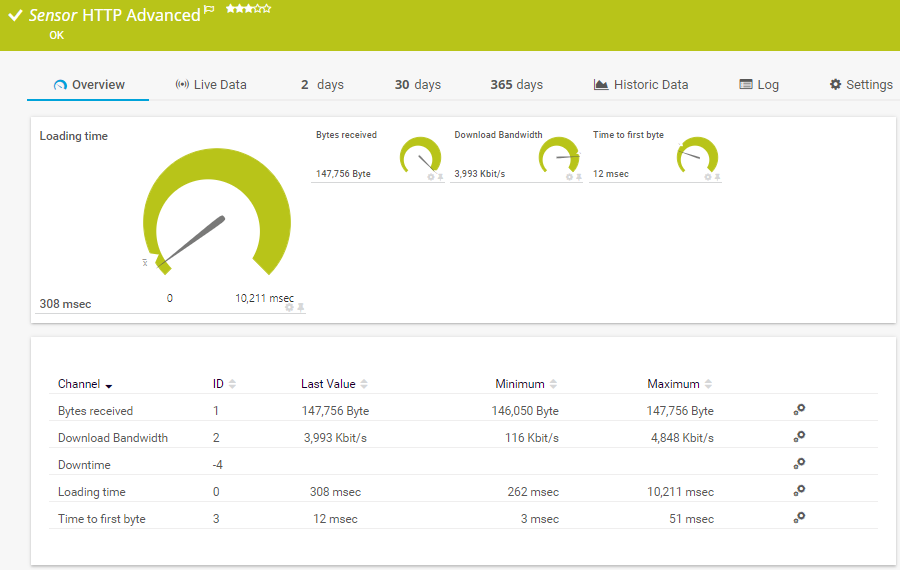
# 摘要
随着网络技术的迅速发展,网络流量分析在确保网络安全和提升网络性能方面发挥着越来越重要的作用。本文首先概述网络流量分析的基本概念和重要性,随后深入探讨了数据采集和预处理的技术细节,包括使用的工具与方法,以及对数据进行清洗、格式化和特征提取的重要性。理论与方法章节详细介绍了网络流量的基本理论模型、行为分析、异常检测技术和流量预测模型。实践技巧章节提供了实时监
VCO博士揭秘:如何将实验室成果成功推向市场

# 摘要
本文全面探讨了实验室成果商业化的理论基础和实际操作流程。首先,分析了技术转移的策略、时机和对象,以及知识产权的种类、重要性及其申请与维护方法。接着,阐述了产品开发中的市场定位、竞争优势以及开发计划的重要性,并对市场趋势进行了深入的风险评估。文章还介绍了融资策略和商业模型构建的关键点,包括价值主张、成本结构和财务规划。最后,通过成功与失败案例的分析,总结了商业化过程中的经验教训,并对未来科技与市场趋势进行了展望,为
C2000 InstaSPIN FOC优化指南:三电阻采样策略的终极优化技巧

# 摘要
本文全面介绍了C2000 InstaSPIN-FOC技术及其在三电阻采样策略中的应用。首先,概述了InstaSPIN-FOC技术的基础,并探讨了三电阻采样原理的优势及应用场景。接着,通过硬件设计要点的分析,阐述了如何在采样精度与系统成本之间取得平衡。软件实现部分详细说明了在C2000平台上进行三电阻采样初始化、算法编码以及数据处理的关键步骤。文章还探讨了优化三电阻采样
Go语言Web并发处理秘籍:高效管理并发请求

# 摘要
Go语言以其简洁的并发模型和高效的goroutine处理机制在Web开发领域中受到广泛关注。本文首先概述了Go语言Web并发处理的基本原理,随后深入探讨了goroutine的并发模型、最佳实践以及goroutine与通道的高效互动。在Web请求处理方面,本文详细介绍了如何通过goroutine模式
隐藏节点无处藏身:载波侦听技术的应对策略

# 摘要
载波侦听多路访问(CSMA)技术是无线网络通信中的重要组成部分。本文首先概述了CSMA技术,继而探讨其理论基础,重点分析了隐藏节点问题的产生
Paho MQTT性能优化:减少消息延迟的实践技巧

# 摘要
本文深入探讨了基于Paho MQTT协议的延迟问题及其性能优化策略。首先介绍了MQTT的基础知识和消息传输机制,强调了发布/订阅模型和消息传输流程的重要性。接着,文章分析了MQTT延迟的根本原因,包括网络延迟和服务质量(QoS)的影响。为了缓解延迟问题,本文提出了针
资源上传下载、课程学习等过程中有任何疑问或建议,欢迎提出宝贵意见哦~我们会及时处理!
点击此处反馈


专栏目录
最低0.47元/天 解锁专栏
买1年送3月
百万级
高质量VIP文章无限畅学
千万级
优质资源任意下载
C知道
免费提问 ( 生成式Al产品 )