MATLAB Dynamic Curve Plotting: Real-Time Updates, Clear Visibility of Data Changes
发布时间: 2024-09-14 08:16:32 阅读量: 38 订阅数: 33 

matlab建立两个隐含层的代码-Fashion-MNIST-NN-Modeling-Plotting:Fashion-MNIST-NN-建模
# Introduction to MATLAB Dynamic Curve Plotting: Real-Time Updates and Clear Data Visualization
MATLAB dynamic curve plotting is a powerful technique that allows users to visualize data in real-time. It is widely used across various fields, including data analysis, scientific research, and engineering design. With dynamic curve plotting, users can monitor data streams, identify trends, and make timely decisions.
Dynamic curve plotting involves real-time data acquisition, processing, and visualization. MATLAB offers a range of functions and tools that simplify these tasks, making them efficient. Using these tools, users can create interactive charts that allow them to zoom, pan, and adjust curves to get the best view of the data.
# Theoretical Basis of MATLAB Dynamic Curve Plotting
### Real-Time Data Acquisition and Processing
#### Data Acquisition
Real-time data acquisition is the foundation of dynamic curve plotting. MATLAB provides a variety of data acquisition tools, such as the `daqread` function, which is used to read data from data acquisition cards or sensors. The data acquisition process typically involves the following steps:
- **Configuring data acquisition devices:** Setting parameters such as sampling rate, channels, and trigger conditions.
- **Starting data acquisition:** Using the `daqread` function to begin data acquisition.
- **Reading data:** Reading data from the acquisition device and storing it in MATLAB variables.
```matlab
% Configuring data acquisition devices
daq = daq.createSession('ni');
daq.addAnalogInputChannel('Dev1', 0, 'Voltage');
daq.Rate = 1000; % Sampling rate at 1000 Hz
% Starting data acquisition
daq.startBackground();
% Reading data
data = daq.readData();
% Stopping data acquisition
daq.stop();
```
#### Data Preprocessing
The raw data acquired often ***mon preprocessing steps include:
- **Filtering:** Using digital filters to remove noise.
- **Detrending:** Removing trends or baseline drift from the data.
- **Normalization:** Scaling or normalizing the data to a specific range.
```matlab
% Filtering
data = filter(b, a, data); % Using a Butterworth filter for noise reduction
% Detrending
data = detrend(data); % Removing linear trends
% Normalization
data = (data - min(data)) / (max(data) - min(data)); % Normalizing to the [0, 1] range
```
### Principles and Algorithms of Curve Plotting
#### Principles of Curve Plotting
Dynamic curve plotting involves the real-time updating and plotting of data. MATLAB uses double buffering techniques to achieve smooth curve plotting:
- **Front buffer:** Stores newly acquired data and processes it.
- **Back buffer:** Stores data to be plotted and displays it in the graphic window.
When new data is available, MATLAB adds it to the front buffer and triggers an event to update the back buffer. After the update is complete, the content of the back buffer is swapped to the front buffer and displayed in the graphic window.
#### Algorithms of Curve Plotting
MATLAB provides various curve plotting algorithms, including:
- **Linear interpolation:** Connecting adjacent data points with straight lines.
- **Spline interpolation:** Connecting data points with smooth curves.
- **Bezier curves:** Connecting data points with quadratic or cubic Bezier curves.
The choice of algorithm depends on the desired smoothness and accuracy of the curve.
```matlab
% Using linear interpolation to plot a curve
plot(x, y, 'r-', 'LineWidth', 2); % Red solid line, line width of 2
% Using spline interpolation to plot a curve
plot(x, y, 'b-', 'LineWidth', 2); % Blue solid line, line width of 2
% Using Bezier curves to plot a curve
plot(x, y, 'g-', 'LineWidth', 2); % Green solid line, line width of 2
```
# Real-Time Data Acquisition and Preprocessing
#### Real-Time Data Acquisition
Real-time data acquisition is the basis of dynamic curve plotting and requires using appropriate sensors or data acquisition devices to obtain real-time data. MATLAB offers a variety of functions for data acquisition, such as `daqread` and `serial`. These functions allow users to configure data acquisition parameters, such as sampling rate, number of channels, and data type.
```matlab
% Using daqread function to acquire data from a data acquisition card
data = daqread('myDAQ', 1000, 'Voltage');
% Using serial function to acquire data from a serial port
data = serial('COM1', 'BaudRate', 9600, 'DataBits', 8, 'Parity', 'none', 'StopBits', 1);
fopen(data);
data = fread(data, 1000);
fclose(data);
```
#### Data Preprocessing
Before plotting a curve, acquired data often needs to be preprocessed to remove noise, anomalies, and unnecessary trends. MATLAB provides various data preprocessing functions, such as `filter`, `detrend`, and `interp1`.
```matlab
% Using filter function to remove noise
filteredData = filter('lowpass', data, 0.1);
% Using detrend function to remove linear trends
detrendedData = detrend(data);
% Using interp1 function to interpolate missing data
interpolatedData = interp1(1:length(data), data, linspace(1, length(data), 1000));
```
### Curve Plotting and Updating
#### Curve Plotting
After preprocessing the data, you can use the `plot` or `scatter` function to plot curves. The `plot` function draws a line chart connecting points, while the `scatter` function draws discrete points.
```matlab
% Using plot function to draw a line chart
plot(time, data);
% Using scatter function to draw a scatter plot
scatter(time, data);
```
#### Curve Updating
The key to dynamic curve plotting is real-time updating of the curve. MATLAB provides the `animatedline` function, which allows users to create animated curves and automatically update the curve when data is updated.
```matlab
% Creating an animated curve object
animatedLine = animatedline;
% Real-time updating of the curve
while true
% Obtaining new data
newData = daqread('myDAQ', 1);
% Updating curve data
addpoints(animatedLine, time, newData);
% Drawing the curve
drawnow;
end
```
### Interactive Operations and Visualization
#### Interactive Operations
MATLAB provides a variety of interactive operation tools that allow users to zoom, pan, and rotate curves. These tools can be used through the graphical user interface (GUI) or programmatically.
```matlab
% Using the zoom function to zoom in on a curve
zoom on;
% Using the pan function to pan a curve
pan on;
% Using the rotate3d function to rotate a curve
rotate3d on;
```
#### Visualization
In addition to basic curve plotting, MATLAB also offers various visualization tools, such as `colorbar`, `legend`, and `title`. These tools can help users enhance the readability and understanding of curves.
```matlab
% Adding a color bar
colorbar;
% Adding a legend
legend('Data 1', 'Data 2');
% Adding a title
title('Real-Time Data Visualization');
```
# Advanced Applications of MATLAB Dynamic Curve Plotting
### Parallel Plotting of Multiple Curves
In practical applications, it is often necessary to plot multiple curves simultaneously to compare or analyze different data sources. MATLAB provides various methods to achieve parallel plotting of multiple curves.
**Method One: Using the `plot` Function**
The `plot` function can plot multiple datasets simultaneously, with each dataset corresponding to a curve. The syntax is as follows:
```matlab
plot(x1, y1, 'color1', 'linewidth1', 'linestyle1', ..., xn, yn, 'colorN', 'linewidthN', 'linestyleN')
```
**Parameter Explanation:**
* `x1`, `y1`, ..., `xn`, `yn`: The datasets to be plotted
* `color1`, ..., `colorN`: The colors of the curves
* `linewidth1`, ..., `linewidthN`: The line widths of the curves
* `linestyle1`, ..., `linestyleN`: The line styles of the curves
**Code Block:**
```matlab
% Defining data
x1 = 1:10;
y1 = rand(1, 10);
x2 = 1:10;
y2 = rand(1, 10);
% Plotting multiple curves
figure;
plot(x1, y1, 'b', 'LineWidth', 2, 'LineStyle', '-');
hold on;
plot(x2, y2, 'r', 'LineWidth', 1, 'LineStyle', '--');
hold off;
% Adding a legend
legend('Curve 1', 'Curve 2');
```
**Logical Analysis:**
* The `plot` function is used to draw two curves simultaneously, represented by blue and red.
* The line widths and styles of the curves are set.
* `hold on` and `hold off` are used to control the locking and unlocking of the plotting area to achieve the superimposed drawing of multiple curves.
* A legend is added to distinguish between different curves.
**Method Two: Using the `subplot` Function**
The `subplot` function can divide the plotting area into multiple subplots, with each subplot able to plot one or more curves. The syntax is as follows:
```matlab
subplot(m, n, p)
```
**Parameter Explanation:**
* `m`: The number of rows in the subplot
* `n`: The number of columns in the subplot
* `p`: The position of the current subplot among all subplots
**Code Block:**
```matlab
% Defining data
x1 = 1:10;
y1 = rand(1, 10);
x2 = 1:10;
y2 = rand(1, 10);
% Creating subplots
figure;
subplot(1, 2, 1);
plot(x1, y1, 'b', 'LineWidth', 2, 'LineStyle', '-');
title('Curve 1');
subplot(1, 2, 2);
plot(x2, y2, 'r', 'LineWidth', 1, 'LineStyle', '--');
title('Curve 2');
```
**Logical Analysis:**
* The `subplot` function is used to create a plotting area with two subplots.
* Curve 1 is drawn in the first subplot, and Curve 2 is drawn in the second subplot.
* The line widths, styles, and titles of the curves are set.
### Curve Fitting and Prediction
Curve fitting refers to finding an optimal curve to approximately describe the trend of data based on given data points. MATLAB provides various curve fitting methods, including polynomial fitting, exponential fitting, and logarithmic fitting.
**Method: Using the `fit` Function**
The `fit` function can perform various types of curve fitting on data. The syntax is as follows:
```matlab
fit(x, y, 'fittype')
```
**Parameter Explanation:**
* `x`: Independent variable data
* `y`: Dependent variable data
* `fittype`: The type of fitting, such as `'poly1'` (first-degree polynomial) or `'exp1'` (first-order exponential)
**Code Block:**
```matlab
% Defining data
x = 1:10;
y = rand(1, 10);
% First-degree polynomial fitting
fitresult = fit(x, y, 'poly1');
% Obtaining the fitted curve
fitcurve = fitresult.FittedModel;
% Plotting the original data and the fitted curve
figure;
plot(x, y, 'o');
hold on;
plot(x, fitcurve(x), 'r', 'LineWidth', 2);
hold off;
% Displaying the fitting equation
disp(['Fitting equation: ' char(fitresult.Formula)]);
```
**Logical Analysis:**
* The `fit` function is used to perform first-degree polynomial fitting on the data.
* The fitted curve is obtained and plotted over the original data.
* The fitting equation is displayed.
### Data Analysis and Visualization
MATLAB provides a rich library of functions that can be used for various data analysis and visualization operations.
**Data Analysis:**
***Statistical Analysis:** Calculating mean, variance, standard deviation, and other statistical indicators.
***Regression Analysis:** Establishing linear and nonlinear regression models to analyze the relationships between data.
***Classification Analysis:** Using machine learning algorithms to classify data.
**Data Visualization:**
***Bar Chart:** Showing the distribution of data across different categories.
***Pie Chart:** Showing the proportion of different parts in the whole.
***Scatter Plot:** Showing the relationship between two variables.
***Heatmap:** Showing the values of elements in a matrix.
**Code Block:**
```matlab
% Defining data
data = rand(10, 5);
% Statistical Analysis: Calculating the mean
mean_data = mean(data);
% Regression Analysis: Establishing a linear regression model
model = fitlm(data(:, 1), data(:, 2));
% Data Visualization: Plotting a heatmap
figure;
heatmap(data);
```
**Logical Analysis:**
* Statistical analysis is performed on the data, and the mean is calculated.
* A linear regression model is established to analyze the relationship between two variables.
* A heatmap is used to visualize the data matrix.
# Real-Time Stock Price Monitoring
Real-time stock price monitoring is a typical application of dynamic curve plotting. By real-time acquisition of stock price data and plotting dynamic curves, investors can visually understand stock price trends and make timely trading decisions.
**Steps:**
1. **Data Acquisition:** Using MATLAB's `quandl` toolbox to obtain stock price data. For example, to get real-time price data for Apple stock (AAPL):
```matlab
% Using the quandl toolbox to get Apple stock data
AAPL_data = quandl('WIKI/AAPL');
```
2. **Curve Plotting:** Using the `plot` function to plot the stock price curve. For example, to plot the last 5 days of Apple stock prices:
```matlab
% Get the last 5 days of data
AAPL_data_5d = AAPL_data(end-4:end, :);
% Plot the curve
plot(AAPL_data_5d.Date, AAPL_data_5d.Close);
xlabel('Date');
ylabel('Close Price');
title('Apple Stock Price');
```
3. **Real-Time Update:** Using the `timer` function to set a timer to update stock price data and curves at regular intervals. For example, update every 5 seconds:
```matlab
% Set a timer to update every 5 seconds
timerObj = timer('TimerFcn', @update_plot, 'Period', 5, 'ExecutionMode', 'fixedRate');
% Timer callback function
function update_plot(obj, event)
% Get the latest data
new_data = quandl('WIKI/AAPL');
% Update the curve
plot(new_data.Date, new_data.Close);
xlabel('Date');
ylabel('Close Price');
title('Apple Stock Price');
end
% Start the timer
start(timerObj);
```
4. **Interactive Operations:** Using the `datacursormode` function to enable data cursors, allowing users to hover over the curve to view the stock price at specific points.
```matlab
% Enable data cursor
datacursormode on;
```
With these steps, a dynamic stock price monitoring system can be created to help investors stay informed about real-time stock market developments.

 百万级
高质量VIP文章无限畅学
百万级
高质量VIP文章无限畅学
 千万级
优质资源任意下载
千万级
优质资源任意下载
 C知道
免费提问 ( 生成式Al产品 )
C知道
免费提问 ( 生成式Al产品 )
0
0
相关推荐

专栏目录
最低0.47元/天 解锁专栏
买1年送3月
百万级
高质量VIP文章无限畅学
千万级
优质资源任意下载
C知道
免费提问 ( 生成式Al产品 )
最新推荐
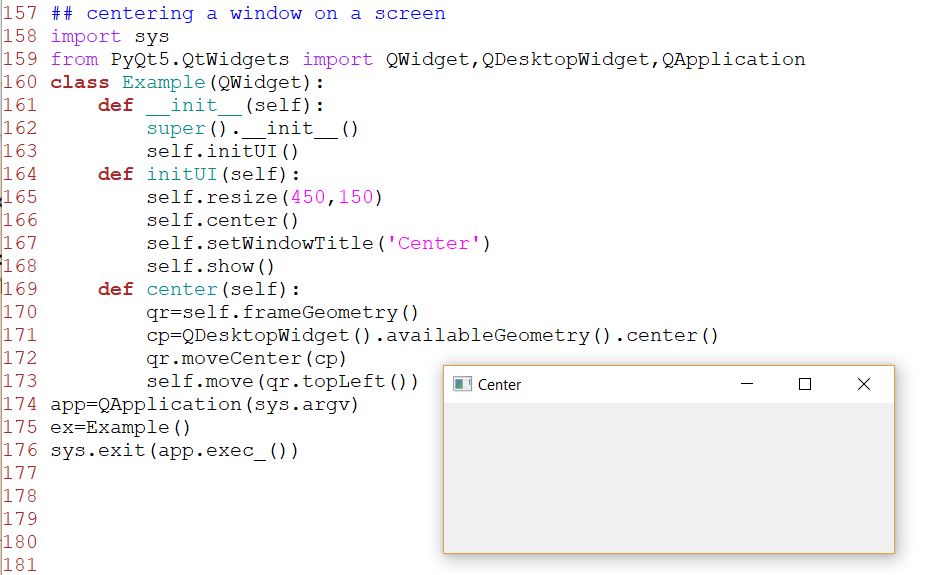
【Python GUI开发必修课】:PyQt5快速入门与实用技巧指南
# 摘要
PyQt5是一个跨平台的GUI工具包,用于创建具有丰富功能的桌面应用程序。本文首先概述了PyQt5的基本概念及开发环境的搭建方法。接着详细介绍了PyQt5的基础组件和布局管理技术,包括窗口、对话框以及各种控件的使用和布局策略。进一步地,本文探讨了高级界面设计、事件处理机制、状态管理和多线程编程。实战演练章节深入分析了
剖析MATRIX核心:硬件组件与工作原理深度解读

# 摘要
本文对MATRIX系统的核心硬件组件进行了全面的概述和深入分析。首先介绍了处理器架构的设计和多线程与并行处理技术,以及处理器与外围设备的交互方式。其次,探讨了 MATRIX存储解决方案,包括内存技术、存储介质的演进及存储系统的可靠性和性能提升。接着,本文深入解析了 MATRIX网络通信机制,涉及网络硬件功能、高速网络技术和网络
深入浅出MySQL递归查询:父子关系探索与自定义函数应用

# 摘要
本文详细探讨了MySQL中递归查询的应用与优化。首先概述了递归查询的基本概念、用途及其在数据库中的应用场景。其次,深入理解递归查询的工作原理,包括其数据结构基础和迭代过程,以及关键技术点,如公共表表达式(CTE)和递归终止条件的重要性。接着,本文实践了父子关系数据模型的建立与递归查询,强调了递归查询性能的优化方法。
【数控车床保养秘诀】:提升性能,延长寿命的终极技巧

# 摘要
数控车床的高效运行对于精密制造至关重要。本文强调了数控车床保养的重要性,并提供了基础维护、高级技巧和性能优化的详尽知识。文章从日常清洁与润滑、部件检查、校准与调整三个方面深入探讨了基础维护知识,进而阐述了预防性维护策略、故障诊断与快速修复、数控系统的维护与升级等高级技巧。此外,还介绍了提升加工精度、能效管理与节能措施、以及自动化和智能化升级的路径。最后,通过案例分析的
【Oracle数据库大升级】:11g到12c,你准备好了吗?
# 摘要
Oracle数据库作为企业级应用的核心组件,其升级过程对于确保数据的完整性、系统的稳定性和性能的优化至关重要。本文首先概述了Oracle数据库升级的意义和概要,随后详细对比了Oracle 11g与12c的主要功能差异,特别是在多租户架构、In-Memory列存储、性能优化、安全性与可用性等方面的革新。在升级准备方面,本文探讨了系统评估、升级策略制定以及测试与验证的重要性。针对Oracle 1
深入浅出:软件工程可行性分析的原理与实践
# 摘要
本文综合探讨了软件工程中的可行性分析,包括需求分析、技术评估、经济分析、法律与市场调查等多个关键维度。首先,介绍了软件工程可行性分析的重要性和目的,接着通过理论基础与实践案例详细阐述了从用户需求获取到需求规格说明的系统化过程。技术可行性分析章节着重于技术评估流程和原型开发,以及技术选择的决策过程。经济可行性分析深入研究了成本效益、投资回收期和净现值等评价方法,同时引入了敏感
【UXM配置流程详解】:从零开始设置5GNR网络

# 摘要
随着5G网络技术的快速发展,5GNR(New Radio)作为最新一代的无线接入技术,对网络基础配置与优化提出了新的挑战。本文详细介绍了5GNR网络的基础概念、配置目标、理论基础及实际操作步骤。首先概述了5GNR的关键技术特点和网络架构,随后深入探讨了无线协议栈中的物理层、MAC/PHY交互机制以及RRC协议。接着,文章指导读者进行5GNR网络的初始配置,包括设备的准备、连接和基于UXM仪表的配置流程,以
【自动化塑性区体积计算】:Oracle存储过程编写秘籍
# 摘要
Oracle存储过程是数据库管理和应用开发中的关键组件,能够执行复杂的数据操作和业务逻辑。本文首先概述了Oracle存储过程的基础知识,随后深入探讨其编程细节,包括核心组成、控制结构、逻辑流程以及高级特性如触发器、动态SQL的应用等。文章还实践性地介绍了存储过程在自动化塑性区体积计算中的应用,以及性能优化和异常数据处理策略。进阶技巧和维护部分强调了
电气机械热管理:关键问题与优化方法,专家级指导

# 摘要
随着电气机械领域的快速发展,热管理已成为保证设备性能和延长使用寿命的关键因素。本文首先概述了电气机械热管理的基本概念,随后深入探讨了热管理的理论基础,包括热力学原理、热源分析和系统方法。在诊断与评估部分,本文介绍了热问题的诊断技术和性能评估方法,并通过案例分析展示了实际应用中热管理问题的处理和解决策略。优化实践章节着重于冷却系统、
无人机航测图像校正指南:3步修正畸变,精准提升测量精度

# 摘要
无人机航测图像校正技术是确保图像质量与准确性的重要过程。本文首先概述了无人机航测图像校正的基本概念,随后深入探讨了图像畸变的理论基础,包括不同类型的畸变及成因,以及畸变模型的建立。第三章详述了图像校正的关键技术,包括畸变参数的获取与计算、校正算法的实现以及校正效果的评估与优化。第四章介绍了图像校正工具和实际应
资源上传下载、课程学习等过程中有任何疑问或建议,欢迎提出宝贵意见哦~我们会及时处理!
点击此处反馈


专栏目录
最低0.47元/天 解锁专栏
买1年送3月
百万级
高质量VIP文章无限畅学
千万级
优质资源任意下载
C知道
免费提问 ( 生成式Al产品 )