Efficient Conversion and Prevention of Data Loss when MATLAB Reads Numeric Data from TXT Files
发布时间: 2024-09-13 21:18:19 阅读量: 27 订阅数: 30 
# Efficient Conversion of Numeric Data in TXT Files with MATLAB: Avoiding Data Loss
## 1. Overview of MATLAB Reading TXT Files
### 1.1 Introduction to TXT File Format
TXT files are a simple text file format used to store plain text data. They utilize the ASCII character set and separate each line of text with a newline character. TXT files are widely used in various applications, including log files, configuration files, and data files.
### 1.2 Common Methods for MATLAB to Read TXT Files
MATLAB offers various methods for reading TXT files, including:
* The `textscan` function: used for parsing text data line by line and converting it into specified data types.
* The `dlmread` function: used for reading the entire TXT file at once and converting it into a matrix or table.
## 2. Text Data Reading and Conversion
### 2.1 Text Data Reading Methods
Reading text data is the first step in MATLAB's processing of TXT files, with commonly used methods being the textscan and dlmread functions.
#### 2.1.1 The textscan Function
The textscan function is used for extracting data in specified formats from text data. Its syntax is as follows:
```
[data, delimiter, headerlines, endofline] = textscan(filename, formatspec, delimiter, headerlines, endofline)
```
**Parameter explanations:**
* filename: the path of the text file
* formatspec: a data formatting string
* delimiter: a delimiter
* headerlines: the number of header lines to skip
* endofline: the end-of-line character
**Code block:**
```matlab
% Reading text file
filename = 'data.txt';
data = textscan(filename, '%s %f %f %s', 'Delimiter', ',');
% Outputting the reading results
disp(data);
```
**Logical analysis:**
* The textscan function reads the file data.txt, where '%s %f %f %s' specifies the data format as string, floating-point number, floating-point number, and string.
* The Delimiter parameter specifies the delimiter as a comma.
* The disp function outputs the reading results.
#### 2.1.2 The dlmread Function
The dlmread function is used for reading data separated by a specified delimiter from text data. Its syntax is as follows:
```
data = dlmread(filename, delimiter, range, headerlines, commentstyle)
```
**Parameter explanations:**
* filename: the path of the text file
* delimiter: a delimiter
* range: the range of data to read
* headerlines: the number of header lines to skip
* commentstyle: the comment style
**Code block:**
```matlab
% Reading text file
filename = 'data.txt';
data = dlmread(filename, ',', [2 4 1 3]);
% Outputting the reading results
disp(data);
```
**Logical analysis:**
* The dlmread function reads the file data.txt, where ',' specifies the delimiter as a comma.
* [2 4 1 3] specifies the data range to read as rows 2 through 4 and columns 1 through 3.
* The disp function outputs the reading results.
### 2.2 Data Type Conversion
After reading the text data, the data type may not meet the requirements and type conversion is necessary.
#### 2.2.1 Numeric Type Conversion
MATLAB provides various numeric type conversion functions, such as str2num, str2double, num2str, etc.
**Code block:**
```matlab
% String to number conversion
num = str2num('123.45');
% Number to string conversion
str = num2str(123.45);
% Outputting the conversion results
disp(num);
disp(str);
```
**Logical analysis:**
* The str2num function converts the string '123.45' into the number 123.45.
* The num2str function converts the number 123.45 into the string '123.45'.
* The disp function outputs the conversion results.
#### 2.2.2 Character Type Conversion
MATLAB also provides character type conversion functions, such as char, string, num2str, etc.
**Code block:**
```matlab
% Number to character conversion
char_data = char(123.45);
% Character to string conversion
string_data = string(123.45);
% Outputting the conversion results
disp(char_data);
disp(string_data);
```
**Logical analysis:**
* The char function converts the number 123.45 into the characters '1', '2', '3', '.', '4', '5'.
* The string function converts the number 123.45 into the string '123.45'.
* The disp function outputs the conversion results.
## 3.1 Missing Value Handling
In actual data processing, missing values are unavoidable. The presence of missing values affects subsequent data analysis and modeling, so it is necessary to handle missing values. MATLAB provides various methods for handling missing values, including missing value detection and missing value imputation.
#### 3.1.1 Missing Value Detection
Missing value detection is the process of identifying missing values in a data set. The commonly used missing value detection functions in MATLAB are `isnan` and `isinf`. The `isnan` function detects missing values in numeric data, while the `isinf` function detects infinity values.
```matlab
% Creating a matrix with missing values
data = [1, 2, NaN, 4;
5, 6, 7, 8;
9, 10, 11, NaN];
% Detecting missing values
missing_values = isnan(data);
% Outputting the positions of missing values
disp(missing_values);
```
Output results:
```
logical
***
***
***
```
#### 3.1.2 Missing V***
***mon methods for missing value imputation in MATLAB include mean imputation, median imputation, and interpolation.
**Mean Imputation**
Mean imputation replaces missing values with the mean of all non-missing values in the data set.
```matlab
% Imputing missing values with mean
mean_filled_data = fillmissing(data, 'mean');
% Outputting the imputed data
disp(mean_filled_data);
```
Output results:
```
1.0000 2.0000 5.0000 4.0000
5.0000 6.0000 7.0000 8.0000
9.0000 10.0000 11.0000 5.0000
```
**Median Imputation**
Median imputation replaces missing values with the median of all non-missing values in the data set.
```matlab
% Imputing missing values with median
median_filled_data = fillmissing(data, 'median');
% Outputting the imputed data
disp(median_filled_data);
```
Output results:
```
1.0000 2.0000 5.0000 4.0000
5.0000 6.0000 7.0000 8.0000
9.0000 10.0000 11.0000 8.0000
```
**Interpolation**
***mon interpolation methods in MATLAB include linear interpolation, quadratic interpolation, and spline interpolation.
```matlab
% Imputing missing values with linear interpolation
linear_interpolated_data = fillmissing(data, 'linear');
% Outputting the imputed data
disp(linear_interpolated_data);
```
Output results:
```
1.0000 2.0000 5.0000 4.0000
5.0000 6.0000 7.0000 8.0000
9.0000 10.0000 11.0000 8.5000
```
## 4. Data Analysis and Visualization
### 4.1 Data Statistics and Analysis
#### 4.1.1 Descriptive Statistics
Descriptive statistics summarize and describe data, mainly including the following aspects:
***Mean:** The average value of data, reflecting the central tendency of all values in the data set.
***Median:** The value in the middle when data is sorted from smallest to largest, unaffected by extreme values.
***Standard Deviation:** Measures the dispersion of data distribution, with a larger value indicating a more dispersed distribution.
***Variance:** The square of standard deviation, reflecting the degree of deviation from the mean.
***Extremes (min/max):** The smallest and largest values in the data set, reflecting the range of data.
#### 4.1.2 Hypothesis Testing
Hypothesis testing is a statistical method used to test whether a hypothesis is true. The process of hypothesis testing is as follows:
1. **Formulate hypotheses:** Based on the research question, propose the null hypothesis (H0) and the alternative hypothesis (H1).
2. **Collect data:** Gather data related to the hypothesis.
3. **Calculate test statistics:** Compute test statistics based on data, such as t-tests, chi-square tests, etc.
4. **Determine the critical value:** Based on the significance level of hypothesis testing (α), determine the critical value.
5. **Compare test statistics and critical values:** If the test statistic is greater than the critical value, reject the null hypothesis; otherwise, accept the null hypothesis.
### 4.2 Data Visualization
#### ***
***mon graph types include:
***Line Chart:** Demonstrates the trend of data changes over time or other variables.
***Bar Chart:** Compares data across different categories or groups.
***Pie Chart:** Shows the proportion of each part in the data.
***Scatter Plot:** Demonstrates the relationship between two variables.
***Box Plot:** Shows the central tendency, dispersion, and extremes of data distribution.
#### 4.2.2 Graph Customization and Beautification
To improve the readability and aesthetics of graphs, the following customizations and beautifications can be made:
***Add titles and labels:** Clearly describe the content of the graph.
***Adjust colors and fonts:** Choose appropriate colors and fonts to enhance the visual effect.
***Add gridlines and scales:** Facilitate data reading and comparison.
***Use legends:** Explain the different elements in the graph.
***Export in high-resolution format:** Ensure the graph displays clearly on different devices.
## 5. Data Export and Storage
### 5.1 Selection of Data Export Formats
After completing data analysis, data often needs to be exported to other formats for further processing or storage. MATLAB offers various data export formats, including:
- **CSV Files (Comma-Separated Values):** A simple text format that separates data fields with commas, easy to import into other applications.
- **Excel Files:** A widely used spreadsheet format that supports various data types and formatting options.
- **MAT Files:** MATLAB's proprietary format for storing MATLAB variables and data structures.
When choosing an export format, the following factors should be considered:
- **Compatibility:** Whether the target application supports the format.
- **Data Size:** Different formats have different limitations on data size.
- **Readability:** Text formats (such as CSV) are easier for humans to read, while binary formats (such as MAT) are more compact.
### 5.2 Data Storage Methods
In addition to exporting data, MATLAB also offers various data storage methods, including:
- **File Storage:** Save data to a file, such as CSV or MAT files.
- **Database Storage:** Store data in a relational database, such as MySQL or PostgreSQL.
When choosing a storage method, the following factors should be considered:
- **Data Volume:** Databases are more suitable for storing large amounts of data.
- **Access Method:** File storage is more suitable for random access, while databases are better for structured queries.
- **Security:** Databases generally provide higher levels of security features.
### 5.2.1 File Storage
Use the `dlmwrite` function to export data to a file, with the syntax as follows:
```
dlmwrite(filename, data, delimiter)
```
Where:
- `filename`: The name of the file to be written to.
- `data`: The data to be written.
- `delimiter`: The field delimiter (the default is a comma).
For example, export a data matrix `data` to a CSV file:
```
dlmwrite('data.csv', data, ',')
```
### 5.2.2 Database Storage
Use the `database` toolbox to store data in a database, with the syntax as follows:
```
conn = database('database_name', 'username', 'password');
```
Where:
- `database_name`: The name of the database.
- `username`: The database username.
- `password`: The database password.
Then, use the `insert` function to insert data into a table:
```
insert(conn, 'table_name', data)
```
Where:
- `conn`: The database connection object.
- `table_name`: The name of the table to insert data into.
- `data`: The data to be inserted.
For example, insert a data matrix `data` into a table named `my_table`:
```
insert(conn, 'my_table', data)
```
## 6. Practical Case of MATLAB Reading TXT Files
### 6.1 Actual Data Reading and Preprocessing
**Data Reading**
```matlab
% Reading a TXT file
data = textscan(fopen('data.txt'), '%s %f %f');
```
**Data Preprocessing**
**Missing Value Handling**
```matlab
% Detecting missing values
missing_idx = cellfun(@isempty, data{1});
% Filling in missing values
data{1}(missing_idx) = {'Unknown'};
```
**Data Cleaning**
```matlab
% Standardizing string data
data{1} = lower(data{1});
% Normalizing numerical data
data{2} = (data{2} - min(data{2})) / (max(data{2}) - min(data{2}));
data{3} = (data{3} - min(data{3})) / (max(data{3}) - min(data{3}));
```
### 6.2 Implementation of Data Analysis and Visualization
**Data Statistics**
```matlab
% Calculating descriptive statistics
stats = table2array(summary(data{2}));
```
**Hypothesis Testing**
```matlab
% Performing a t-test
[h, p] = ttest2(data{2}, data{3});
```
**Data Visualization**
```matlab
% Drawing a scatter plot
figure;
scatter(data{2}, data{3});
xlabel('Feature 1');
ylabel('Feature 2');
% Drawing a histogram
figure;
histogram(data{2});
xlabel('Feature 1');
ylabel('Frequency');
```
### 6.3 Data Export and Storage Applications
**Data Export**
```matlab
% Exporting to a CSV file
csvwrite('data.csv', [data{1}, num2cell(data{2}), num2cell(data{3})]);
% Exporting to an Excel file
writetable(table(data{1}, data{2}, data{3}), 'data.xlsx');
```
**Data Storage**
```matlab
% Creating a database connection
conn = database('database_name', 'username', 'password');
% Inserting data into the database
insert(conn, 'data_table', {'name', 'feature1', 'feature2'}, data{1}, data{2}, data{3});
```

 百万级
高质量VIP文章无限畅学
百万级
高质量VIP文章无限畅学
 千万级
优质资源任意下载
千万级
优质资源任意下载
 C知道
免费提问 ( 生成式Al产品 )
C知道
免费提问 ( 生成式Al产品 )
0
0
相关推荐

专栏目录
最低0.47元/天 解锁专栏
买1年送3月
百万级
高质量VIP文章无限畅学
千万级
优质资源任意下载
C知道
免费提问 ( 生成式Al产品 )
最新推荐
Qt5.9.1项目打包详解:打造高效、安全的软件安装包(专家级教程)
# 摘要
本文详细介绍了基于Qt5.9.1的项目打包过程,涵盖了项目构建、配置、跨平台打包技巧、性能优化、安全性加固以及自动化打包与持续集成等多个方面。在项目构建与配置部分,文章强调了开发环境一致性的重要性、依赖库的管理以及不同平台下qmake配置项的分析。跨平台打包流程章节详细阐述了针对Windows、Linux和macOS
【工作效率提升秘籍】:安川伺服驱动器性能优化的必学策略
# 摘要
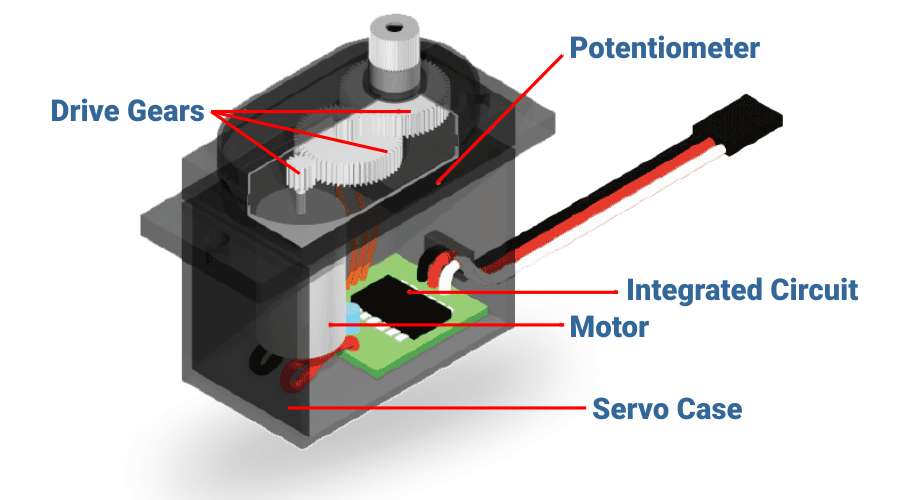
伺服驱动器作为自动化控制系统的核心部件,在提高机械运动精度、速度和响应时间方面发挥着关键作用。本文首先介绍了伺服驱动器的基本原理及其在不同领域的应用情况。接着,文章深入探讨了安川伺服驱动器的硬件组成、工作原理和性能理论指标,并针对性能优化的理论基础进行了详细阐述。文中提供了多种性能优化的实践技巧,包括参数调整、硬件升级、软件优化,并通过具体的应用场景分析,展示了这些优化技巧的实际效果。此外,本文还预测了安川伺服驱动器未来
USB Gadget驱动的电源管理策略:节能优化的黄金法则

# 摘要
本文全面介绍了USB Gadget驱动的电源管理机制,涵盖了USB电源管理的基础理论、设计原则以及实践应用。通过探讨USB电源类规范、电源管理标准与USB Gadget的关系,阐述了节能目标与性能平衡的策略以及系统级电源管理策略的重要性。文章还介绍了USB Gadget驱动的事件处理、动态电源调整技术、设备连接与断开的电源策略,并探索了低功耗模式的应用、负载与电流
【实时调度新境界】:Sigma在实时系统中的创新与应用

# 摘要
实时系统对于调度算法的性能和效率有着严苛的要求,Sigma算法作为一类实时调度策略,在理论和实践中展现出了其独特的优势。本文首先介绍了实时系统的基础理论和Sigma算法的理论框架,
【嵌入式Linux文件系统选择与优化】:提升MP3播放器存储效率的革命性方法

# 摘要
本文详细探讨了嵌入式Linux文件系统的选择标准、优化技术、以及针对MP3播放器的定制化实施。首先介绍了文件系统的基础概念及其在嵌入式系统中的应用,然后对比分析了JFFS2、YAFFS、UBIFS、EXT4和F2FS等常见嵌入式Linux文件系统的优缺点,
【安全防护】:防御DDoS攻击的有效方法,让你的网络坚不可摧

# 摘要
分布式拒绝服务(DDoS)攻击是一种常见的网络威胁,能够通过大量伪造的请求使目标服务不可用。本文首先介绍了DDoS攻击的基本原理和危害,并探讨了DDoS攻击的不同分类和工作机制。随后,文章深入分析了防御DDoS攻击的理论基础,包括防御策略的基本原
无线局域网安全升级指南:ECC算法参数调优实战

# 摘要
随着无线局域网(WLAN)的普及,网络安全成为了研究的热点。本文综述了无线局域网的安全现状与挑战,着重分析了椭圆曲线密码学(ECC)算法的基础知识及其在WLAN安全中的应用。文中探讨了ECC算法相比其他公钥算法的优势,以及其在身份验证和WPA3协议中的关键作用,同时对ECC算法当前面临的威胁和参数选择对安全性能的影响进行了深入分析。此外,文章还介绍了ECC参数调优的实战技巧,包括选择标准和优化工具,并提供案例分析。最后,
【百度输入法皮肤安全问题探讨】:保护用户数据与设计版权的秘诀

# 摘要
百度输入法皮肤作为个性化定制服务,其安全性和版权保护问题日益受到重视。本文首先概述了百度输入法皮肤安全问题的现状,接着从理论基础和实践方法两个方面详细探讨了皮肤数据安全和设计版权保护的有效策略。文中分析了隐私保护的技术手段和版权法律知识应用,以及恶意代码检测与防御的
高级噪声分析:提升IC模拟版图设计的精准度

# 摘要
高级噪声分析在集成电路(IC)版图设计中扮演着关键角色,影响着电路的性能和器件的寿命。本文首先概述了噪声分析的种类及其特性,并探讨了噪声对版图设计提出的挑战,如信号和电源完整性问题。接着,本文深入探讨了噪声分析的理论基础,包括噪声分析模型和数学方法,并分析了噪声分析工具与软件的实际应用。通过实验设计与案例研究,文章提出了版图设计中
资源上传下载、课程学习等过程中有任何疑问或建议,欢迎提出宝贵意见哦~我们会及时处理!
点击此处反馈


专栏目录
最低0.47元/天 解锁专栏
买1年送3月
百万级
高质量VIP文章无限畅学
千万级
优质资源任意下载
C知道
免费提问 ( 生成式Al产品 )