【降维技术精讲】:PCA与t-SNE在Python中的深入实现
发布时间: 2024-08-31 08:10:17 阅读量: 97 订阅数: 52 
# 1. 降维技术概述及应用场景
降维技术是机器学习和数据挖掘领域中不可或缺的一部分。它们旨在简化数据结构,同时保留原始数据的关键特征。降维可以分为两大类:线性降维和非线性降维。线性降维方法如主成分分析(PCA)通过投影将高维数据转换到较低维的空间中,而非线性降维技术如t分布随机邻域嵌入(t-SNE)则尝试保留原始数据的结构特性。
在本章中,我们将首先探讨降维技术的通用概念,包括其重要性、分类和常用技术。接下来,我们将重点介绍这些技术在不同领域的应用场景,如在生物信息学中的基因表达数据分析,在计算机视觉中的图像压缩,在商业智能中的消费者行为模式识别等。通过这些案例,我们将揭示降维技术如何在实际问题中实现数据的可视化、特征提取和噪音过滤,以及如何为后续的分析和学习提供更好的数据基础。
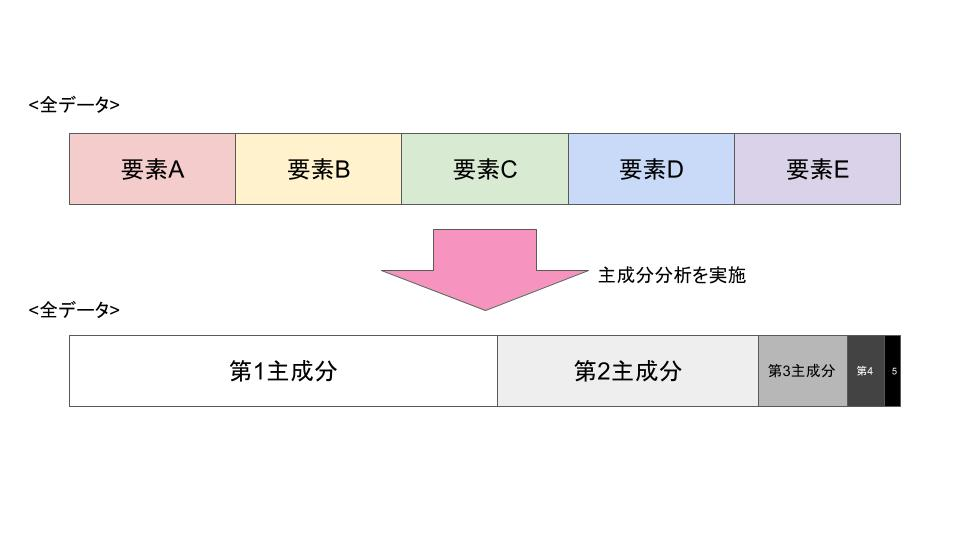
# 2. 主成分分析(PCA)的理论与实践
## 2.1 PCA的数学原理
### 2.1.1 数据集的预处理和标准化
在开始PCA之前,预处理和标准化数据是至关重要的步骤。原始数据往往包含噪声和不同尺度的特征,直接进行PCA可能会导致结果偏向于具有较大方差的特征,从而失去准确性。标准化的目的就是让所有特征对于PCA算法有相同的权重,使得算法可以公平地处理每个特征。
以下是标准化的步骤和对应的Python代码示例:
```python
import numpy as np
# 假设我们有一个数据集X
X = np.array([[1, 2, 3], [4, 5, 6], [7, 8, 9], [10, 11, 12]])
# 对数据集进行标准化处理
from sklearn.preprocessing import StandardScaler
scaler = StandardScaler()
X_scaled = scaler.fit_transform(X)
print(X_scaled)
```
在上述代码中,我们首先导入了`numpy`库用于数据操作,然后创建了一个简单的数据集`X`。接下来,我们使用`sklearn.preprocessing.StandardScaler`类对数据进行标准化。标准化处理确保了每个特征的均值为0,方差为1,这样在应用PCA时,每个特征都能公平地参与到主成分的计算中。
### 2.1.2 协方差矩阵及其特征分解
经过预处理和标准化的数据集,接下来需要计算其协方差矩阵。协方差矩阵是一个描述数据集中各个变量之间线性相关性强度和方向的矩阵。其计算公式为:
\Sigma = \frac{1}{n-1}X^TX
其中,$\Sigma$为协方差矩阵,$X$为标准化后的数据矩阵,$n$为样本数。
协方差矩阵确定了,我们便可以找到其特征值和特征向量,特征值代表了数据在这个方向上的方差大小,而对应的特征向量则指示了数据在特征空间的分布方向。
代码实现和逻辑解释如下:
```python
# 计算协方差矩阵
cov_matrix = np.cov(X_scaled.T)
# 计算特征值和特征向量
eigenvalues, eigenvectors = np.linalg.eig(cov_matrix)
# 输出特征值和特征向量
print("特征值:", eigenvalues)
print("特征向量:\n", eigenvectors)
```
在该代码块中,我们首先使用`numpy`的`cov`函数计算标准化数据的协方差矩阵。然后,通过`linalg.eig`函数来找到协方差矩阵的特征值和特征向量。计算出的特征向量将用于数据的投影,特征值则用于衡量每个主成分的重要性。
## 2.2 PCA在Python中的实现
### 2.2.1 使用scikit-learn实现PCA
scikit-learn库提供了一个非常方便的接口来实现PCA,只需要几行代码,就可以完成从数据预处理到主成分提取的整个过程。以下是使用scikit-learn实现PCA的基本步骤:
```python
from sklearn.decomposition import PCA
# 创建PCA对象,设置要保留的主成分数量
pca = PCA(n_components=2)
# 对数据集X进行PCA降维
X_pca = pca.fit_transform(X_scaled)
print("PCA降维后的数据:", X_pca)
```
在这个代码块中,我们首先导入了`PCA`类,然后创建了一个`PCA`对象,指定了我们想要保留的主成分数量为2。之后,我们使用`fit_transform`方法,将标准化后的数据`X_scaled`进行降维处理,得到降维后的数据`X_pca`。
### 2.2.2 PCA参数调优和结果解释
在PCA的应用中,选择合适的主成分数量是一个重要的决策。我们可以通过分析特征值的大小来决定要保留多少主成分。通常,保留的主成分应当累计解释大部分的数据方差。
下面是使用累积解释方差来决定主成分数量的代码:
```python
# 计算累计解释方差比率
cumulative_variance = np.cumsum(eigenvalues) / np.sum(eigenvalues)
# 输出累计解释方差比率
print("累计解释方差比率:", cumulative_variance)
# 绘制累计解释方差比率图
import matplotlib.pyplot as plt
plt.plot(cumulative_variance)
plt.xlabel('Number of Components')
plt.ylabel('Cumulative Explained Variance')
plt.title('Explained Variance by Different Principal Components')
plt.show()
```
在上述代码中,我们使用了之前计算得到的特征值数组`eigenvalues`,计算了各个主成分对总体方差的贡献,并绘制了一个图表,直观显示了不同主成分解释的累计方差。通过这张图,我们可以直观地选择一个阈值,例如选择解释了85%以上方差的主成分数量。
## 2.3 PCA的实际应用案例
### 2.3.1 高维数据的可视化
PCA的一个重要应用是高维数据的可视化。对于具有大量特征的数据集,我们可以使用PCA将数据投影到2维或3维空间中,以便于观察和分析数据的结构和分布。
以下是使用PCA进行数据可视化的一个例子:
```python
import matplotlib.pyplot as plt
# 使用PCA将数据降维到2维空间
pca = PCA(n_components=2)
X_pca = pca.fit_transform(X_scaled)
# 绘制降维后的数据散点图
plt.scatter(X_pca[:, 0], X_pca[:, 1])
plt.xlabel('Principal Component 1')
plt.ylabel('Principal Component 2')
plt.title('2D Visualization of PCA-Reduced Data')
plt.show()
```
在该代码块中,我们首先执行PCA降维操作,将原始数据集`X_scaled`投影到两个主成分组成的2维空间中。然后,我们使用`matplotlib`库绘制了一个散点图,该图展示了降维后的数据点的分布情况。通过这样的可视化,我们能够快速洞察数据的聚类特性和潜在的结构。
### 2.3.2 提升机器学习模型性能的实例
PCA另一个应用是在预处理阶段帮助提升机器学习模型的性能。通过移除冗余特征和噪声,PCA可以改善模型的训练效率,同时减少过拟合的风险。
举一个简单的例子,假设我们有一个分类

 百万级
高质量VIP文章无限畅学
百万级
高质量VIP文章无限畅学
 千万级
优质资源任意下载
千万级
优质资源任意下载
 C知道
免费提问 ( 生成式Al产品 )
C知道
免费提问 ( 生成式Al产品 )
0
0
相关推荐

专栏简介
本专栏提供了全面的 Python 机器学习算法实现指南,涵盖从数据预处理到模型评估的各个方面。通过深入浅出的讲解和代码实现,专栏帮助初学者和经验丰富的从业者掌握机器学习算法的原理和实践。从线性回归到神经网络,从特征选择到聚类分析,专栏提供了广泛的算法和技术,并通过实际案例研究展示了它们的应用。此外,专栏还探讨了模型评估、超参数调优和集成学习等高级主题,帮助读者打造最佳机器学习模型并提高其性能。
专栏目录
最低0.47元/天 解锁专栏
买1年送3月
百万级
高质量VIP文章无限畅学
千万级
优质资源任意下载
C知道
免费提问 ( 生成式Al产品 )
最新推荐
Keras注意力机制:构建理解复杂数据的强大模型
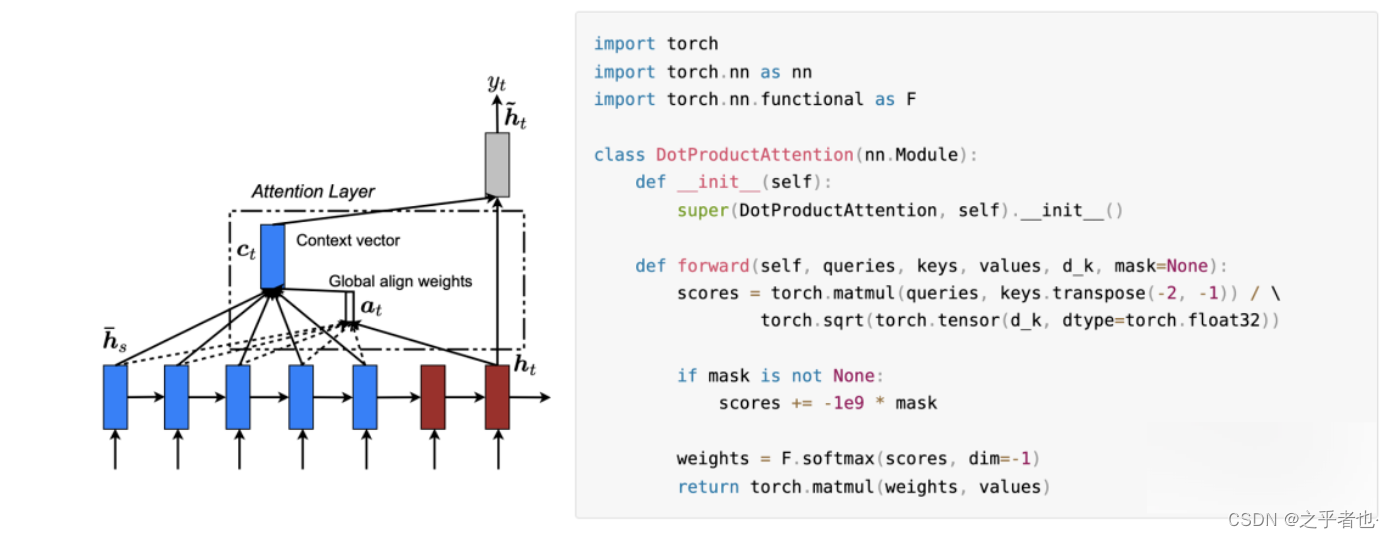
# 1. 注意力机制在深度学习中的作用
## 1.1 理解深度学习中的注意力
深度学习通过模仿人脑的信息处理机制,已经取得了巨大的成功。然而,传统深度学习模型在处理长序列数据时常常遇到挑战,如长距离依赖问题和计算资源消耗。注意力机制的提出为解决这些问题提供了一种创新的方法。通过模仿人类的注意力集中过程,这种机制允许模型在处理信息时,更加聚焦于相关数据,从而提高学习效率和准确性。
## 1.2
PyTorch超参数调优:专家的5步调优指南
# 1. PyTorch超参数调优基础概念
## 1.1 什么是超参数?
在深度学习中,超参数是模型训练前需要设定的参数,它们控制学习过程并影响模型的性能。与模型参数(如权重和偏置)不同,超参数不会在训练过程中自动更新,而是需要我们根据经验或者通过调优来确定它们的最优值。
## 1.2 为什么要进行超参数调优?
超参数的选择直接影响模型的学习效率和最终的性能。在没有经过优化的默认值下训练模型可能会导致以下问题:
- **过拟合**:模型在
Pandas数据转换:重塑、融合与数据转换技巧秘籍
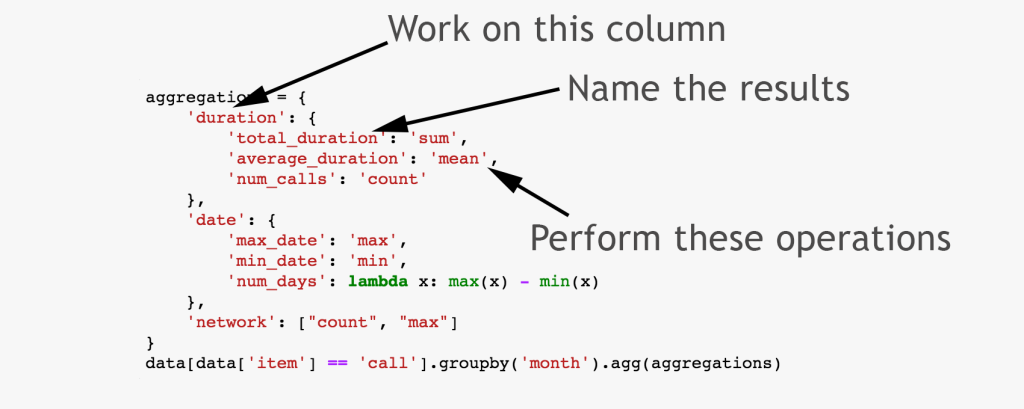
# 1. Pandas数据转换基础
在这一章节中,我们将介绍Pandas库中数据转换的基础知识,为读者搭建理解后续章节内容的基础。首先,我们将快速回顾Pandas库的重要性以及它在数据分析中的核心地位。接下来,我们将探讨数据转换的基本概念,包括数据的筛选、清洗、聚合等操作。然后,逐步深入到不同数据转换场景,对每种操作的实际意义进行详细解读,以及它们如何影响数
【数据集加载与分析】:Scikit-learn内置数据集探索指南
# 1. Scikit-learn数据集简介
数据科学的核心是数据,而高效地处理和分析数据离不开合适的工具和数据集。Scikit-learn,一个广泛应用于Python语言的开源机器学习库,不仅提供了一整套机器学习算法,还内置了多种数据集,为数据科学家进行数据探索和模型验证提供了极大的便利。本章将首先介绍Scikit-learn数据集的基础知识,包括它的起源、
硬件加速在目标检测中的应用:FPGA vs. GPU的性能对比
# 1. 目标检测技术与硬件加速概述
目标检测技术是计算机视觉领域的一项核心技术,它能够识别图像中的感兴趣物体,并对其进行分类与定位。这一过程通常涉及到复杂的算法和大量的计算资源,因此硬件加速成为了提升目标检测性能的关键技术手段。本章将深入探讨目标检测的基本原理,以及硬件加速,特别是FPGA和GPU在目标检测中的作用与优势。
## 1.1 目标检测技术的演进与重要性
目标检测技术的发展与深度学习的兴起紧密相关
NumPy中的文件输入输出:持久化数据存储与读取的4大技巧

# 1. NumPy概述与数据持久化基础
在本章中,我们将对NumPy进行一个初步的探讨,并且将重点放在其数据持久化的基础方面。NumPy是Python中用于科学计算的基础库,它提供了高性能的多维数组对象和用于处理这些数组的工具。对于数据持久化而言,它确保了数据能够在程序运行之间保持可用性。数据持久化是数据科学和机器学习项目中不可或缺的一部分,特别是在处理
【图像分类模型自动化部署】:从训练到生产的流程指南
# 1. 图像分类模型自动化部署概述
在当今数据驱动的世界中,图像分类模型已经成为多个领域不可或缺的一部分,包括但不限于医疗成像、自动驾驶和安全监控。然而,手动部署和维护这些模型不仅耗时而且容易出错。随着机器学习技术的发展,自动化部署成为了加速模型从开发到生产的有效途径,从而缩短产品上市时间并提高模型的性能和可靠性。
本章旨在为读者提供自动化部署图像分类模型的基本概念和流程概览,
【循环神经网络】:TensorFlow中RNN、LSTM和GRU的实现

# 1. 循环神经网络(RNN)基础
在当今的人工智能领域,循环神经网络(RNN)是处理序列数据的核心技术之一。与传统的全连接网络和卷积网络不同,RNN通过其独特的循环结构,能够处理并记忆序列化信息,这使得它在时间序列分析、语音识别、自然语言处理等多
【商业化语音识别】:技术挑战与机遇并存的市场前景分析
# 1. 商业化语音识别概述
语音识别技术作为人工智能的一个重要分支,近年来随着技术的不断进步和应用的扩展,已成为商业化领域的一大热点。在本章节,我们将从商业化语音识别的基本概念出发,探索其在商业环境中的实际应用,以及如何通过提升识别精度、扩展应用场景来增强用户体验和市场竞争力。
## 1.1 语音识别技术的兴起背景
语音识别技术将人类的语音信号转化为可被机器理解的文本信息,它
优化之道:时间序列预测中的时间复杂度与模型调优技巧
# 1. 时间序列预测概述
在进行数据分析和预测时,时间序列预测作为一种重要的技术,广泛应用于经济、气象、工业控制、生物信息等领域。时间序列预测是通过分析历史时间点上的数据,以推断未来的数据走向。这种预测方法在决策支持系统中占据着不可替代的地位,因为通过它能够揭示数据随时间变化的规律性,为科学决策提供依据。
时间序列预测的准确性受到多种因素的影响,例如数据
资源上传下载、课程学习等过程中有任何疑问或建议,欢迎提出宝贵意见哦~我们会及时处理!
点击此处反馈


专栏目录
最低0.47元/天 解锁专栏
买1年送3月
百万级
高质量VIP文章无限畅学
千万级
优质资源任意下载
C知道
免费提问 ( 生成式Al产品 )