处理海量数据:PCA降维算法在高维数据分析中的应用
发布时间: 2024-07-20 13:17:03 阅读量: 42 订阅数: 31 

数据降维三个基本方法:PCA,SVD,CUR。
# 1. 高维数据分析中的挑战**
高维数据分析是当今大数据时代面临的重大挑战。随着数据量的不断增长,数据维度也随之增加。高维数据给数据分析带来了以下挑战:
- **计算复杂度高:**高维数据中的计算量呈指数级增长,导致算法运行时间过长。
- **数据稀疏性:**高维数据中,数据点往往分布在高维空间的稀疏区域,使得数据分析难以有效进行。
- **维度灾难:**当数据维度过高时,数据点的距离和相似度等概念变得难以定义和计算。
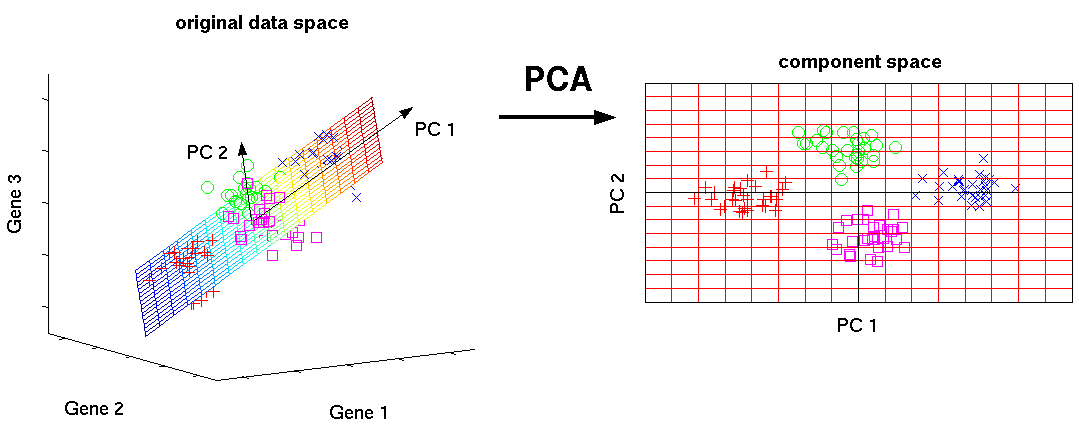
# 2. PCA降维算法原理
PCA(主成分分析)是一种经典的降维算法,广泛应用于高维数据分析中。其基本原理是通过线性变换将高维数据投影到低维空间,从而保留原始数据中最重要的信息。
### 2.1 线性代数基础
PCA算法的基础是线性代数。以下是一些关键概念:
- **向量:**一个有序的数字序列,表示数据点在坐标系中的位置。
- **矩阵:**一个数字表格,表示一组向量之间的关系。
- **协方差矩阵:**一个矩阵,表示一组向量之间的协方差。
- **特征值和特征向量:**协方差矩阵的特征值表示数据方差的方向,特征向量表示这些方向。
### 2.2 协方差矩阵和特征值分解
协方差矩阵描述了数据集中变量之间的协方差。对于一个给定的数据集,协方差矩阵是一个对称矩阵,其元素表示变量之间的协方差。
特征值分解是一种线性代数技术,可以将协方差矩阵分解为特征值和特征向量。特征值表示数据方差的方向,特征向量表示这些方向。
### 2.3 PCA降维过程
PCA降维过程包括以下步骤:
1. **计算协方差矩阵:**计算数据集的协方差矩阵。
2. **特征值分解:**对协方差矩阵进行特征值分解,得到特征值和特征向量。
3. **选择主成分:**选择特征值最大的特征向量作为主成分。
4. **投影数据:**将原始数据投影到主成分空间,得到降维后的数据。
**代码块:**
```python
import numpy as np
# 计算协方差矩阵
covariance_matrix = np.cov(data)
# 特征值分解
eigenvalues, eigenvectors = np.linalg.eig(covariance_matrix)
# 选择主成分
num_components = 2 # 降维到 2 维
principal_components = eigenvectors[:, :num_components]
# 投影数据
reduced_data = np.dot(data, principal_components)
```
**逻辑分析:**
* `np.cov()` 函数计算数据集的协方差矩阵。
* `np.linalg.eig()` 函数对协方差矩阵进行特征值分解,得到特征值和特征向量。
* `eigenvalues` 数组包含特征值,`eigenvectors` 数组包含特征向量。
* `num_components` 变量指定要降维到的维度数。
* `principal_components` 变量包含主成分,即特征值最大的特征向量。
* `np.dot()` 函数将原始

 百万级
高质量VIP文章无限畅学
百万级
高质量VIP文章无限畅学
 千万级
优质资源任意下载
千万级
优质资源任意下载
 C知道
免费提问 ( 生成式Al产品 )
C知道
免费提问 ( 生成式Al产品 )
0
0
相关推荐

专栏简介
本专栏深入探讨了 PCA(主成分分析)降维算法,重点关注其广泛的应用场景。从图像处理到医疗诊断,PCA 已成为提升效率和准确度的关键工具。专栏涵盖了 PCA 的数学推导、在图像识别、文本特征提取、推荐系统、金融数据分析、医疗诊断、异常检测、数据可视化和机器学习中的应用。此外,还探讨了 PCA 的优缺点、变种、实现代码、性能优化、实际应用案例、局限性以及与其他降维算法的比较。通过深入的分析和示例,本专栏为读者提供了全面了解 PCA 降维算法及其在各种领域的强大功能。
专栏目录
最低0.47元/天 解锁专栏
买1年送3月
百万级
高质量VIP文章无限畅学
千万级
优质资源任意下载
C知道
免费提问 ( 生成式Al产品 )
最新推荐
Paddle Fluid环境搭建攻略:新手入门与常见问题解决方案

# 摘要
Paddle Fluid是由百度研发的开源深度学习平台,提供了丰富的API和灵活的模型构建方式,旨在简化深度学习应用的开发与部署。本文首先介绍了Paddle Fluid的基本概念与安装前的准备工作,接着详细阐述了安装流程、基础使用方法、实践应用案例以及性能优化技巧。通过对Paddle Fluid的系统性介绍,本文旨在指导用户快速上手并有效利用Paddle Fluid进行深度学习项
Karel编程语言解析:一步到位,从新手到专家
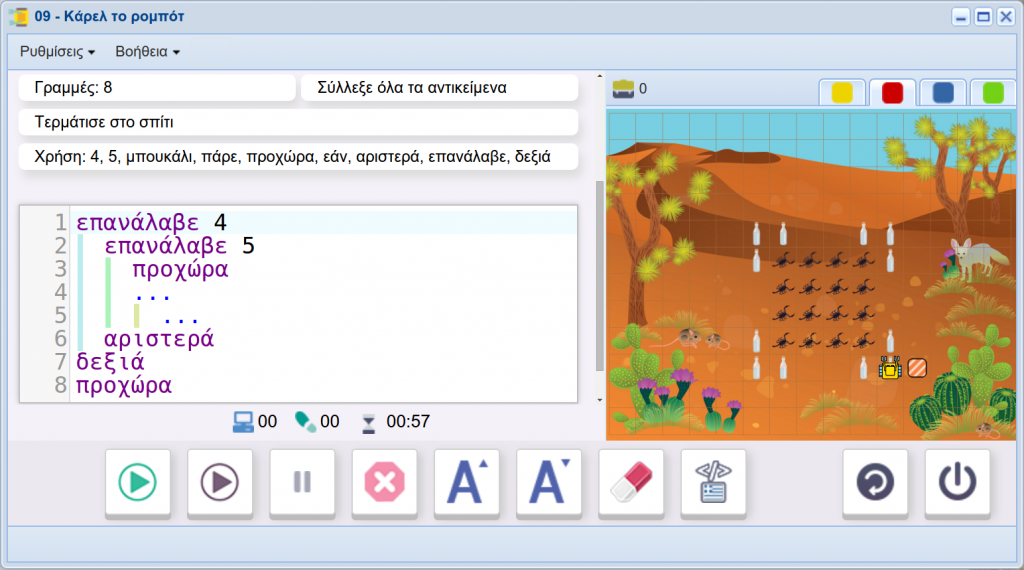
# 摘要
Karel编程语言是一门专为初学者设计的教育用语言,它以其简洁的语法和直观的设计,帮助学习者快速掌握编程基础。本文首先概述了Karel语言的基本概念和语法,包括数据结构、控制结构和数据类型等基础知识。继而深入探讨了Karel的函数、模块以及控制结构在编程实践中的应用,特别强调了异常处理和数据处理的重要性。文章进一步介绍了Karel的高级特性,如面向对象编程和并发编程,以及如何在项目实战中构建、管理和测试
【MSP430微控制器FFT算法全攻略】:一步到位掌握性能优化与实战技巧
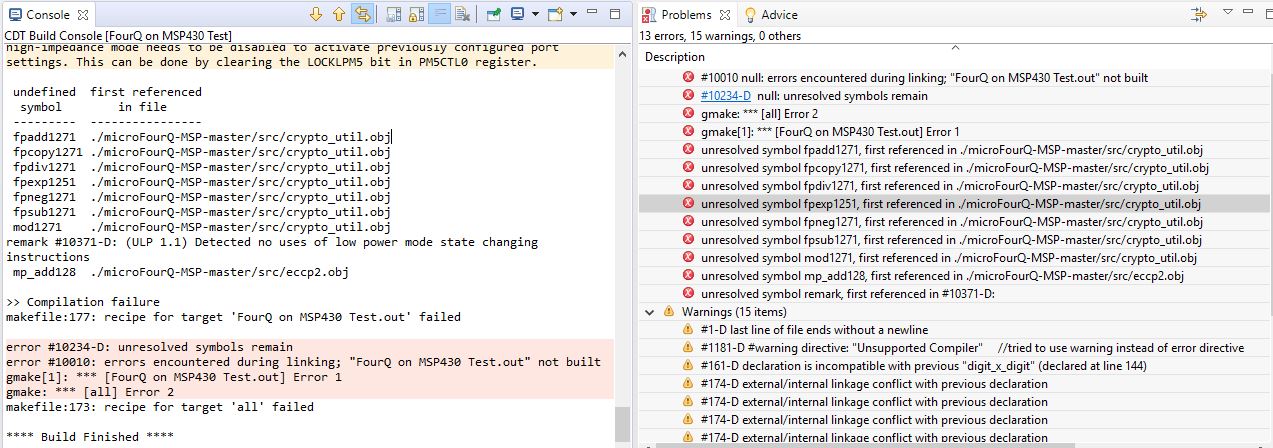
# 摘要
本文全面探讨了MSP430微控制器上实现快速傅里叶变换(FFT)算法的理论基础与性能优化。首先介绍了FFT算法及其在信号处理和通信系统中的应用。随后,文章深入分析了FFT算法在MSP430上的数学工具和优化策略,包括内存管理和计算复杂度降低方法。此外,还讨论了性能测试与分析、实战应用案例研究以及代码解读。最
车载测试新手必学:CAPL脚本编程从入门到精通(全20篇)
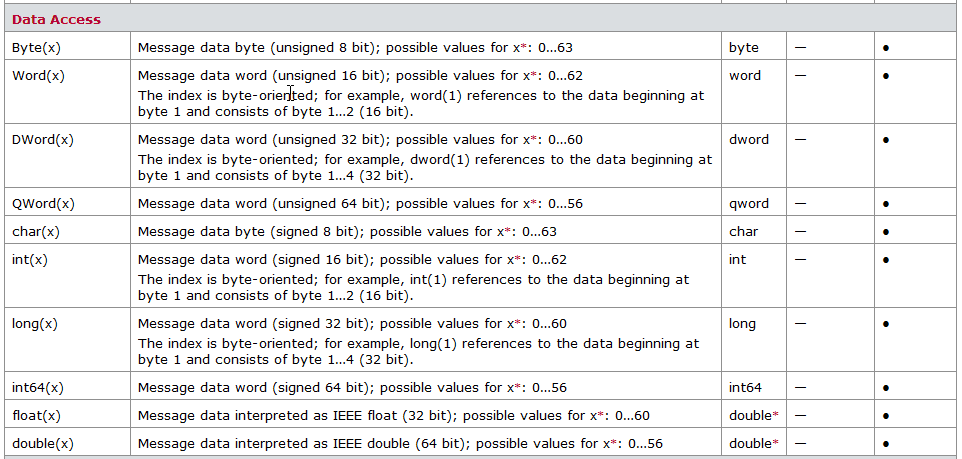
# 摘要
CAPL脚本编程是用于车辆通信协议测试和仿真的一种强大工具。本文旨在为读者提供CAPL脚本的基础知识、语言构造、以及在车载测试中的应用。文章首先介绍了CAPL脚本编程基础和语言构造,包括变量、数据类型、控制结构、函数以及模块化编程。随后,章节深入探讨了CAPL脚本在模拟器与车辆通信中的应用,测试案例的设计与执行,以及异常处理和日志管理。在高级应用部分,本文详细论述
【掌握SimVision-NC Verilog】:两种模式操作技巧与高级应用揭秘
# 摘要
SimVision-NC Verilog是一种广泛应用于数字设计验证的仿真工具。本文全面介绍了SimVision-NC Verilog的基本操作技巧和高级功能,包括用户界面操作、仿真流程、代码编写与调试、高级特性如断言、覆盖率分析、
报表解读大揭秘:ADVISOR2002带你洞悉数据背后的故事

# 摘要
ADVISOR2002作为一款先进的报表工具,对数据解读提供了强大的支持。本文首先对ADVISOR2002进行了概述,并介绍了报表基础,然后深入探讨了数据解读的理论基础,包括数据与信息转化的基本原理、数据质量与管理、统计学在报表解读中的应用等。在实践章节,文章详细阐述了如何导入和整合报表数据,以及使用ADVISOR2002进行分析和解读,同时提供了成功与失败案例的剖析。文章还探讨了高级报表解读技巧与优化,如复杂问题处理和AI技术的应用。最后
【数据可视化】:Origin图表美化,坐标轴自定义与视觉传达技巧

# 摘要
数据可视化是将复杂数据信息转化为图形和图表的过程,以增强信息的可理解性和吸引力。本文从数据可视化的基础知识讲起,深入介绍Origin软件的使用,包括其操作界面、数据输入与管理、图表的创建与编辑,以及数据导入和预览技巧。随后,文章详细探讨了坐标轴的自定义技巧,包括格式化设置、尺度变换、单位转换和对数坐标的特性。接着,文章强调了提升图表视觉效果的重要性,介绍颜色与图
资源上传下载、课程学习等过程中有任何疑问或建议,欢迎提出宝贵意见哦~我们会及时处理!
点击此处反馈


专栏目录
最低0.47元/天 解锁专栏
买1年送3月
百万级
高质量VIP文章无限畅学
千万级
优质资源任意下载
C知道
免费提问 ( 生成式Al产品 )