【Python实践】:拓扑排序算法的简单实现
发布时间: 2024-09-13 15:57:52 阅读量: 126 订阅数: 40 

Python实现拓扑排序:深入理解与代码实践
# 1. Python拓扑排序概述
拓扑排序是图论中的一项基础算法,它能够将有向无环图(DAG)中的节点线性排序,以体现节点间的依赖关系。在计算机科学中,这种排序特别适用于解决依赖和优先级问题,例如在编译器设计、项目管理和数据库等领域中。Python语言因其简洁性和强大的库支持,在处理这类算法问题时尤为突出。本章将从概念上简要介绍拓扑排序,并概述在Python中实现这一算法的基本思路。尽管我们在后续章节中将详细探讨算法的理论基础和具体实现,本章的目的是为读者提供一个关于Python中拓扑排序概念的快速概览。
# 2. 拓扑排序理论基础
### 2.1 图的介绍和分类
#### 2.1.1 无向图和有向图的区别
在图论中,图是一种由顶点(节点)和连接顶点的边组成的抽象数据结构。图可以被进一步分类为无向图和有向图。无向图中的边没有方向,表示顶点之间相互连接,而有向图中的边是有方向的,表示信息、物体、或控制从一个顶点流向另一个顶点。
**无向图**中的边可以简单看作是两个城市之间的双向道路,既可以从城市A到城市B,也可以从城市B到城市A。而在**有向图**中,边则像一个单行道,必须按照箭头指示的方向行驶,不能逆向。
例如,在社交网络图中,无向图可能用来表示两个用户之间的关系是双向的,可以互为朋友;而在表示网页链接结构时,有向图用来描述一个页面可以链接到另一个页面,但反过来不一定是。
#### 2.1.2 图的表示方法(邻接矩阵、邻接表)
图的表示方法是算法实现前必须考虑的一个重要方面。常见的图表示方法主要有邻接矩阵和邻接表。
**邻接矩阵**是一种二维数组表示方法,其中行和列分别代表图中的顶点。如果顶点i和顶点j之间有连接,则矩阵中对应位置M[i][j]为1,否则为0。邻接矩阵的优点是简单直观,但其空间复杂度较高,对于稀疏图不适用。
```plaintext
例如,对于一个有4个顶点的无向图:
A B C D
A 0 1 0 0
B 1 0 1 0
C 0 1 0 1
D 0 0 1 0
```
**邻接表**用链表来表示顶点间的连接关系,每个顶点都有一个与其相连的顶点列表。邻接表节省空间,适合表示稀疏图,但需要额外的数据结构。
```plaintext
例如,对于同样的图,邻接表表示如下:
A -> B -> C
B -> A -> C
C -> B -> D
D -> C
```
邻接表和邻接矩阵的选择取决于图的稠密程度、查询和更新的需求等因素。
### 2.2 拓扑排序的定义和重要性
#### 2.2.1 拓扑排序的定义
拓扑排序是一种对有向无环图(DAG)的顶点进行排序的方法,使得对于任意的边(u, v),顶点u都在顶点v之前。这种排序不是唯一的,但可以为我们提供一个有关顶点依赖关系的顺序。
拓扑排序的一个关键特性是它能够帮助我们发现和处理有向图中的环结构。由于拓扑排序只能应用于有向无环图,因此,在尝试进行拓扑排序之前,需要确认图中不存在环。
#### 2.2.2 拓扑排序的应用场景
拓扑排序在多个领域中有广泛应用,如课程安排、任务调度、软件包管理、编译器中的依赖解析等。
在课程安排系统中,课程依赖可以由图表示,其中节点代表课程,有向边表示课程的先修关系。拓扑排序可以用来生成满足先决条件的课程学习顺序。
在软件包管理中,包之间的依赖关系也形成一个有向图,通过拓扑排序,可以确定安装或更新软件包的顺序,以满足依赖关系。
### 2.3 拓扑排序的算法原理
#### 2.3.1 拓扑排序的Kahn算法原理
Kahn算法是进行拓扑排序的一种经典算法,其基本思想是每次移除一个入度为0的顶点,并将其邻接顶点的入度减1,如此迭代直到图中没有入度为0的顶点,此时如果图中还有剩余顶点,则表示图中存在环。
算法步骤如下:
1. 计算每个顶点的入度(指向该顶点的边的数量)。
2. 将所有入度为0的顶点加入队列中。
3. 当队列非空时,执行以下操作:
a. 从队列中取出一个顶点u。
b. 对u的所有邻接顶点v,将v的入度减1,如果v的入度变为0,则将其加入队列。
4. 如果图中所有顶点都被访问过,则完成拓扑排序,否则图中存在环。
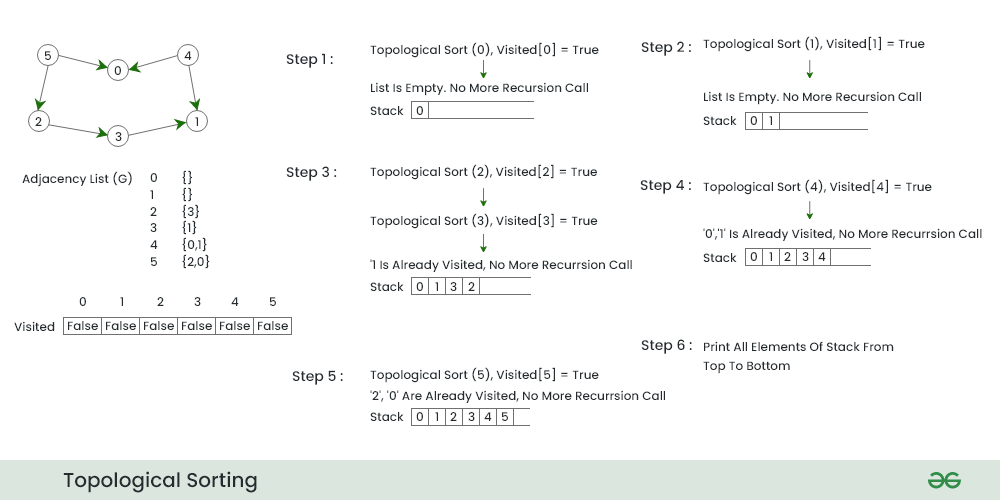
#### 2.3.2 拓扑排序的DFS算法原理
深度优先搜索(DFS)也可以用来进行拓扑排序。与Kahn算法不同的是,DFS算法从任意顶点开始,尽可能深地进行搜索,回溯时记录顶点的访问顺序,即为拓扑排序。
算法步骤如下:
1. 初始化一个空栈,用于存放拓扑排序结果。
2. 对所有未访问的顶点调用递归函数:
a. 对当前顶点标记为已访问。
b. 遍历当前顶点的所有邻接顶点,如果邻接顶点未被访问,则递归访问。
c. 当前顶点的所有邻接顶点都被访问过后,将其压入栈中。
3. 栈顶元素即为拓扑排序的开始,栈底元素为结束。
DFS算法在实现时需要注意避免对环结构中的顶点进行重复访问。在许多实现中,DFS用于检测图中的环并进行拓扑排序。
以上就是对拓扑排序理论基础的详细讲解,为接下来的Python实现部分打下坚实的理论基础。在下一章节中,我们将详细介绍如何使用Python语言实现拓扑排序,并结合实例演示其具体操作步骤。
# 3. Python实现拓扑排序
## 3.1 环境搭建与基础代码框架
### 3.1.1 搭建Python开发环境
在开始实现拓扑排序之前,确保您的开发环境已经搭建好Python的运行环境。推荐安装Python 3.x版本。您可以在官方文档找到详细安装指南。
此外,为了方便代码的编写和执行,您可以选择一些集成开发环境(IDE),如PyCharm,或者使用文本编辑器配合命令行工具。
### 3.1.2 编写基础的数据结构代码
拓扑排序通常是在有向无环图(DAG)上进行的,所以我们首先需要定义图的数据结构。图可以通过邻接矩阵或邻接表表示。
```python
class Graph:
def __init__(self, vertices):
self.graph = [[0] * vertices for _ in range(vertices)]
self.V = vertices
def add_edge(self, u, v):
self.graph[u][v] = 1
def print_graph(self):
for i in range(self.V):
for j in range(self.V):
print(self.graph[i][j], end=" ")
print()
# 示例用图的创建
g = Graph(6)
g.add_edge(5, 2)
g.add_edge(5, 0)
g.add_edge(4, 0)
g.add_edge(4, 1)
g.add_edge(2, 3)
g.add_edge(3, 1)
g.print_graph()
```
以上代码定义了一个有向图,并加入了几个边。这个基础图将用于后续的拓扑排序实现。
## 3.2 利用Kahn算法实现拓扑排序
### 3.2.1 Kahn算法的Python实现步骤
Kahn算法是进行拓扑排序的一种方法,它从没有入边(in-degree为0)的顶点开始,并逐步删除这些顶

 百万级
高质量VIP文章无限畅学
百万级
高质量VIP文章无限畅学
 千万级
优质资源任意下载
千万级
优质资源任意下载
 C知道
免费提问 ( 生成式Al产品 )
C知道
免费提问 ( 生成式Al产品 )
0
0
相关推荐

专栏简介
本专栏深入探讨了数据结构拓扑排序,涵盖了其核心概念、算法实现、优化策略和广泛的应用场景。专栏文章以循序渐进的方式,从基础知识到高级技术,全面解析了拓扑排序的各个方面。从掌握算法的秘密技巧到探索其在项目中的应用,再到解决循环依赖和提高性能,专栏提供了丰富的见解和实用的指南。此外,专栏还深入分析了拓扑排序在有向无环图中的应用,探讨了其变种和故障排除策略,并提供了Python和C++的代码实现。通过深入的研究和清晰的解释,本专栏旨在帮助读者透彻理解拓扑排序,并将其应用于实际问题解决中。
专栏目录
最低0.47元/天 解锁专栏
买1年送3月
百万级
高质量VIP文章无限畅学
千万级
优质资源任意下载
C知道
免费提问 ( 生成式Al产品 )
最新推荐
解决组合分配难题:偏好单调性神经网络实战指南(专家系统协同)

# 摘要
本文旨在探讨解决组合分配难题的方法,重点关注偏好单调性理论在优化中的应用以及神经网络的实战应用。文章首先介绍了偏好单调性的定义、性质及其在组合优化中的作用,接着深入探讨了如何
WINDLX模拟器案例研究:3个真实世界的网络问题及解决方案
# 摘要
本文对WINDLX模拟器进行了全面概述,并深入探讨了网络问题的理论基础与诊断方法。通过对比OSI七层模型和TCP/IP模型,分析了网络通信中常见的问题及其分类。文中详细介绍了网络故障诊断技术,并通过案例分析方法展示了理论知识在实践中的应用。三个具体案例分别涉及跨网络性能瓶颈、虚拟网络隔离失败以及模拟器内网络服务崩溃的背景、问题诊断、解决方案实施和结果评估。最后,本文展望了W
【FREERTOS在视频处理中的力量】:角色、挑战及解决方案

# 摘要
FreeRTOS在视频处理领域的应用日益广泛,它在满足实时性能、内存和存储限制、以及并发与同步问题方面面临一系列挑战。本文探讨了FreeRTOS如何在视频处理中扮演关键角色,分析了其在高优先级任务处理和资源消耗方面的表现。文章详细讨论了任务调度优化、内存管理策略以及外设驱动与中断管理的解决方案,并通过案例分析了监控视频流处理、实时视频转码
ITIL V4 Foundation题库精讲:考试难点逐一击破(备考专家深度剖析)
# 摘要
ITIL V4 Foundation作为信息技术服务管理领域的重要认证,对从业者在理解新框架、核心理念及其在现代IT环境中的应用提出了要求。本文综合介绍了ITIL V4的考试概览、核心框架及其演进、四大支柱、服务生命周期、关键流程与功能以及考试难点,旨在帮助考生全面掌握ITIL V4的理论基础与实践应用。此外,本文提供了实战模拟
【打印机固件升级实战攻略】:从准备到应用的全过程解析

# 摘要
本文综述了打印机固件升级的全过程,从前期准备到升级步骤详解,再到升级后的优化与维护措施。文中强调了环境检查与备份的重要性,并指出获取合适固件版本和准备必要资源对于成功升级不可或缺。通过详细解析升级过程、监控升级状态并进行升级后验证,本文提供了确保固件升级顺利进行的具体指导。此外,固件升级后的优化与维护策略,包括调整配置、问题预防和持续监控,旨在保持打印机最佳性能。本文还通过案
【U9 ORPG登陆器多账号管理】:10分钟高效管理你的游戏账号

# 摘要
本文详细探讨了U9 ORPG登陆器的多账号管理功能,首先概述了其在游戏账号管理中的重要性,接着深入分析了支持多账号登录的系统架构、数据流以及安全性问题。文章进一步探讨了高效管理游戏账号的策略,包括账号的组织分类、自动化管理工具的应用和安全性隐私保护。此外,本文还详细解析了U9 ORPG登陆器的高级功能,如权限管理、自定义账号属性以及跨平台使用
【编译原理实验报告解读】:燕山大学案例分析
# 摘要
本文是关于编译原理的实验报告,首先介绍了编译器设计的基础理论,包括编译器的组成部分、词法分析与语法分析的基本概念、以及语法的形式化描述。随后,报告通过燕山大学的实验案例,深入分析了实验环境、工具以及案例目标和要求,详细探讨了代码分析的关键部分,如词法分析器的实现和语法分析器的作用。报告接着指出了实验中遇到的问题并提出解决策略,最后展望了编译原理实验的未来方向,包括最新研究动态和对
【中兴LTE网管升级与维护宝典】:确保系统平滑升级与维护的黄金法则

# 摘要
本文详细介绍了LTE网管系统的升级与维护过程,包括升级前的准备工作、平滑升级的实施步骤以及日常维护的策略。文章强调了对LTE网管系统架构深入理解的重要性,以及在升级前进行风险评估和备份的必要性。实施阶段,作者阐述了系统检查、性能优化、升级步骤、监控和日志记录的重要性。同时,对于日常维护,本文提出监控KPI、问题诊断、维护计划执行以及故障处理和灾难恢复措施。案例研究部分探讨了升级维护实践中的挑战与解决方案。最后,文章展望了LT
故障诊断与问题排除:合泰BS86D20A单片机的自我修复指南
# 摘要
本文系统地介绍了故障诊断与问题排除的基础知识,并深入探讨了合泰BS86D20A单片机的特性和应用。章节二着重阐述了单片机的基本概念、硬件架构及其软件环境。在故障诊断方面,文章提出了基本的故障诊断方法,并针对合泰BS86D20A单片机提出了具体的故障诊断流程和技巧。此外,文章还介绍了问题排除的高级技术,包括调试工具的应用和程序自我修复技术。最后,本文就如何维护和优化单片
资源上传下载、课程学习等过程中有任何疑问或建议,欢迎提出宝贵意见哦~我们会及时处理!
点击此处反馈


专栏目录
最低0.47元/天 解锁专栏
买1年送3月
百万级
高质量VIP文章无限畅学
千万级
优质资源任意下载
C知道
免费提问 ( 生成式Al产品 )