VSCode Debug Toolbox: Achieving Multi-dimensional Code Debugging
发布时间: 2024-09-15 08:50:48 阅读量: 29 订阅数: 47 

go-toolbox:用于aos-dev的Golang工具箱
# 2.1 The Principle and Process of Debugging
### 2.1.1 Breakpoints and Step-by-Step Execution
The essence of debugging lies in controlling the program's execution flow through breakpoints and step-by-step execution. A breakpoint is a marker that can be set on a specific line of code, and when the program reaches this line, the debugger pauses the execution and allows the user to inspect the program's state. Step-by-step execution enables the user to execute the code line by line and check the variable values and program state after each step.
### 2.1.2 Variable Watching and Modification
Debuggers also provide the functionality to watch and modify variables. Users can monitor the values of variables during the debugging process to understand the program's runtime status. If necessary, users can also modify the values of variables, thereby dynamically changing the program's execution results.
# 2. The Theoretical Foundation of the VSCode Debug Toolbox
### 2.1 The Principle and Process of Debugging
Debugging is the process of finding and fixing software errors. The VSCode Debug Toolbox provides powerful features that enable developers to perform this task efficiently.
#### 2.1.1 Breakpoints and Step-by-Step Execution
Breakpoints are markers set in the code to indicate to the debugger where to pause during execution. When the breakpoint is reached, the debugger pauses execution, allowing developers to inspect variables, stack traces, and other debugging information.
Step-by-step execution allows developers to execute code line by line, which is useful for understanding the flow of code and identifying errors. The VSCode Debug Toolbox provides various step-by-step execution options, including:
- **Step Into (F11)**: Enter functions or methods.
- **Step Over (F10)**: Execute functions or methods without entering.
- **Step Out (Shift+F11)**: Exit from functions or methods.
#### 2.1.2 Variable Watching and Modification
Variable watching allows developers to check the values of variables during debugging. The VSCode Debug Toolbox provides a variables pane that displays all variables in the current scope and their values.
Variable modification allows developers to change the values of variables during debugging. This is useful for testing the effects of different values on the code behavior.
### 2.2 The Architecture and Components of the VSCode Debug Toolbox
The VSCode Debug Toolbox is a complex system composed of multiple components. These components work together to provide a seamless debugging experience.
#### 2.2.1 Debugging Engines and Extensions
The debugging engine is responsible for executing code and handling breakpoints and step-by-step execution. VSCode supports multiple debugging engines, including:
- **Node.js Debugging Engine**: Used for debugging JavaScript, TypeScript, and Node.js code.
- **Python Debugging Engine**: Used for debugging Python code.
- **Java Debugging Engine**: Used for debugging Java code.
Debugging extensions are additional components that enhance debugging capabilities. They can provide features such as remote debugging, multi-process debugging, and custom debugging configurations.
#### 2.2.2 Debugging UI and Control Panel
The debugging UI is the user interface for interacting with the debugger. It includes the variables pane, stack trace pane, and control panel.
The control panel provides various controls for managing debugging sessions, such as:
- **Start (F5)**: Start a debugging session.
- **Stop (Shift+F5)**: Stop a debugging session.
- **Continue (F5)**: Continue execution from a breakpoint.
- **Restart (Ctrl+Shift+F5)**: Restart a debugging session.
# 3. Practical Application of the VSCode Debug Toolbox
### 3.1 Debugging JavaScript and Type

 百万级
高质量VIP文章无限畅学
百万级
高质量VIP文章无限畅学
 千万级
优质资源任意下载
千万级
优质资源任意下载
 C知道
免费提问 ( 生成式Al产品 )
C知道
免费提问 ( 生成式Al产品 )
0
0
相关推荐
专栏目录
最低0.47元/天 解锁专栏
买1年送3月
百万级
高质量VIP文章无限畅学
千万级
优质资源任意下载
C知道
免费提问 ( 生成式Al产品 )
最新推荐
【ARM调试接口进化论】:ADIV6.0相比ADIV5在数据类型处理上的重大飞跃

# 摘要
本文全面概述了ARM调试接口的发展和特点,重点介绍了ADIV5调试接口及其对数据类型处理的机制。文中详细分析了ADIV5的数据宽度、对齐问题和复杂数据结构的处理挑战,并探讨了ADIV6.0版本带来的核心升级,包括调试架构的性能提升和对复杂数据类型处理的优
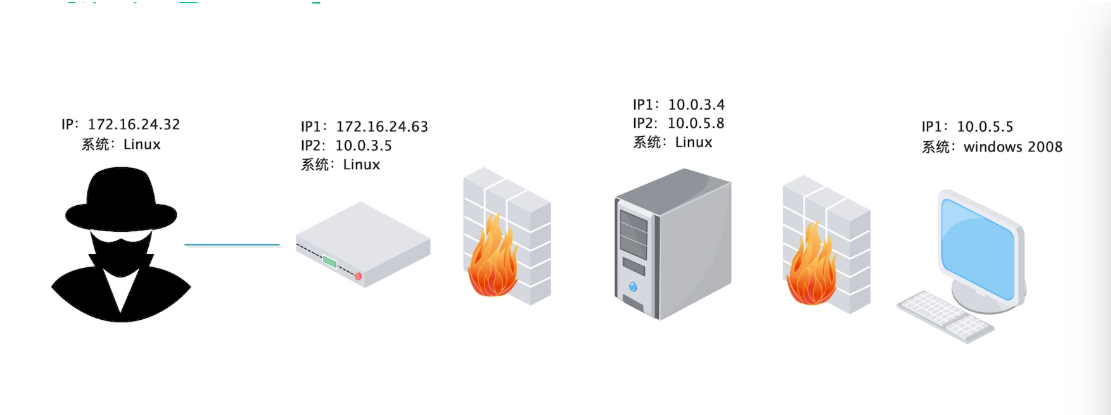
渗透测试新手必读:靶机环境的五大实用技巧
# 摘要
随着网络安全意识的增强,渗透测试成为评估系统安全的关键环节。靶机环境作为渗透测试的基础平台,其搭建和管理对于测试的有效性和安全性至关重要。本文全面概述了渗透测试的基本概念及其对靶机环境的依赖性,深入探讨了靶机环境搭建的理论基础和实践技巧,强调了在选择操作系统、工具、网络配置及维护管理方面的重要性。文章还详细介绍了渗透测试中的攻击模拟、日志分析以及靶机环境的安全加固与风险管理。最后,展
LGO脚本编写:自动化与自定义工作的第一步
# 摘要
本文详细介绍了LGO脚本编写的基础知识和高级应用,探讨了其在自动化任务、数据处理和系统交互中的实战应用。首先概述了LGO脚本的基本元素,包括语法结构、控制流程和函数使用。随后,文章通过实例演练展示了LGO脚本在自动化流程实现、文件数据处理以及环境配置中的具体应用。此外,本文还深入分析了LGO脚本的扩展功能、性能优化以及安全机制,提出了
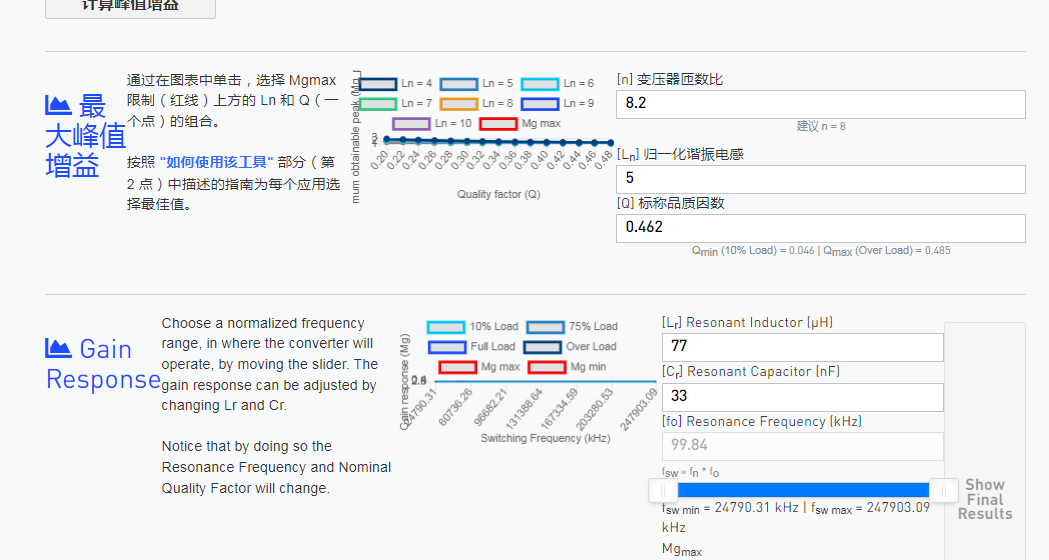
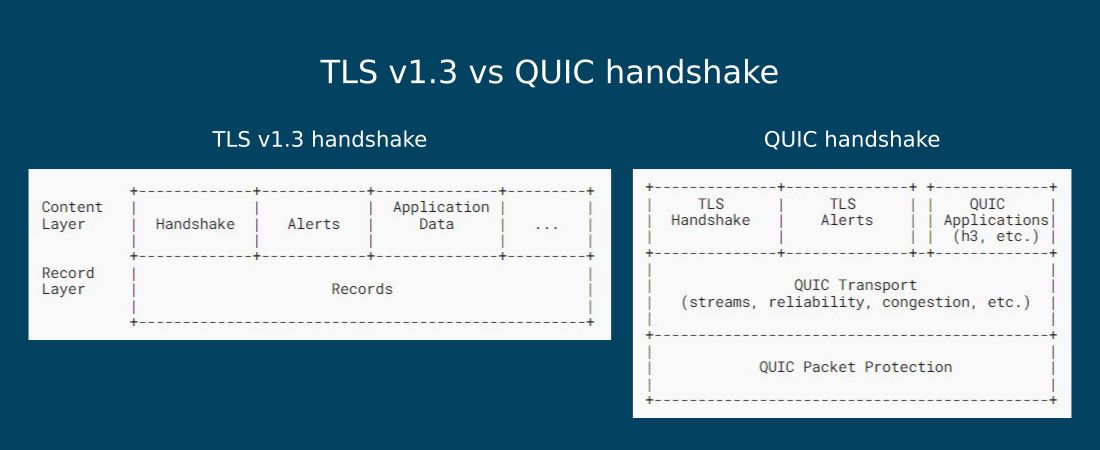
百万QPS网络架构设计:字节跳动的QUIC案例研究
# 摘要
随着网络技术的快速发展,百万QPS(每秒查询数)已成为衡量现代网络架构性能的关键指标之一。本文重点探讨了网络架构设计中面临百万QPS挑战时的策略,并详细分析了QUIC协议作为新兴传输层协议相较于传统TCP/IP的优势,以及字节跳动如何实现并优化QUIC以提升网络性能。通过案例研究,本文展示了QUIC协议在实际应用中的效果,
FPGA与高速串行通信:打造高效稳定的码流接收器(专家级设计教程)

# 摘要
本文全面探讨了基于FPGA的高速串行通信技术,从硬件选择、设计实现到码流接收器的实现与测试部署。文中首先介绍了FPGA与高速串行通信的基础知识,然后详细阐述了FPGA硬件设计的关键步骤,包括芯片选择、硬件配置、高速串行标准选择、内部逻辑设计及其优化。接下来,文章着重讲述了高速串行码流接收器的设计原理、性能评估与优化策略,以及如何在实际应用中进行测试和部署。最后,本文展望了高速串行
Web前端设计师的福音:贝塞尔曲线实现流畅互动的秘密

# 摘要
贝塞尔曲线是计算机图形学中用于描述光滑曲线的重要工具,它在Web前端设计中尤为重要,通过CSS和SVG技术实现了丰富的视觉效果和动画。本文首先介绍了贝塞尔曲线的数学基础和不同类型的曲线,然后具体探讨了如何在Web前端应用中使用贝塞尔曲线,包括CSS动画和SVG路径数据的利用。文章接着通过实践案例分析,阐述了贝塞尔曲线在提升用户界面动效平滑性、交互式动画设计等方面的应用。最后,文章聚焦于性能优化
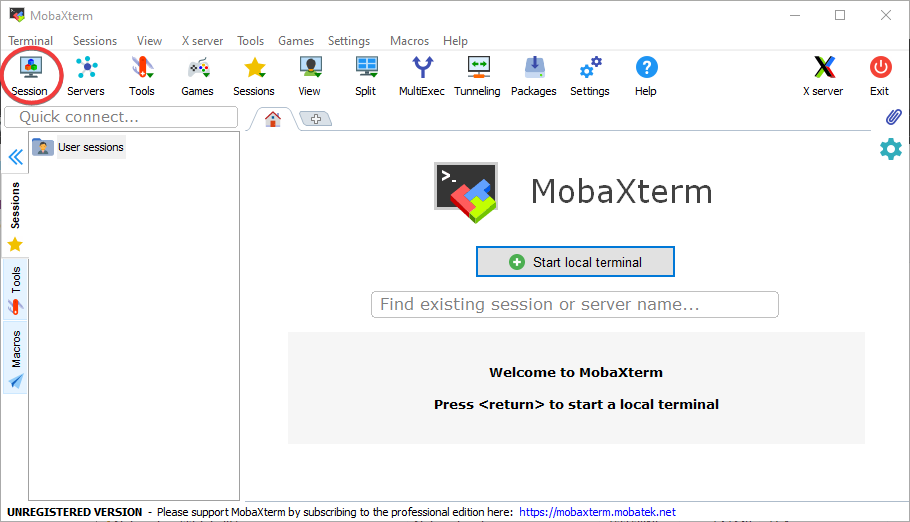
【终端工具对决】:MobaXterm vs. WindTerm vs. xshell深度比较
# 摘要
本文对市面上流行的几种终端工具进行了全面的深度剖析,比较了MobaXterm、WindTerm和Xshell这三款工具的基本功能、高级特性,并进行了性能测试与案例分析。文中概述了各终端工具的界面操作体验、支持的协议与特性,以及各自的高级功能如X服务器支持、插件系统、脚本化能力等。性能测试结果和实际使用案例为用户提供了具体的性能与稳定性数据参考。最后一章从用户界面、功能特性、性能稳定性等维度对
电子建设项目决策系统:预算编制与分析的深度解析

# 摘要
本文对电子建设项目决策系统进行了全面的概述,涵盖了预算编制和分析的核心理论与实践操作,并探讨了系统的优化与发展方向。通过分析预算编制的基础理论、实际项目案例以及预算编制的工具和软件,本文提供了深入的实践指导。同时,本文还对预算分析的重要性、方法、工具和实际案例进行了详细讨论,并探讨了如何将预算分析结果应用于项目优化。最后,本文考察了电子建设项目决策系统当前的优化方法和未来的发展趋势
【CSEc硬件加密模块集成攻略】:在gcc中实现安全与效率
# 摘要
本文详细介绍了CSEc硬件加密模块的基础知识、工作原理、集成实践步骤、性能优化与安全策略以及在不同场景下的应用案例。首先,文章概述了CSEc模块的硬件架构和加密解密机制,并将其与软件加密技术进行了对比分析。随后,详细描述了在gcc环境中如何搭建和配置环境,并集成CSEc模块到项目中。此外,本文还探讨了性能调优和安全性加强措施,包括密钥管理和防御
【确保硬件稳定性与寿命】:硬件可靠性工程的实战技巧

# 摘要
硬件可靠性工程是确保现代电子系统稳定运行的关键学科。本文首先介绍了硬件可靠性工程的基本概念和硬件测试的重要性,探讨了不同类型的硬件测试方法及其理论基础。接着,文章深入分析了硬件故障的根本原因,故障诊断技术,以及预防性维护对延长设备寿命的作用。第四章聚焦于硬件设计的可靠性考虑,HALT与HAS
资源上传下载、课程学习等过程中有任何疑问或建议,欢迎提出宝贵意见哦~我们会及时处理!
点击此处反馈


专栏目录
最低0.47元/天 解锁专栏
买1年送3月
百万级
高质量VIP文章无限畅学
千万级
优质资源任意下载
C知道
免费提问 ( 生成式Al产品 )