时间序列分解:在各行各业的应用与案例解析
发布时间: 2024-08-21 23:24:01 阅读量: 34 订阅数: 37 

基于微信小程序的社区门诊管理系统php.zip
# 1. 时间序列分解概述
时间序列分解是一种将时间序列数据分解为多个组成成分的技术,这些成分具有不同的时间尺度和特征。它可以帮助我们理解数据的内在模式,并为预测和决策提供基础。
时间序列分解的目的是将原始数据分解为趋势、季节性、循环和随机等成分。趋势成分表示数据的长期增长或下降趋势;季节性成分表示数据在特定时间间隔(如每日、每周或每年)内的重复模式;循环成分表示数据在较长时间间隔内的波动;随机成分表示数据中不可预测的变异。
# 2. 时间序列分解理论基础
### 2.1 时间序列的组成成分
时间序列可以分解为四个基本组成成分:
#### 2.1.1 趋势成分
趋势成分表示时间序列中长期变化的总体趋势,它反映了数据随时间推移的整体上升或下降趋势。趋势成分可以用线性、指数或多项式函数来表示。
#### 2.1.2 季节性成分
季节性成分表示时间序列中因季节变化而产生的周期性波动。它通常以一年为周期,反映了节假日、季节性活动或天气变化对数据的影响。季节性成分可以用正弦或余弦函数来表示。
#### 2.1.3 循环成分
循环成分表示时间序列中因经济周期或其他因素而产生的长期波动。它通常以几年为周期,反映了经济衰退、繁荣或其他周期性事件对数据的影响。循环成分可以用正弦或余弦函数来表示。
#### 2.1.4 随机成分
随机成分表示时间序列中无法用趋势、季节性或循环成分解释的剩余波动。它通常是不可预测的,反映了随机事件或噪声对数据的影响。随机成分可以用白噪声或自相关函数来表示。
### 2.2 时间序列分解方法
时间序列分解方法分为两大类:加法模型和乘法模型。
#### 2.2.1 加法模型
加法模型假设时间序列的各个组成成分是相加的。即:
```
Y = T + S + C + R
```
其中:
* Y:原始时间序列
* T:趋势成分
* S:季节性成分
* C:循环成分
* R:随机成分
#### 2.2.2 乘法模型
乘法模型假设时间序列的各个组成成分是相乘的。即:
```
Y = T * S * C * R
```
乘法模型通常用于时间序列中各个组成成分之间存在交互作用的情况。
**代码块:**
```python
import numpy as np
import pandas as pd
from statsmodels.tsa.seasonal import seasonal_decompose
# 加载时间序列数据
data = pd.read_csv('time_series.csv')
# 加法模型分解
decomposition = seasonal_decompose(data['value'], model='additive')
# 乘法模型分解
decomposition = seasonal_decompose(data['value'], model='multiplicative')
```
**逻辑分析:**
该代码块使用 `statsmodels` 库中的 `seasonal_decompose` 函数对时间序列数据进行加法和乘法模型分解。`model` 参数指定分解模型类型,`additive` 表示加法模型,`multiplicative` 表示乘法模型。分解结果存储在 `decomposition` 对象中。
**参数说明:**
* `data['value']`:原始时间序列数据
* `model`:分解模型类型,可选值为 `additive` 或 `multiplicative`
# 3. 时间序列分解实践应用
### 3.1 趋势分解
趋势成分反映了时间序列数据的长期变化趋势,其分解方法主要有:
#### 3.1.1 移动平均法
移动平均法通过计算数据序列中指定窗口内的平均值来平滑数据,从而提取趋势成分。
```python
import numpy as np
def moving_average(data, window_size):
"""
计算移动平均值。
参数:
data: 时间序列数据。
window_size: 移动窗口大小。
返回:
移动平均值序列。
"""
# 创建移动平均值数组
moving_average = np.zeros(len(data) - window_size + 1)
# 计算每个窗口的平均值
for i in range(len(moving_average)):
moving_average[i] = np.mean(data[i:i+window_size])
return moving_average
```
#### 3.1.2 指数平滑法
指数平滑法通过对过去数据赋予不同的权重,计算出平滑后的数据序列,从而提取趋势成分。
```python
import statsmodels.api as sm
def exponential_smoothing(data, alpha):
"""
计算指数平滑值。
参数:
data: 时间序列数据。
alpha: 平滑因子。
返回:
指数平滑值序列。
"""
# 创建指数平滑值数组
exponential_smoothing = np.zeros(len(data))
# 初始化第一个指数平滑值
exponential_smoothing[0] = data[0]
# 计算后续的指数平滑值
for i in range(1, len(data)):
exponential_smoothing[i] = alpha * data[i] + (1 - alpha) * exponential_smoothing[i-1]
return exponential_smoothing
```
#### 3.1.3 线性回归法
线性回归法通过拟合一条直线到数据序列,计算出趋势成分。
```python
import statsmodels.api as sm
def linear_regression(data):
"""
计算线性回归趋势。
参数:
data: 时间序列数据。
返回:
线性回归趋势值序列。
"""
# 创建线性回归模型
```

 百万级
高质量VIP文章无限畅学
百万级
高质量VIP文章无限畅学
 千万级
优质资源任意下载
千万级
优质资源任意下载
 C知道
免费提问 ( 生成式Al产品 )
C知道
免费提问 ( 生成式Al产品 )
0
0
相关推荐

专栏简介
时间序列分解方法专栏深入探讨了时间序列数据的分解技术,揭示了其作为预测模型秘密武器的强大力量。通过一系列标题,专栏全面介绍了时间序列分解的各个方面,从入门到精通预测模型构建。它揭示了数据背后的结构,包括季节性变化、残差波动和长期趋势。专栏强调了时间序列分解在提升预测准确性、识别异常值、数据可视化和机器学习特征工程中的关键作用。它还提供了从理论基础到实际应用的完整指南,涵盖了从业者的必备技能和最佳实践。通过深入了解时间序列分解,数据科学家和分析师可以掌握应对数据复杂性的有效策略,并提升其数据分析能力。
专栏目录
最低0.47元/天 解锁专栏
买1年送3月
百万级
高质量VIP文章无限畅学
千万级
优质资源任意下载
C知道
免费提问 ( 生成式Al产品 )
最新推荐
【掌握电路表决逻辑】:裁判表决电路设计与分析的全攻略
# 摘要
本文对电路表决逻辑进行了全面的概述,包括基础理论、设计实践、分析与测试以及高级应用等方面。首先介绍了表决逻辑的基本概念、逻辑门和布尔代数基础,然后详细探讨了表决电路的真值表和功能表达。在设计实践章节中,讨论了二输入和多输入表决电路的设计流程与实例,并提出了优化与改进方法。分析与测试
C# WinForm程序打包优化术:5个技巧轻松减小安装包体积
# 摘要
WinForm程序打包是软件分发的重要步骤,优化打包流程可以显著提升安装包的性能和用户体验。本文首先介绍了WinForm程序打包的基础知识,随后详细探讨了优化打包流程的策略,包括依赖项分析、程序集和资源文件的精简,以及配置优化选项。接着深入到代码级别,阐述了如何通过精简代码、优化数据处理和调整运行时环境来进一步增强应用程序。文章还提供了第三方打包工具的选择和实际案例分析,用以解决打包过程中的常见问题。最后,本
【NI_Vision调试技巧】:效率倍增的调试和优化方法,专家级指南
# 摘要
本文全面介绍了NI_Vision在视觉应用中的调试技术、实践案例和优化策略。首先阐述了NI_Vision的基础调试方法,进而深入探讨了高级调试技术,包括图像采集与处理、调试工具的使用和性能监控。通过工业视觉系统调试和视觉测量与检测应用的案例分析,展示了NI_Vision在实际问题解决中的应用。本文还详细讨论了代码、系统集成、用户界面等方面的优化方法,以及工具
深入理解Windows内存管理:第七版内存优化,打造流畅运行环境
# 摘要
本文深入探讨了Windows环境下内存管理的基础知识、理论与实践操作。文章首先介绍内存管理的基本概念和理论框架,包括不同类型的内存和分页、分段机制。接着,本文详细阐述了内存的分配、回收以及虚拟内存管理的策略,重点讨论了动态内存分配算法和内存泄漏的预防。第三章详细解析了内存优化技术,包括监控与分析工具的选择应用、内存优化技巧及故障诊断与解决方法。第四章聚焦于打造高性能运行环境,分别从系统、程
专家揭秘:7个技巧让威纶通EasyBuilder Pro项目效率翻倍
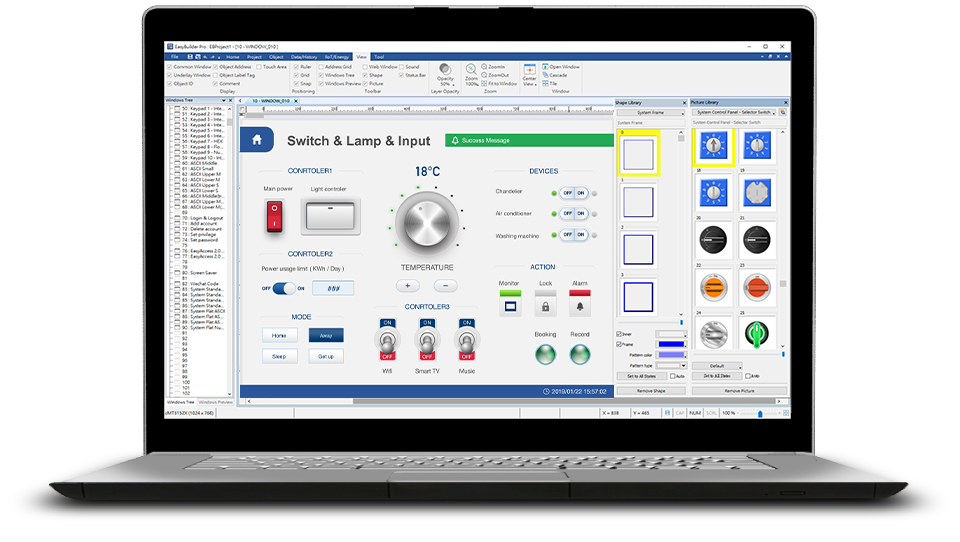
# 摘要
本论文旨在为初学者提供威纶通EasyBuilder Pro的快速入门指南,并深入探讨高效设计原则与实践,以优化用户界面的布局和提高设计的效率。同时,本文还涵盖了通过自动化脚本编写和高级技术提升工作效率的方法。项目管理章节着重于资源规划与版本控制策略,以优化项目的整体执行。最后,通过案例分析,本文提供了问题解决的实践方法和技巧,旨在帮助读者将理论知识应用于实际工作中,解决常见的开发难题,
Jetson Nano编程入门:C++和Python环境搭建,轻松开始AI开发

# 摘要
Jetson Nano作为NVIDIA推出的边缘计算开发板,以其实惠的价格和强大的性能,为AI应用开发提供了新的可能性。本文首先介绍了Jetson Nano的硬件组成、接口及配置指南,并讨论了其安全维护的最佳实践。随后,详细阐述了如何为Jetson Nano搭建C++和P
软件操作手册撰写:遵循这5大清晰易懂的编写原则

# 摘要
软件操作手册是用户了解和使用软件的重要参考文档,本文从定义和重要性开始,详细探讨了手册的受众分析、需求评估、友好的结构设计。接下来,文章指导如何编写清晰的操作步骤,使用简洁的语言,并通过示例和截图增强理解。为提升手册的质量,本文进一步讨论了实现高级功能的说明,包含错误处理、自定义设置以及技术细节。最后,探讨了格式选择、视觉布局和索引系统的设计,以及测试、反馈收集与文档持续改进的策略。本文旨在为编写高
西门子G120变频器维护秘诀:专家告诉你如何延长设备寿命
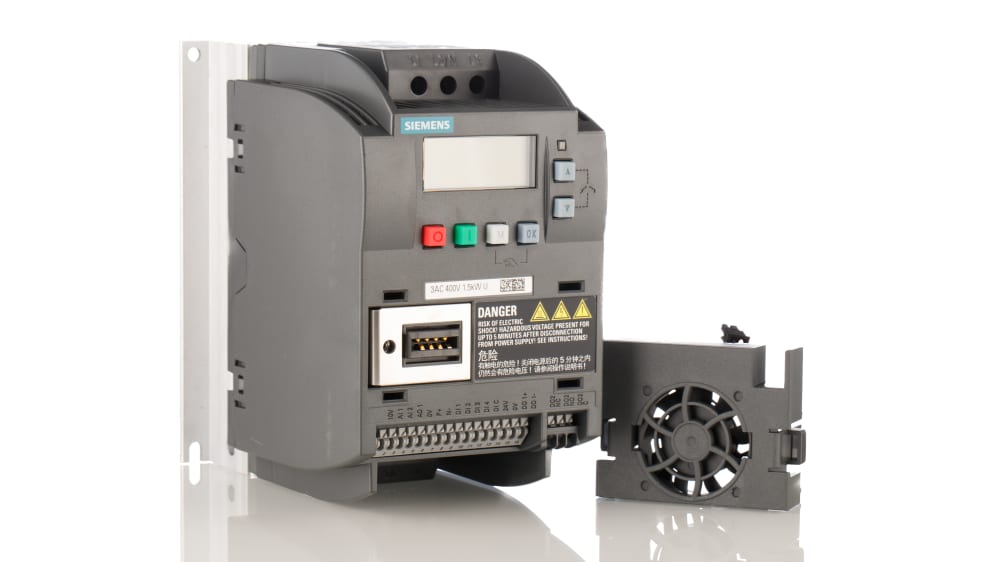
# 摘要
本文对西门子G120变频器的基础知识、日常维护实践、故障诊断技术、性能优化策略进行了系统介绍。首先,概述了变频器的工作原理及关键组件功能,然后深入探讨了变频器维护的理论基础,包括日常检查、定期维护流程以及预防性维护策略的重要性。接着,文章详述了西门子G
资源上传下载、课程学习等过程中有任何疑问或建议,欢迎提出宝贵意见哦~我们会及时处理!
点击此处反馈


专栏目录
最低0.47元/天 解锁专栏
买1年送3月
百万级
高质量VIP文章无限畅学
千万级
优质资源任意下载
C知道
免费提问 ( 生成式Al产品 )