【In-depth Understanding of MATLAB Spectrum Analysis】: The Mysteries of FFT and IFFT
发布时间: 2024-09-14 10:50:18 阅读量: 67 订阅数: 49 

IFFT using FFT:Computes IFFT of Signal Spectrum-matlab开发
# 1. MATLAB Signal Processing Algorithm Tutorial
Spectral analysis is a core concept in digital signal processing, allowing us to understand the essential characteristics of signals from a frequency domain perspective. Within the MATLAB environment, spectral analysis becomes more intuitive and efficient, thanks to MATLAB's powerful numerical computing capabilities and an extensive library of built-in functions.
## 1.1 Purpose and Significance of Spectral Analysis
The goal of spectral analysis is to extract frequency components from complex time-domain signals to identify their frequency domain characteristics. This technology is widely used in fields such as audio processing, communication systems, and biomedical signal analysis. Through spectral analysis, engineers and scientists can better understand the composition of signals, thereby performing effective signal processing and analysis.
## 1.2 MATLAB's Role in Spectral Analysis
MATLAB provides a range of tools and functions for spectral analysis, making the process from signal acquisition, processing, to visualization simple and efficient. The spectral analysis capabilities of MATLAB support not only basic Fast Fourier Transform (FFT) but also advanced techniques such as window functions and signal filtering, enabling users to quickly transition from theory to practice.
## 1.3 Basic Steps of Spectral Analysis
The basic steps of conducting MATLAB spectral analysis include signal acquisition, preprocessing (such as filtering), FFT transformation, visualization of the frequency spectrum, and analysis and interpretation of the results. This process requires not only proficiency in using MATLAB tools but also a deep understanding of signal processing theory.
```matlab
% MATLAB code example: Simple FFT Analysis
% Let's assume we have a simple sine wave signal
Fs = 1000; % Sampling frequency
t = 0:1/Fs:1-1/Fs; % Time vector
f = 5; % Signal frequency
signal = sin(2*pi*f*t); % Generate sine wave signal
% Perform FFT transformation
Y = fft(signal);
L = length(signal);
P2 = abs(Y/L);
P1 = P2(1:L/2+1);
P1(2:end-1) = 2*P1(2:end-1);
% Define the frequency domain f
f = Fs*(0:(L/2))/L;
% Plot the one-sided amplitude spectrum
figure;
plot(f, P1);
title('Single-Sided Amplitude Spectrum of S(t)');
xlabel('f (Hz)');
ylabel('|P1(f)|');
```
With the above code, we demonstrate how to use MATLAB to perform spectral analysis on a simple sine wave signal. This is just the beginning; MATLAB's powerful analytical capabilities can support more complex signal processing and analysis tasks. As readers gain deeper understanding and practice in spectral analysis, they can explore more advanced features provided by MATLAB to optimize the analysis process.
# 2. Theory and Implementation of the Fast Fourier Transform (FFT)
## 2.1 Basic Principles of the FFT Algorithm
### 2.1.1 Concept of the Discrete Fourier Transform (DFT)
The Discrete Fourier Transform (DFT) is a mathematical method for converting discrete signals in the time domain to the frequency domain. DFT provides a way to observe the frequency components of a signal, working by representing time-domain signals as a linear combination of complex exponential functions. This process can be seen as a sampling and reconstruction process, converting time-domain sampling points into frequency-domain components through the superposition of sine and cosine functions.
In mathematical terms, for a complex number sequence \(x[n]\) of length N, its DFT is defined as:
\[ X[k] = \sum_{n=0}^{N-1} x[n] \cdot e^{-j \frac{2\pi}{N}nk} \]
Here, \(X[k]\) is the frequency component of the complex number sequence \(x[n]\) at frequency \(k\), \(j\) is the imaginary unit, and \(e\) is the base of the natural logarithm.
### 2.1.2 Mathematical Derivation of the FFT Algorithm
The Fast Fourier Transform (FFT) is an efficient algorithm for calculating DFT, proposed by James W. Cooley and John W. Tukey in 1965. FFT significantly reduces the computational complexity of DFT, from the original algorithm's \(O(N^2)\) time complexity to \(O(N \log N)\). This improvement makes large-scale spectral analysis practical.
The core idea of the FFT algorithm is to decompose the original DFT problem into smaller DFT problems and construct the solution of the original problem using the results of these smaller problems. Decomposition typically utilizes a structure called a "butterfly operation." In the recursive divide-and-conquer process, the original DFT of length N is decomposed into two DFTs of length N/2, and then these DFTs are decomposed into four DFTs of length N/4, and so on, until decomposed into the simplest DFT of length 1.
## 2.2 Application of FFT in MATLAB
### 2.2.1 Usage of MATLAB's Built-in FFT Function
MATLAB provides a powerful built-in function `fft` for efficiently computing the fast Fourier transform of signals. Using the `fft` function is straightforward; simply input the signal data to obtain the corresponding frequency domain representation.
For example, for a signal vector x of length N, calculating its FFT requires only one line of code:
```matlab
X = fft(x);
```
The `fft` function returns a complex vector, which includes the magnitude and phase information of the signal's components at different frequencies. To view the signal's amplitude spectrum, the `abs` function can be used to take the modulus; to view the signal's phase spectrum, the `angle` function can be used to take the phase angle.
### 2.2.2 Strategies for Optimizing FFT Performance
In practical applications, FFT performance can be optimized through various strategies. First, the signal length N is often chosen to be a power of 2 for the best performance of the FFT algorithm. MATLAB automatically detects during the execution of `fft` whether the signal length is optimized, and if not, it performs appropriate padding (zero-padding) or truncation.
Another performance optimization strategy is parallel computing. With the prevalence of multi-core processors, MATLAB also provides multi-threading support, allowing multiple data blocks to be processed in parallel during the calculation of FFT. This can be achieved by using the `parfor` loop, ensuring the use of the parallel version of `fft`.
## 2.3 Case Studies of FFT Analysis
### 2.3.1 Spectral Analysis of Audio Signals
Performing spectral analysis on audio signals using FFT is a fundamental operation in audio processing. The following is a simple case study demonstrating how to use MATLAB's `fft` function to analyze the spectrum of an audio signal.
```matlab
% Read audio file
[x, Fs] = audioread('example.wav'); % x is audio data, Fs is sampling frequency
% Compute FFT
X = fft(x);
% Compute frequency vector
N = length(x);
f = (0:N-1)*(Fs/N);
% Plot amplitude spectrum
X_mag = abs(X);
X_mag = X_mag(1:N/2+1);
f = f(1:N/2+1);
figure;
plot(f, X_mag);
title('Audio Signal Spectrum');
xlabel('Frequency (Hz)');
ylabel('Magnitude');
```
In this example, we first read an audio file and then compute its FFT to obtain the frequency components of the signal. Finally, we plot the signal's amplitude spectrum and visually display the frequency distribution of the audio signal through a graph.
### 2.3.2 Spectral Analysis of Power System Signals
In power systems, FFT is widely used to analyze the spectral characteristics of voltage and current signals. This is crucial for detecting harmonic distortions in the grid and monitoring the stability of the power system. The following is a simple case study showing how to use MATLAB to perform FFT analysis of power system signals.
```matlab
% Read power system signal data
load power_data.mat; % Assuming the data file contains voltage or current signals
% Compute FFT
X = fft(signal);
% Compute frequency vector
Fs = sampleRate; % Assuming the sampling frequency is known
N = length(signal);
f = (0:N-1)*(Fs/N);
% Plot amplitude spectrum
X_mag = abs(X);
X_mag = X_mag(1:N/2+1);
f = f(1:N/2+1);
figure;
plot(f, X_mag);
title('Power System Signal Spectrum');
xlabel('Frequency (Hz)');
ylabel('Magnitude');
```
In this example, we load power system signal data and compute its FFT to obtain the frequency components. By plotting the signal's amplitude spectrum, we can observe the frequency components in the power system, such as the fundamental wave and harmonics.
The above cases demonstrate the application of FFT in different fields, not limited to signal processing but also including audio analysis, power system monitoring, etc. Understanding the principle of FFT and its implementation in MATLAB lays a solid foundation for in-depth analysis in these fields.
# 3. Principles and Applications of the Inverse Fast Fourier Transform (IFFT)
## 3.1 Basic Concepts of the IFFT Algorithm
### 3.1.1 Relationship Between IFFT and FFT
The Inverse Fast Fourier Transform (IFFT) is the inverse process of the Fast Fourier Transform (FFT). If FFT is used to convert a time-domain signal into the frequency domain, IFFT is used to convert a frequency-domain signal back into the time domain. Understanding the mathematical relationship between the two is crucial, as they play a core role in signal processing, image pro

 百万级
高质量VIP文章无限畅学
百万级
高质量VIP文章无限畅学
 千万级
优质资源任意下载
千万级
优质资源任意下载
 C知道
免费提问 ( 生成式Al产品 )
C知道
免费提问 ( 生成式Al产品 )
0
0
相关推荐

专栏目录
最低0.47元/天 解锁专栏
买1年送3月
百万级
高质量VIP文章无限畅学
千万级
优质资源任意下载
C知道
免费提问 ( 生成式Al产品 )
最新推荐
【Java代码审计核心教程】:零基础快速入门与进阶策略
-Concept-in-Java.webp)
# 摘要
Java代码审计是保障软件安全性的重要手段。本文系统性地介绍了Java代码审计的基础概念、实践技巧、实战案例分析、进阶技能提升以及相关工具与资源。文中详细阐述了代码审计的各个阶段,包括准备、执行和报告撰写,并强调了审计工具的选择、环境搭建和结果整理的重要性。结合具体实战案例,文章
【Windows系统网络管理】:IT专家如何有效控制IP地址,3个实用技巧

# 摘要
本文主要探讨了Windows系统网络管理的关键组成部分,特别是IP地址管理的基础知识与高级策略。首先概述了Windows系统网络管理的基本概念,然后深入分析了IP地址的结构、分类、子网划分和地址分配机制。在实用技巧章节中,我们讨论了如何预防和解决IP地址冲突,以及IP地址池的管理方法和网络监控工具的使用。之后,文章转向了高级
【技术演进对比】:智能ODF架与传统ODF架性能大比拼

# 摘要
随着信息技术的快速发展,智能ODF架作为一种新型的光分配架,与传统ODF架相比,展现出诸多优势。本文首先概述了智能ODF架与传统ODF架的基本概念和技术架构,随后对比了两者在性能指标、实际应用案例、成本与效益以及市场趋势等方面的不同。智能ODF架通过集成智能管理系统,提高了数据传输的高效性和系统的可靠性,同时在安全性方面也有显著增强。通过对智能ODF架在不同部署场景中的优势展示和传统ODF架局限性的分析,本文还探讨
化工生产优化策略:工业催化原理的深入分析
# 摘要
本文综述了化工生产优化的关键要素,从工业催化的基本原理到优化策略,再到环境挑战的应对,以及未来发展趋势。首先,介绍了化工生产优化的基本概念和工业催化理论,包括催化剂的设计、选择、活性调控及其在工业应用中的重要性。其次,探讨了生产过程的模拟、流程调整控制、产品质量提升的策略和监控技术。接着,分析了环境法规对化工生产的影响,提出了能源管理和废物处理的环境友好型生产方法。通过案例分析,展示了优化策略在多相催化反应和精细化工产品生产中的实际应用。最后,本文展望了新型催化剂的开发、工业4.0与智能化技术的应用,以及可持续发展的未来方向,为化工生产优化提供了全面的视角和深入的见解。
# 关键字
MIPI D-PHY标准深度解析:掌握规范与应用的终极指南
# 摘要
MIPI D-PHY作为一种高速、低功耗的物理层通信接口标准,广泛应用于移动和嵌入式系统。本文首先概述了MIPI D-PHY标准,并深入探讨了其物理层特性和协议基础,包括数据传输的速率、通道配置、差分信号设计以及传输模式和协议规范。接着,文章详细介绍了MIPI D-PHY在嵌入式系统中的硬件集成、软件驱动设计及实际应用案例,同时提出了性能测试与验
【SAP BASIS全面指南】:掌握基础知识与高级技能

# 摘要
SAP BASIS是企业资源规划(ERP)解决方案中重要的技术基础,涵盖了系统安装、配置、监控、备份、性能优化、安全管理以及自动化集成等多个方面。本文对SAP BASIS的基础配置进行了详细介绍,包括系统安装、用户管理、系统监控及备份策略。进一步探讨了高级管理技
【Talend新手必读】:5大组件深度解析,一步到位掌握数据集成
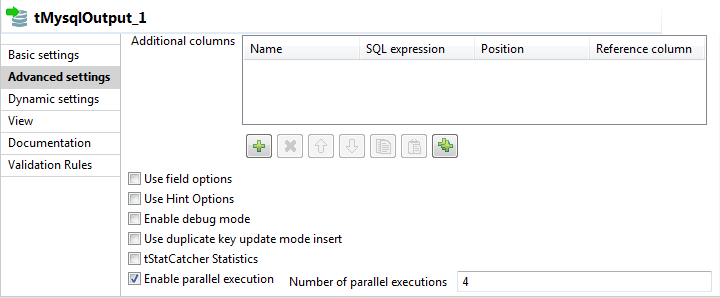
# 摘要
Talend是一款强大的数据集成工具,本文首先介绍了Talend的基本概念和安装配置方法。随后,详细解读了Talend的基础组件,包括Data Integration、Big Data和Cloud组件,并探讨了各自的核心功能和应用场景。进阶章节分析了Talend在实时数据集成、数据质量和合规性管理以及与其他工
网络安全新策略:Wireshark在抓包实践中的应用技巧

# 摘要
Wireshark作为一款强大的网络协议分析工具,广泛应用于网络安全、故障排除、网络性能优化等多个领域。本文首先介绍了Wireshark的基本概念和基础使用方法,然后深入探讨了其数据包捕获和分析技术,包括数据包结构解析和高级设置优化。文章重点分析了Wireshark在网络安全中的应用,包括网络协议分析、入侵检测与响应、网络取证与合规等。通过实
三角形问题边界测试用例的测试执行与监控:精确控制每一步

# 摘要
本文针对三角形问题的边界测试用例进行了深入研究,旨在提升测试用例的精确性和有效性。文章首先概述了三角形问题边界测试用例的基础理论,包括测试用例设计原则、边界值分析法及其应用和实践技巧。随后,文章详细探讨了三角形问题的定义、分类以及测试用例的创建、管理和执行过程。特别地,文章深入分析了如何控制测试环境与用例的精确性,并探讨了持续集成与边界测试整合的可能性。在测试结果分析与优化方面,本文提出了一系列故障分析方法和测试流程改进策略。最后,文章展望了边界
资源上传下载、课程学习等过程中有任何疑问或建议,欢迎提出宝贵意见哦~我们会及时处理!
点击此处反馈


专栏目录
最低0.47元/天 解锁专栏
买1年送3月
百万级
高质量VIP文章无限畅学
千万级
优质资源任意下载
C知道
免费提问 ( 生成式Al产品 )