【Discussion on Normality Verification】: Verification Methods for Normality Assumption in Linear Regression
发布时间: 2024-09-14 17:41:25 阅读量: 27 订阅数: 23 

Local linear M-estimator for random design model with dependent errors
# 1. Introduction to the Normality Assumption in Linear Regression
In conducting linear regression analysis, the normality assumption is one of the crucial prerequisites. In simple terms, the normality assumption posits that the dependent variable follows a normal distribution at each value of the independent variables. The validity of this assumption is vital for the parameter estimation and significance testing of the linear regression model. If the normality assumption does not hold, it may lead to inaccuracies in the regression analysis results, impacting the reliability and effectiveness of the model. Therefore, it is essential to verify the normality assumption in practice by checking if the residuals conform to a normal distribution.
# 2.1 Analysis of the Normal Distribution Concept
The normal distribution, also known as the Gaussian distribution, is one of the most common continuous probability distributions in statistics. Data from the natural world and various fields often exhibit a normal distribution pattern. Understanding the concept of the normal distribution is crucial for grasping subsequent statistical knowledge and the normality assumption in linear regression.
### 2.1.1 Definition of the Normal Distribution
The normal distribution is named after the mathematician Gauss and is described by the following probability density function:
$$ f(x | \mu, \sigma) = \frac{1}{\sqrt{2\pi\sigma^2}} e^{-\frac{(x-\mu)^2}{2\sigma^2}} $$
Here, $\mu$ represents the mean, and $\sigma$ is the standard deviation. The shape of the normal distribution is determined by these two parameters, with the mean dictating the position of the distribution, and the standard deviation determining its spread.
### 2.1.2 Characteristics of the Normal Distribution
Characteristics of the normal distribution include:
- Bell-shaped curve, symmetric about the center;
- Mean, median, and mode are equal;
- 68% of the data falls within one standard deviation of the mean, and 95% within two standard deviations;
- The intervals divided by three σ are known as the rule of thumb golden triangle.
### 2.1.3 Applications of the Normal Distribution
The normal distribution is widely applied in statistical analysis, hypothesis testing, quality control, and other fields. Its significance lies in the fact that many natural phenomena, social phenomena, as well as some physical and mathematical models exhibit the properties of a normal distribution.
In the next section, we will continue to explore the relationship between the normal distribution and hypothesis testing.
# 3. Linear Regression Model
### 3.1 Basic Concepts of Linear Regression
Linear regression is a statistical model used to study the relationship between independent variables (or explanatory variables) and a dependent variable. In linear regression, it is assumed that the relationship between the independent variables and the dependent variable can be described by a linear equation, which can be used to predict the values of the dependent variable. In practical applications, linear regression is typically divided into simple linear regression and multiple linear regression.
#### 3.1.1 Simple Linear Regression and Multiple Linear Regression
- **Simple Linear Regression**: When only one independent variable and one dependent variable are involved, simple linear regression is used. The equation of a simple linear regression model is expressed as: $Y = β0 + β1*X + ε$, where $Y$ is the dependent variable, $X$ is the independent variable, $β0$ and $β1$ are regression coefficients, and $ε$ represents error.
- **Multiple Linear Regression**: When multiple independent variables influence the dependent variable, multiple linear regression is used. The equation of a multiple linear regression model can be expressed as: $Y = β0 + β1*X1 + β2*X2 + ... + βn*Xn + ε$, where $n$ is the number of independent variables.
#### 3.1.2 Assumptions of the Linear Regression Model
In linear regression models, it is usually assumed that the data satisfies several assumptions:
1. **Linear Relationship**: There is a linear relationship between the independent variables and the dependent variable;
2. **Independence and Identical Distribution of Random Error Terms**: The error terms meet the assumption of being independently and identically distributed;
3. **Homoscedasticity (Constant Variance)**: The error terms have a constant variance;
4. **Normality of Residuals**: The model residuals follow a normal distribution.
### 3.2 Normality Assumption in Linear Regression
#### 3.2.1 Meaning of the Normality Assumption
In linear regression, the normality assumption requires that the model residuals follow a normal distribution. If the residuals do not conform to a normal distribution, it may lead to bias in parameter estimation, thereby affecting the predictive accuracy of the model.
#### 3.2.2 Impact of the Normality Assumption on Linear Regression
- **Validity of Parameter Estimation**: When the residuals of th

 百万级
高质量VIP文章无限畅学
百万级
高质量VIP文章无限畅学
 千万级
优质资源任意下载
千万级
优质资源任意下载
 C知道
免费提问 ( 生成式Al产品 )
C知道
免费提问 ( 生成式Al产品 )
0
0
相关推荐

专栏目录
最低0.47元/天 解锁专栏
买1年送3月
百万级
高质量VIP文章无限畅学
千万级
优质资源任意下载
C知道
免费提问 ( 生成式Al产品 )
最新推荐
【掌握Packet Tracer】:网络工程师必备的10个实践技巧与案例分析
# 摘要
本论文详细介绍了Packet Tracer在网络技术教育和实践中的应用,从基础操作到网络安全管理技巧,系统地阐述了网络拓扑构建、网络协议模拟、以及故障排除的策略和方法。文章还讨论了如何通过Packet Tracer进行高级网络协议的模拟实践,包括数据链路层、网络层和应用层协议的深入分析,以及使用AAA服务和网络监控工具进行身份认证与网络性能分析。本文旨在提供给网
【一步到位】解决cannot import name 'abs':彻底排查与预防秘籍
# 摘要
导入错误在软件开发中经常出现,它们可能导致程序无法正常执行。本文旨在分析导入错误的根本原因,并提供排查和预防这些错误的有效方法。通过深入研究错误追踪、代码审查、版本控制、环境与依赖管理等技术手段,本文提出了具体且实用的解决方案。文章还强调了编写良好编码规范、自动化检查、持续集成以及知识共享等预防策略的重要性,并通过实战案例分析来展示这些策略的应用效果。最后,本
【联想RD450X鸡血BIOS深度解析】:系统性能的幕后推手
# 摘要
本文详细探讨了联想RD450X服务器及其中的鸡血BIOS技术,旨在阐述BIOS在服务器中的核心作用、重要性以及性能优化潜力。通过对BIOS基本功能和组成的介绍,分析了鸡血BIOS相对于传统BIOS在性能提升方面的理论基础和技术手段。文中进一步讨论了BIOS更新、配置与优化的实践应用,并通过案例分析了鸡血BIOS在实际环境中的应用效果及常见问题的解决方案。最后,本
【打印机适配与调试的艺术】:掌握ESC-POS指令集在各打印机上的应用

# 摘要
本文深入探讨了打印机适配与调试的全面流程,涵盖了ESC-POS指令集的基础知识、编程实践、优化调整、高级调试技巧以及针对不同行业的需求解决方案。文章首先介绍了ESC-POS指令集的结构、核心指令和在不同打印机上的应用差异。随后,通过具体案例分析,展现了如何在
【RTEMS入门指南】:新手必读!30分钟掌握实时操作系统核心

# 摘要
本文详细介绍了RTEMS实时操作系统的架构、理论基础及其在嵌入式系统开发中的应用。首先概述了RTEMS的实时性和多任务调度策略,接着深入探讨了其核心组件、内核功能和编程模型。文中还指导了如何搭建RTEMS开发环境,包括工具链和开发板的配置,以及提供了一系列编程实践案例,涵盖任务管理、系统服务
【OpenMeetings界面革新】:打造个性化用户界面的实战教程
# 摘要
随着用户需求的多样化,对OpenMeetings这样的在线协作平台的界面提出了更高的要求。本文着重分析了界面革新的必要性,阐述了用户体验的重要性与界面设计原则。在实践开发章节中,详细探讨了界面开发的工具选择、技术栈、以及开发流程。此外,本文还强调了个性化界
【PSNR实战手册】:10个案例教你如何在项目中高效运用PSNR(附代码解析)
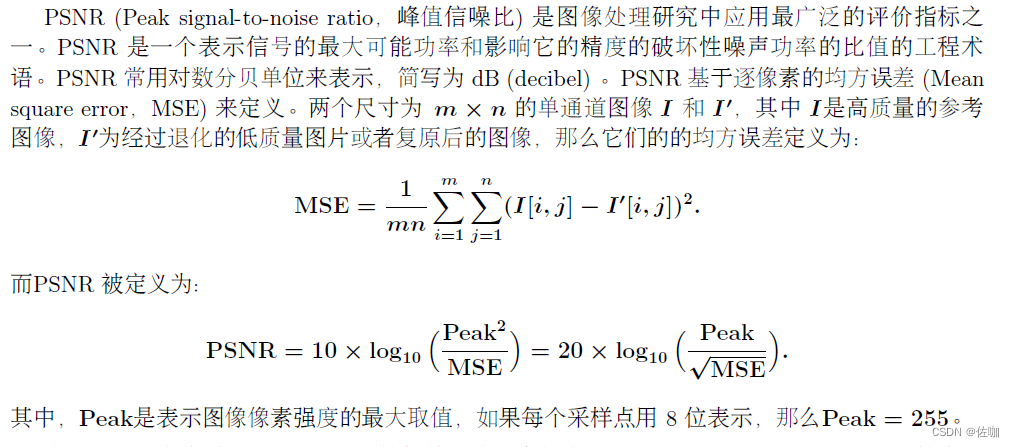
# 摘要
峰值信噪比(PSNR)是一种常用的衡量信号和图像质量的客观评估标准,它通过计算误差功率与最大可能信号功率的比值来量化质量。本文详细介绍了PSNR的理论基础、计算方法和评估标准,并探讨了其在视频压缩、图像处理、实时传输监测等不同领域的应用。文章进一步通过实战案例分析,深入研究PSNR在具体项目中的应用效果和性能监测。尽管PSNR具有局限性,但通过与其他评估
博通ETC OBU Transceiver:技术亮点与故障排查实用指南
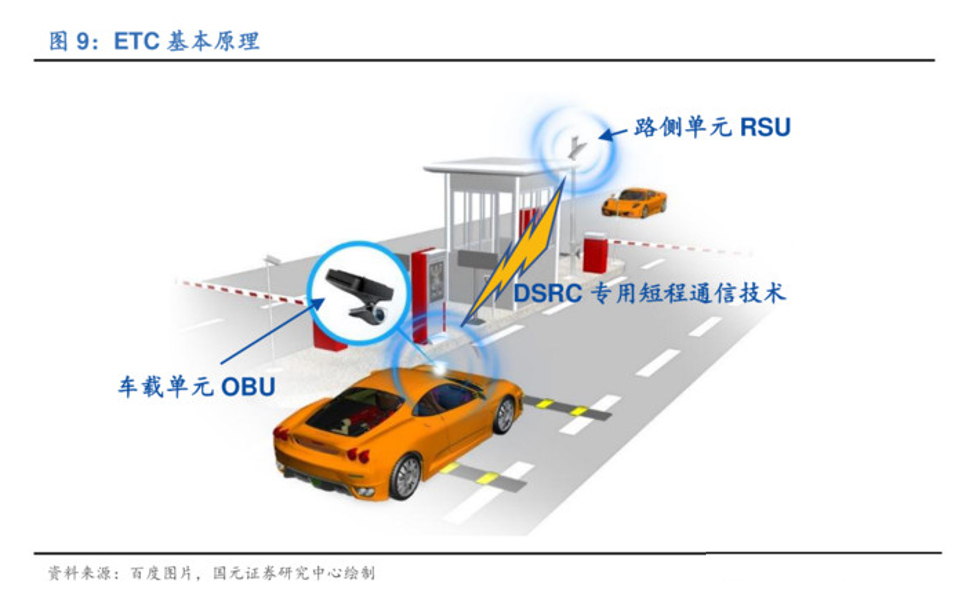
# 摘要
博通ETC OBU Transceiver作为电子收费系统的关键设备,其性能直接影响通信的稳定性和系统的可靠性。本文首先概述了OBU Transceiver的基本概念和功能架构,接着详细解析了其核心的技术亮点,包括先进的通信协议标准、数据加密技术,以及创新特性和实际应用案例。之后,本文深入探讨了故障排查的基础知识和高级技术,旨在为技术
【低频数字频率计软件界面创新】:打造用户友好交互体验

# 摘要
随着科技的不断进步,低频数字频率计的软件界面设计变得更加重要,它直接影响着用户的使用体验和设备的性能表现。本文首先概述了低频数字频率计软件界面设计的基本概念,接着深入探讨了用户交互理论基础,包括用户体验原则、交互设计模式和用户研究方法。随后,文章详细介绍了界面创新实践方法,其中包括创新设计流程
【企业实践中的成功故事】:ARXML序列化规则的应用案例剖析

# 摘要
随着汽车行业的快速发展,ARXML序列化规则已成为数据管理和业务流程中不可或缺的技术标准。本文首先概述了ARXML序列化规则的基础知识,包括其定义、应用范围及其在企业中的重要性。接着,文章详细分析了ARXML序列化规则的构成,以及如何在数据管理中实现数据导入导出和校验清洗,
资源上传下载、课程学习等过程中有任何疑问或建议,欢迎提出宝贵意见哦~我们会及时处理!
点击此处反馈


专栏目录
最低0.47元/天 解锁专栏
买1年送3月
百万级
高质量VIP文章无限畅学
千万级
优质资源任意下载
C知道
免费提问 ( 生成式Al产品 )