【Outlier Detection and Analysis】: Techniques for Identifying and Handling Outliers in Linear Regression
发布时间: 2024-09-14 17:35:33 阅读量: 49 订阅数: 23 
# 1. Introduction to Outlier Detection
In the fields of data analysis and machine learning, outliers are data points that significantly differ from the majority of the data, potentially due to measurement errors, abnormal conditions, or genuine characteristics. Outlier detection is a crucial step in data preprocessing, aiming to identify and handle these anomalies to ensure the reliability and accuracy of the modeling process. This chapter will delve into the concept of outlier detection, its applications, and commonly used methods to provide readers with a comprehensive understanding of the significance and handling of outliers in data analysis.
# 2. Fundamentals of Linear Regression
Linear regression is a classic machine learning method often used to establish linear relationships between features and targets. In this chapter, we will delve into the principles, advantages and disadvantages, and applications of linear regression.
### 2.1 What is Linear Regression
#### 2.1.1 Principles of Linear Regression
The core idea of linear regression is to predict output values by linearly combining input features, expressed mathematically as: $Y = βX + α$.
Here, $Y$ is the predicted value, $X$ is the feature, $β$ is the weight of the feature, and $α$ is the bias term.
#### 2.1.2 Advantages and Disadvantages of Linear Regression
- Advantages: Simple to understand and implement, low computational cost.
- Disadvantages: Poor fit for non-linear data, susceptible to the influence of outliers.
#### 2.1.3 Applications of Linear Regression
Linear regression is widely used for prediction and modeling, including but not limited to housing price prediction, sales trend analysis, and stock market fluctuation prediction.
### 2.2 Linear Regression Algorithms
Linear regression algorithms mainly include the least squares method, gradient descent method, and normal equation method.
#### 2.2.1 Least Squares Method
The least squares method is a technique for finding the optimal parameters by minimizing the sum of squared residuals between actual and predicted values.
```python
import numpy as np
from sklearn.linear_model import LinearRegression
# Create a linear regression model
model = LinearRegression()
# Fit the data
model.fit(X, y)
```
// Output model parameters
print(model.coef_, model.intercept_)
```
Output parameters: [β1, β2, ..., βn] α
#### 2.2.2 Gradient Descent Method
The gradient descent method is an iterative optimization algorithm that updates parameters iteratively to minimize the loss function.
```python
# Initialize parameters
weights = np.zeros(X.shape[1])
bias = 0
# Gradient descent iteration
for i in range(num_iterations):
# Compute gradient
grad = compute_gradient(X, y, weights, bias)
weights = weights - learning_rate * grad
bias = bias - learning_rate * np.sum(grad)
```
// Output optimal parameters
print(weights, bias)
```
Output parameters: [β1, β2, ..., βn] α
#### 2.2.3 Normal Equation Method
The normal equation method obtains the optimal parameters by solving the closed-form solution directly.
```python
# Calculate closed-form solution
theta = np.linalg.inv(X.T.dot(X)).dot(X.T).dot(y)
```
```
Output parameters: [β1, β2, ..., βn] α
```
This chapter provides a detailed introduction to the fundamentals of linear regression, including principles, advantages and disadvantages, and commonly used algorithms. Understanding these contents can better apply the linear regression model for data analysis and prediction.
# 3. Outlier Detection Methods
### 3.1 Outlier Detection Based on Statistical Methods
In the field of data analysis, an outlier is a value that significantly differs from other observations, possibly caused by noise, data collection errors, or special circumstances. Statistical met***mon statistical methods include the Z-Score method and the IQR method.
#### 3.1.1 Z-Score Method
The Z-Score method is a commonly used outlier detection method that determines whether a data point is an outlier by calculating its deviation from the mean. The specific steps are as follows:
```python
# Calculate Z-Score
Z_score = (X - mean) / std
if Z_score > threshold:
# Detected as an outlier
print("Outlier Detected using Z-Score method")
```
The Z-Score method is straightforward and suitable for situations where data is relatively集中, but it has high requirements for data distribution.
#### 3.1.2 IQR Method
The IQR method uses the interquartile range (Interquartile Range, IQR) to identify outliers by calculating the upper and lower quartiles to determine the data distribution. The detection method is as follows:
```python
# Calculate upper and lower quartiles
Q1 = np.percentile(data, 25)
Q3 = np.percentile(data, 75)
IQR = Q3 - Q1
# Calculate IQR outlier boundaries
lower_bound = Q1 - 1.5 * IQR
upper_bound = Q3 + 1.5 * IQR
if data < lower_bound or data > upper_bound:
# Detected as an outlier
print("Outlier Detected using IQR method")
```
The IQR method is relatively robust and suitable for situations where data is relatively分散, with low requirements for data distribution.
### 3.2 Outlier Detection Based on Distance
Outlier detect***mon methods include the K-Nearest Neighbors (KNN) method and the Local Outlier Factor (LOF) method.
#### 3.2.1 K-Nearest Neighbors (KNN) Method
The KNN method determines whether a data point is an outlier by calculating the distance between the data point and its K nearest neighbors. If a data point is far from its neighbors, it may be an outlier. The specific steps are as follows:
```python
# Calculate the distance to the K nearest neighbors
distances = calculate_distances(data_point, neighbors)
if average_distance > threshold:
# Detected as an outlier
print("Outlier Detected using KNN method")
```
#### 3.2.2 LOF (Local Outlier Factor) Method
The LOF method is a density-based outlier detection method that determines whether a data point is an outlier by calculating the density relationship between the data point and its neighbors. The higher the LOF, the more likely the data point is an outlier. The specific steps are as follows:
```python
# Calculate LOF
LOF = calculate_LOF(data_point, neighbors)
if LOF > threshold:
# Detected as an outlier
print("Outlier Detected using LOF method")
```
### 3.3 Outlier Detection Based on Density
Outlier detection me***mon methods include the DBSCAN method and the HBOS method.
#### 3.3.1 DBSCAN Method
DBSCAN is a density-based clustering method that can be used to identify outliers. It defines the minimum number of data points within a neighborhood and the distance threshold to determine whether a data point is a core point, a border point, or an outlier.
#### 3.3.2 HBOS (Histogram-based Outlier Score) Method
The HBOS method is a histogram-based outlier detection method that measures the anomaly degree of data points by constructing histograms of the feature space. HBOS is highly efficient and scalable when dealing with large datasets.
Through this section, we understand common outlier detection methods, including those based on statistics, distance, and density. These methods are of significant importance in actual data analysis, helping us identify anomalies in data and take appropriate measures.
# 4. Techniques for Handling Outliers in Linear Regression
### 4.1 Impact of Outliers on Linear Regression
In linear regression analysis, outliers can adversely affect the model, leading to decreased accuracy and distorted parameter estimation. Outliers may cause regression coefficients to deviate from their true values, reducing the model's predictive power and increasing errors. Therefore, handling outliers is crucial.
### 4.2 Methods for Handling Outliers
In linear regression, dealing with outliers is an essential step. The following will introduce several common outlier handling methods:
#### 4.2.1 Deleting Outliers
Deleting outliers is one of the simplest and most direct methods. This method is suitable when there are few outliers in the dataset and they do not affect the overall data distribution. By identifying and removing outliers, the model can become more accurate.
```python
# Code example for deleting outliers
clean_data = original_data[(original_data['feature'] > lower_bound) & (original_data['feature'] < upper_bound)]
```
#### 4.2.2 Replacing Outliers
Replacing outliers is another common method suitable when outliers have a minor impact on the overall data distribution. Outliers can be replaced with the mean, median, or other appropriate values to stabilize the data.
```python
# Code example for replacing outliers
original_data.loc[original_data['feature'] > upper_bound, 'feature'] = median_value
```
#### 4.2.3 Outlier Transformation
Outlier transformation is a more complex method that can transform outliers to better fit the overall data distribution, ***mon transformation methods include taking logarithms and square roots.
```python
# Code example for outlier transformation to median
original_data['feature'] = np.where(original_data['feature'] > upper_bound, median_value, original_data['feature'])
```
By employing these handling methods, we can effectively address the issue of outliers in linear regression, improving the stability and accuracy of the model.
### Table Example: Comparison of Common Outlier Handling Methods
| Method | Suitable Scenarios | Advantages | Disadvantages |
| --------------- | ------------------------------------------ | -------------------------------------- | ------------------------------------ |
| Deleting Outliers | Outliers are very few and do not affect the overall data distribution | Simple and direct | May lose valid information |
| Replacing Outliers | There are not many outliers, with a minor impact on the overall data | Can retain original data information | May introduce new errors |
| Outlier Transformation | Need to retain outliers, reduce their impact | Can preserve original data characteristics | Transformation method selection is subjective |
This is a brief introduction to outlier handling techniques. Choosing an appropriate method based on specific situations can enhance the accuracy and reliability of data analysis.
# 5. Case Analysis
### 5.1 Data Preparation and Exploratory Analysis
Before conducting outlier detection and linear regression modeling, it is crucial to prepare the data and perform exploratory analysis. This stage is very important because the quality of the data will directly affect the subsequent modeling results.
First, import the necessary libraries and load the dataset:
```python
import pandas as pd
import numpy as np
# Load the dataset
data = pd.read_csv('your_dataset.csv')
```
Next, we can inspect the basic information of the dataset, including data types and missing values:
```python
# View basic information of the dataset
print(***())
# View statistical information of numerical features
print(data.describe())
```
After grasping the basic information of the data, we can perform visual explorations of the data, such as plotting histograms and boxplots, to better understand the data distribution and potential outliers:
```python
import matplotlib.pyplot as plt
import seaborn as sns
# Plot the data distribution histogram
plt.figure(figsize=(12, 6))
sns.histplot(data['feature'], bins=20, kde=True)
plt.title('Feature Distribution')
plt.show()
# Plot the boxplot
plt.figure(figsize=(8, 6))
sns.boxplot(x=data['feature'])
plt.title('Boxplot of Feature')
plt.show()
```
Through the above steps, we can gain a preliminary understanding of the data, preparing us for the subsequent outlier detection and handling and linear regression modeling.
### 5.2 Outlier Detection
Outlier detection r***mon outlier detection methods include those based on statistics, distance, and density.
#### 5.2.1 Z-Score Method
The Z-Score method is a technique that uses the standard deviation and mean of the data to determine if a data point is an outlier. Generally, a data point with an absolute Z-Score greater than 3 can be identified as an outlier.
Here is the code implementation of the Z-Score method:
```python
from scipy import stats
# Calculate Z-Score
z_scores = np.abs(stats.zscore(data['feature']))
# Set the threshold
threshold = 3
# Determine outliers
outliers = data['feature'][z_scores > threshold]
print("Number of Z-Score outliers:", outliers.shape[0])
print("Outliers:\n", outliers)
```
#### 5.2.2 IQR Method
The IQR method uses quartiles to determine outliers. Outliers are typically defined as values less than Q1-1.5 * IQR or greater than Q3+1.5 * IQR.
Here are the steps for implementing the IQR method:
```python
Q1 = data['feature'].quantile(0.25)
Q3 = data['feature'].quantile(0.75)
IQR = Q3 - Q1
# Define outlier thresholds
lower_bound = Q1 - 1.5 * IQR
upper_bound = Q3 + 1.5 * IQR
# Determine outliers
outliers_iqr = data[(data['feature'] < lower_bound) | (data['feature'] > upper_bound)]['feature']
print("Number of IQR outliers:", outliers_iqr.shape[0])
print("Outliers:\n", outliers_iqr)
```
By using the above outlier detection methods, we can preliminarily understand the anomalies in the dataset and provide a reference for the next steps of handling.
### 5.3 Outlier Handling
After identifying outliers, we need to handle these outliers to ensure they do not negatively affect the accuracy of the linear regression model.
#### 5.3.1 Deleting Outliers
One method is to directly delete outliers when they are few and unlikely to reflect the true situation, which is a relatively simple handling method.
```python
# Delete outliers detected by the Z-Score method
data_cleaned = data.drop(outliers.index)
# Delete outliers detected by the IQR method
data_cleaned_iqr = data.drop(outliers_iqr.index)
```
#### 5.3.2 Replacing Outliers
In cases where outliers cannot be deleted, they can be handled by replacement, such as replacing them with the median or mean.
```python
# Replace Z-Score detected outliers with the median
data['feature'].loc[z_scores > threshold] = data['feature'].median()
# Replace IQR detected outliers with the mean
data['feature'].loc[data['feature'] < lower_bound] = data['feature'].mean()
data['feature'].loc[data['feature'] > upper_bound] = data['feature'].mean()
```
#### 5.3.3 Outlier Transformation
Another method for handling outliers is to transform them, such as log transformation or truncation transformation, to bring them closer to values within the normal range.
```python
# Log transformation
data['feature_log'] = np.log(data['feature'])
# Truncation transformation
data['feature_truncate'] = np.where(data['feature'] > upper_bound, upper_bound, np.where(data['feature'] < lower_bound, lower_bound, data['feature']))
```
Through the above outlier handling methods, we can better adjust the dataset to make it more suitable for linear regression modeling.
### 5.4 Linear Regression Modeling
Finally, we proceed with linear regression modeling, using the cleaned dataset for model training and prediction.
First, we import the linear regression model and fit the data:
```python
from sklearn.linear_model import LinearRegression
from sklearn.model_selection import train_test_split
from sklearn.metrics import mean_squared_error
X = data_cleaned[['feature']]
y = data_cleaned['target']
X_train, X_test, y_train, y_test = train_test_split(X, y, test_size=0.2, random_state=42)
# Initialize the linear regression model
model = LinearRegression()
# Fit the model
model.fit(X_train, y_train)
```
Then, we can evaluate the model, for example, by calculating the mean squared error:
```python
# Predict
y_pred = model.predict(X_test)
# Calculate mean squared error
mse = mean_squared_error(y_test, y_pred)
print("Mean Squared Error:", mse)
```
Through these steps, we have completed the entire process of outlier detection, handling, and linear regression modeling. Such case analysis helps us gain a deeper understanding of the impact of outliers on linear regression and how to address these impacts.
# 6.1 Advanced Outlier Detection Algorithms
In previous chapters, we introduced some common outlier detection methods, including statistical, distance-based, and density-based methods. In practical data processing, sometimes we need more advanced algorithms to deal with complex scenarios. This section will introduce some advanced outlier detection algorithms to help us better identify anomalies.
#### 6.1.1 One-Class SVM
One-Class SVM (Support Vector Machine) is an outlier detection algorithm based on support vector machines. Its fundamental idea is to separate normal samples from outlier samples by constructing a hyperplane in a high-dimensional space, ***pared to traditional SVM, One-Class SVM focuses on only one class of samples (normal samples) and attempts to find the smallest enclosing region, where samples within the region are considered normal, and those outside are regarded as outliers.
In practical applications, One-Class SVM can be applied to datasets with relatively few outliers and regular data distributions, effectively identifying potential anomalies.
Let's take a look at a simple example using Python's scikit-learn library to implement the One-Class SVM outlier detection algorithm:
```python
# Import necessary libraries
from sklearn import svm
import numpy as np
# Create some example data
X = np.array([[1, 2], [1, 3], [2, 2], [8, 8], [9, 8]])
# Define the One-Class SVM model
clf = svm.OneClassSVM(nu=0.1, kernel="rbf", gamma=0.1)
clf.fit(X)
# Predict outliers
pred = clf.predict(X)
print(pred)
```
Code explanation:
- First, import the required libraries and create a simple two-dimensional dataset X.
- Then define the One-Class SVM model, set parameters, and train the model.
- Finally, predict the outliers in dataset X and output the results.
#### 6.1.2 Isolation Forest
Isolation Forest is an outlier detection algorithm based on the Random Forest. It uses the depth of tree branches to identify outliers by constructing a random tree to split the data, ***pared to other algorithms, Isolation Forest has higher computational efficiency and good adaptability to large-scale datasets.
Let's demonstrate the use of Isolation Forest with an example:
```python
# Import necessary libraries
from sklearn.ensemble import IsolationForest
import numpy as np
# Create some example data
X = np.array([[1, 2], [1, 3], [2, 2], [8, 8], [9, 8]])
# Define the Isolation Forest model
clf = IsolationForest(contamination=0.1)
clf.fit(X)
# Predict outliers
pred = clf.predict(X)
print(pred)
```
This code shows how to use the Isolation Forest model from scikit-learn to detect outliers in dataset X and output the prediction results.
This concludes the simple introduction and example code for the advanced outlier detection algorithms One-Class SVM and Isolation Forest. In practical applications, choosing the appropriate outlier detection algorithm based on the characteristics of the dataset is crucial. Through continuous trial and practice, we can better understand and apply these algorithms.

 百万级
高质量VIP文章无限畅学
百万级
高质量VIP文章无限畅学
 千万级
优质资源任意下载
千万级
优质资源任意下载
 C知道
免费提问 ( 生成式Al产品 )
C知道
免费提问 ( 生成式Al产品 )
0
0
相关推荐

专栏目录
最低0.47元/天 解锁专栏
买1年送3月
百万级
高质量VIP文章无限畅学
千万级
优质资源任意下载
C知道
免费提问 ( 生成式Al产品 )
最新推荐
JY01A直流无刷IC全攻略:深入理解与高效应用

# 摘要
本文详细介绍了JY01A直流无刷IC的设计、功能和应用。文章首先概述了直流无刷电机的工作原理及其关键参数,随后探讨了JY01A IC的功能特点以及与电机集成的应用。在实践操作方面,本文讲解了JY01A IC的硬件连接、编程控制,并通过具体
数据备份与恢复:中控BS架构考勤系统的策略与实施指南

# 摘要
在数字化时代,数据备份与恢复已成为保障企业信息系统稳定运行的重要组成部分。本文从理论基础和实践操作两个方面对中控BS架构考勤系统的数据备份与恢复进行深入探讨。文中首先阐述了数据备份的必要性及其对业务连续性的影响,进而详细介绍了不同备份类型的选择和备份周期的制定。随后,文章深入解析了数据恢复的原理与流程,并通过具体案例分析展示了恢复技术的实际应用。接着,本文探讨
【TongWeb7负载均衡秘笈】:确保请求高效分发的策略与实施
.webp)
# 摘要
本文从基础概念出发,对负载均衡进行了全面的分析和阐述。首先介绍了负载均衡的基本原理,然后详细探讨了不同的负载均衡策略及其算法,包括轮询、加权轮询、最少连接、加权最少连接、响应时间和动态调度算法。接着,文章着重解析了TongWeb7负载均衡技术的架构、安装配置、高级特性和应用案例。在实施案例部分,分析了高并发Web服务和云服务环境下负载
【Delphi性能调优】:加速进度条响应速度的10项策略分析

# 摘要
本论文首先概述了信号定位技术的基本概念和重要性,随后深入分析了三角测量和指纹定位两种主要技术的工作原理、实际应用以及各自的优势与不足。通过对三角测量定位模型的解析,我们了解到其理论基础、精度影响因素以及算法优化策略。指纹定位技术部分,则侧重于其理论框架、实际操作方法和应用场
【PID调试实战】:现场调校专家教你如何做到精准控制
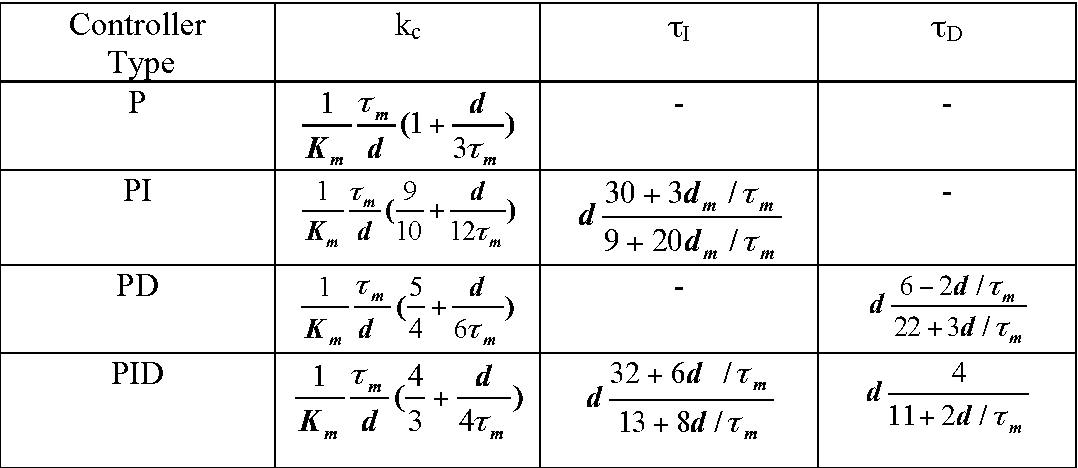
# 摘要
PID控制作为一种历史悠久的控制理论,一直广泛应用于工业自动化领域中。本文从基础理论讲起,详细分析了PID参数的理论分析与选择、调试实践技巧,并探讨了PID控制在多变量、模糊逻辑以及网络化和智能化方面的高级应用。通过案例分析,文章展示了PID控制在实际工业环境中的应用效果以及特殊环境下参数调整的策略。文章最后展望了PID控制技术的发展方
网络同步新境界:掌握G.7044标准中的ODU flex同步技术
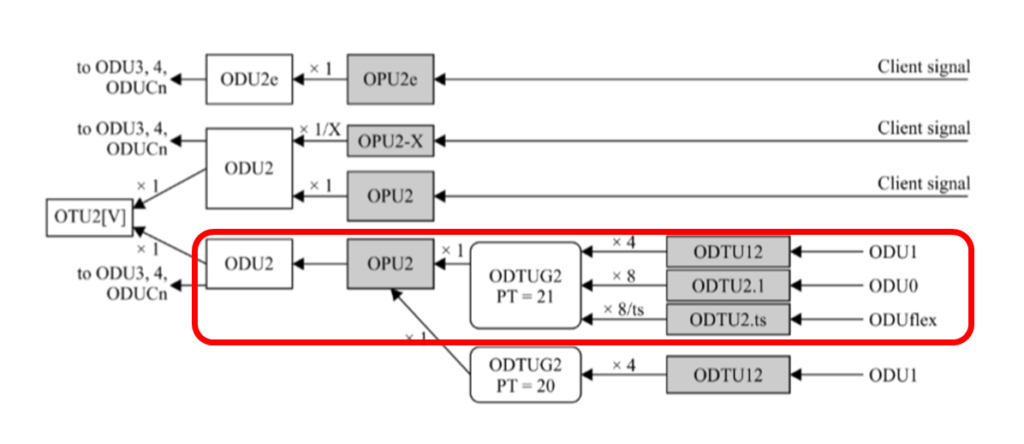
# 摘要
本文详细探讨了G.7044标准与ODU flex同步技术,首先介绍了该标准的技术原理,包括时钟同步的基础知识、G.7044标准框架及其起源与应用背景,以及ODU flex技术
字符串插入操作实战:insert函数的编写与优化
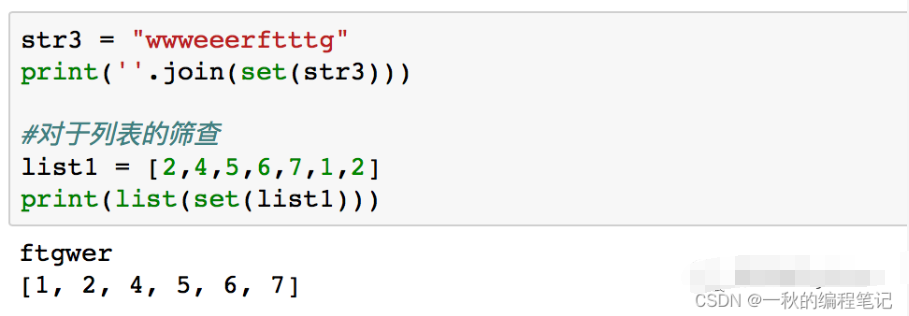
# 摘要
字符串插入操作是编程中常见且基础的任务,其效率直接影响程序的性能和可维护性。本文系统地探讨了字符串插入操作的理论基础、insert函数的编写原理、使用实践以及性能优化。首先,概述了insert函数的基本结构、关键算法和代码实现。接着,分析了在不同编程语言中insert函数的应用实践,并通过性能测试揭示了各种实现的差异。此外,本文还探讨了性能优化策略,包括内存使用和CPU效率提升,并介绍了高级数据结
环形菜单的兼容性处理

# 摘要
环形菜单作为一种用户界面元素,为软件和网页设计提供了新的交互体验。本文首先介绍了环形菜单的基本知识和设计理念,重点探讨了其通过HTML、CSS和JavaScript技术实现的方法和原理。然后,针对浏览器兼容性问题,提出了有效的解决方案,并讨论了如何通过测试和优化提升环形菜单的性能和用户体验。本
资源上传下载、课程学习等过程中有任何疑问或建议,欢迎提出宝贵意见哦~我们会及时处理!
点击此处反馈


专栏目录
最低0.47元/天 解锁专栏
买1年送3月
百万级
高质量VIP文章无限畅学
千万级
优质资源任意下载
C知道
免费提问 ( 生成式Al产品 )