机器学习中的线性相关性:特征选择与降维的进阶技巧
发布时间: 2024-07-09 01:05:12 阅读量: 56 订阅数: 42 
# 1. 机器学习中的线性相关性概述
机器学习中,线性相关性是衡量两个或多个特征之间线性关系强度的指标。理解线性相关性对于特征选择和降维等机器学习任务至关重要。
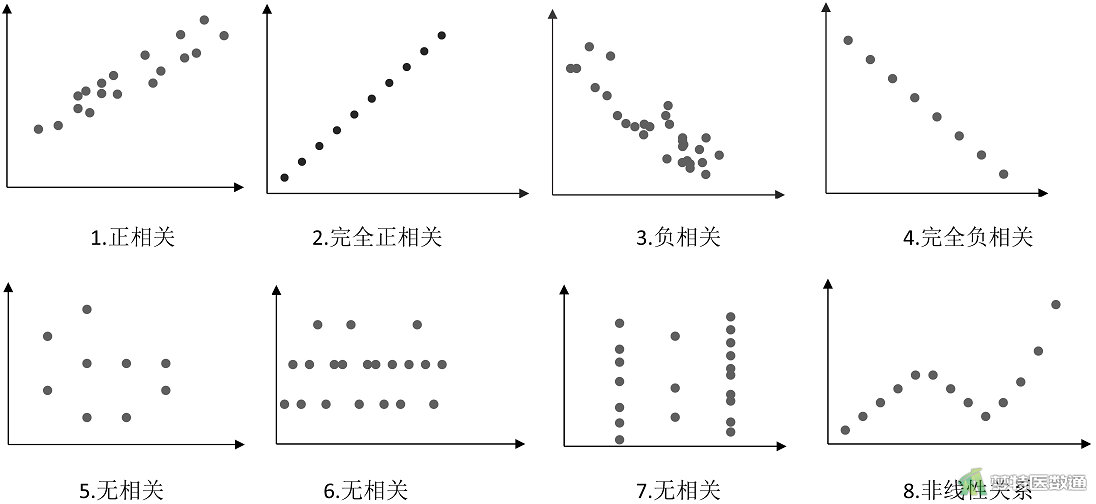
线性相关性度量主要包括相关系数和信息增益。相关系数表示两个特征之间的线性相关程度,范围从-1到1,其中-1表示完全负相关,1表示完全正相关,0表示无相关性。信息增益度量一个特征对目标变量预测能力的增加,它考虑了特征的熵和条件熵。
特征选择旨在从原始特征集中选择出与目标变量最相关、最具信息量的特征子集。降维则通过将高维数据投影到低维空间来减少数据维度,同时保留关键信息。
# 2.1 线性相关性的度量与特征选择
### 2.1.1 相关系数和信息增益
**相关系数**是衡量两个变量之间线性相关性的统计量,其值在[-1, 1]之间。相关系数为正值表示正相关,为负值表示负相关,为0表示不相关。
**计算公式:**
```python
corr = (cov(X, Y)) / (std(X) * std(Y))
```
其中:
* `cov` 为协方差
* `std` 为标准差
**信息增益**是衡量一个特征对目标变量区分能力的度量,其值越大表示区分能力越强。
**计算公式:**
```python
IG(X, Y) = H(Y) - H(Y | X)
```
其中:
* `H(Y)` 为目标变量的熵
* `H(Y | X)` 为在给定特征 `X` 条件下目标变量的条件熵
### 2.1.2 卡方检验和互信息
**卡方检验**是一种用于检验两个分类变量之间是否独立的统计检验。其值越大表示相关性越强。
**计算公式:**
```python
chi2 = sum((O - E)^2 / E)
```
其中:
* `O` 为观测频率
* `E` 为期望频率
**互信息**是一种衡量两个变量之间非线性相关性的度量,其值越大表示相关性越强。
**计算公式:**
```python
MI(X, Y) = sum(p(x, y) * log(p(x, y) / (p(x) * p(y))))
```
其中:
* `p(x, y)` 为联合概率
* `p(x)` 为 `X` 的概率
* `p(y)` 为 `Y` 的概率
# 3.1 特征选择算法的实现
特征选择算法可以分为三种主要类型:过滤法、包裹法和嵌入法。
#### 3.1.1 过滤法
过滤法基于特征的统计属性(如相关系数、信息增益等)对特征进行评分,然后根据评分阈值选择特征。过滤法计算效率高,但可能导致次优特征选择结果。
**代码示例:**
```python
import pandas as pd
from sklearn.feature_selection import SelectKBest, chi2
# 加载数据
data = pd.read_csv('data.csv')
# 计算卡方检验得分
scores = SelectKBest(chi2, k=10).fit(data.drop('target', axis=1), data['target'])
# 选择特征
selected_features = data.drop('target', axis=1).columns[scores.get_support()]
```
**逻辑分析:**
* `SelectKBest`类用于基于卡方检验得分选择前`k`个特征。
* `fit`方法将数据和目标变量拟合到模型中,计算每个特征的卡方检验得分。
* `get_support`方法返回布尔数组,指示哪些特征被选中。
#### 3.1.2 包裹法
包裹法将特征选择问题视为一个组合优化问题,通过评估所有可能的特征组合来选择最

 百万级
高质量VIP文章无限畅学
百万级
高质量VIP文章无限畅学
 千万级
优质资源任意下载
千万级
优质资源任意下载
 C知道
免费提问 ( 生成式Al产品 )
C知道
免费提问 ( 生成式Al产品 )
0
0
相关推荐

专栏简介
本专栏深入探讨了机器学习中的线性相关性,重点关注其在特征选择和降维中的应用。通过一系列文章,专栏揭示了线性相关性的本质,并提供了实用指南,帮助读者了解如何利用线性相关性来提高机器学习模型的性能。文章涵盖了各种主题,包括特征选择和降维的利器、进阶技巧、常见问题解答、最佳实践、最新趋势、数学原理、算法实现、性能评估、案例研究和应用场景。通过深入浅出的讲解和丰富的示例,专栏旨在为读者提供全面的知识和实践技能,以充分利用线性相关性,从而优化机器学习模型并获得更好的结果。
专栏目录

文章持续更新中,敬请期待~
最低0.47元/天 解锁专栏
买1年送3个月
百万级
高质量VIP文章无限畅学
千万级
优质资源任意下载
C知道
免费提问 ( 生成式Al产品 )
最新推荐
【R语言极值事件预测】:评估和预测极端事件的影响,evd包的全面指南

# 1. R语言极值事件预测概览
R语言,作为一门功能强大的统计分析语言,在极值事件预测领域展现出了其独特的魅力。极值事件,即那些在统计学上出现概率极低,但影响巨大的事件,是许多行业风险评估的核心。本章节,我们将对R语言在极值事件预测中的应用进行一个全面的概览。
首先,我们将探究极值事
R语言数据分析高级教程:从新手到aov的深入应用指南
# 1. R语言基础知识回顾
## 1.1 R语言简介
R语言是一种开源编程语言和软件环境,特别为统计计算和图形表示而设计。自1997年由Ross Ihaka和Robert Gentleman开发以来,R已经成为数据科学领域广受欢迎的工具。它支持各种统计技术,包括线性与非线性建模、经典统计测试、时间序列分析、分类、聚类等,并且提供了强大的图形能力。
## 1.2 安装与配置R环境
要开始使用R语言,首先需要在计算机上安装R环境。用户可以访问官方网站
【R语言时间序列预测大师】:利用evdbayes包制胜未来
# 1. R语言与时间序列分析基础
在数据分析的广阔天地中,时间序列分析是一个重要的分支,尤其是在经济学、金融学和气象学等领域中占据
R语言YieldCurve包优化教程:债券投资组合策略与风险管理
# 1. R语言YieldCurve包概览
## 1.1 R语言与YieldCurve包简介
R语言作为数据分析和统计计算的首选工具,以其强大的社区支持和丰富的包资源,为金融分析提供了强大的后盾。YieldCurve包专注于债券市场分析,它提供了一套丰富的工具来构建和分析收益率曲线,这对于投资者和分析师来说是不可或缺的。
## 1.2 YieldCurve包的安装与加载
在开始使用YieldCurve包之前,首先确保R环境已经配置好,接着使用`install.packages("YieldCurve")`命令安装包,安装完成后,使用`library(YieldCurve)`加载它。
``
【保险行业extRemes案例】:极端值理论的商业应用,解读行业运用案例
# 1. 极端值理论概述
极端值理论是统计学的一个重要分支,专注于分析和预测在数据集中出现的极端情况,如自然灾害、金融市场崩溃或保险索赔中的异常高额索赔。这一理论有助于企业和机构理解和量化极端事件带来的风险,并设计出更有效的应对策略。
## 1.1 极端值理论的定义与重要性
极端值理论提供了一组统计工具,
【R语言编程实践手册】:evir包解决实际问题的有效策略

# 1. R语言与evir包概述
在现代数据分析领域,R语言作为一种高级统计和图形编程语言,广泛应用于各类数据挖掘和科学计算场景中。本章节旨在为读者提供R语言及其生态中一个专门用于极端值分析的包——evir——的基础知识。我们从R语言的简介开始,逐步深入到evir包的核心功能,并展望它在统计分析中的重要地位和应用潜力。
首先,我们将探讨R语言作为一种开源工具的优势,以及它如何在金融
R语言数据包个性化定制:满足复杂数据分析需求的秘诀

# 1. R语言简介及其在数据分析中的作用
## 1.1 R语言的历史和特点
R语言诞生于1993年,由新西兰奥克兰大学的Ross Ihaka和Robert Gentleman开发,其灵感来自S语言,是一种用于统计分析、图形表示和报告的编程语言和软件环境。R语言的特点是开源、功能强大、灵活多变,它支持各种类型的数据结
【R语言parma包案例分析】:经济学数据处理与分析,把握经济脉动
# 1. 经济学数据处理与分析的重要性
经济数据是现代经济学研究和实践的基石。准确和高效的数据处理不仅关系到经济模型的构建质量,而且直接影响到经济预测和决策的准确性。本章将概述为什么在经济学领域中,数据处理与分析至关重要,以及它们是如何帮助我们更好地理解复杂经济现象和趋势。
经济学数据处理涉及数据的采集、清洗、转换、整合和分析等一系列步骤,这不仅是为了保证数据质量,也是为了准备适合于特
【R语言统计推断】:ismev包在假设检验中的高级应用技巧
# 1. R语言与统计推断基础
## 1.1 R语言简介
R语言是一种用于统计分析、图形表示和报告的编程语言和软件环境。由于其强大的数据处理能力、灵活的图形系统以及开源性质,R语言被广泛应用于学术研究、数据分析和机器学习等领域。
## 1.2 统计推断基础
统计推断是统计学中根据样本数据推断总体特征的过程。它包括参数估计和假设检验两大主要分支。参数估计涉及对总体参数(如均值、方差等)的点估计或区间估计。而
【数据清洗艺术】:R语言density函数在数据清洗中的神奇功效
# 1. 数据清洗的必要性与R语言概述
## 数据清洗的必要性
在数据分析和挖掘的过程中,数据清洗是一个不可或缺的环节。原始数据往往包含错误、重复、缺失值等问题,这些问题如果不加以处理,将严重影响分析结果的准确性和可靠性。数据清洗正是为了纠正这些问题,提高数据质量,从而为后续的数据分析和模型构建打下坚实的基础。
## R语言概述
R语言是一种用于统计分析
资源上传下载、课程学习等过程中有任何疑问或建议,欢迎提出宝贵意见哦~我们会及时处理!
点击此处反馈


专栏目录
文章持续更新中,敬请期待~
最低0.47元/天 解锁专栏
买1年送3个月
百万级
高质量VIP文章无限畅学
千万级
优质资源任意下载
C知道
免费提问 ( 生成式Al产品 )