Practical Tips for Hardware Debugging with Keil5
发布时间: 2024-09-15 13:42:46 阅读量: 42 订阅数: 23 
# Keil5 Hardware Debugging Tips and Tricks
## 2.1 Breakpoint Debugging
### 2.1.1 Setting and Using Breakpoints
Setting breakpoints in Keil5 is straightforward; simply click on the left side of the line number in the code. Breakpoints are indicated by a red circle.
To delete a breakpoint, just click on it again.
Breakpoints can be used to pause program execution at specific points, allowing you to check the program's state. This is very useful for debugging code, as it lets you examine variable values, check the contents of registers, and step through the code line by line.
### 2.1.2 Breakpoint Conditions and Filtering
In addition to setting simple breakpoints, Keil5 also allows you to set conditional breakpoints. Conditional breakpoints will trigger only when a specific condition is met.
For instance, you can set a breakpoint to trigger only when the value of a specific variable is greater than 10. This is particularly useful for debugging errors that occur only under certain conditions.
Keil5 also allows you to filter breakpoints. This allows you to trigger only specific types of breakpoints.
For example, you can filter out breakpoints that trigger only in source code files. This is very useful when debugging large projects where you might not want to trigger breakpoints in library code.
## 2. Keil5 Debugging Techniques
### 2.1 Breakpoint Debugging
#### 2.1.1 Setting and Using Breakpoints
Breakpoints are one of the most commonly used tools in debugging, allowing the program execution to pause at a specified location for state inspection. In Keil5, breakpoints can be set with the following steps:
1. Place the cursor at the desired breakpoint location in the source code editor.
2. Right-click and select "Toggle Breakpoint" or press F9.
3. Breakpoints will appear as red circles next to the line numbers.
Once set, the program will pause at that location when executed, and the debug window will appear. The debug window includes:
***Program Counter (PC):** The address of the instruction currently being executed.
***Registers:** The current values of the CPU registers.
***Stack:** The stack frames for function calls and local variables.
***Variables:** The values of variables in the current scope.
#### 2.1.2 Breakpoint Conditions and Filtering
Besides regular breakpoints, Keil5 also allows setting conditional and filtered breakpoints.
**Conditional breakpoints:** Trigger a breakpoint only when a specific condition is met. For example, set a conditional breakpoint to trigger only when variable `x` is greater than 10.
**Filtered breakpoints:** Trigger only breakpoints that meet specific conditions. For example, set a filtered breakpoint to trigger only for breakpoints associated with a specific function.
### 2.2 Step-by-Step Debugging
#### 2.2.1 Modes and Usage of Step-by-Step Debugging
Step-by-step debugging allows for the execution of programs one step at a time, checking the program state after each step. In Keil5, there are several step-by-step debugging modes:
***F10:** Execute the next instruction step by step.
***F11:** Execute the next line of source code step by step.
***Shift+F11:** Step into a function call.
#### 2.2.2 Viewing Registers and Memory
During step-by-step debugging, you can examine the contents of registers and memory. The register window displays the current values of the CPU registers, while the memory window shows the contents of memory within a specified address range.
### 2.3 Variable Monitoring
#### 2.3.1 Viewing and Modifying Variables
Keil5 allows you to view and modify variable values. The variables window displays the values of all variables in the current scope. You can right-click on a variable and choose "Modify Value" to change its value.
#### 2.3.2 Monitoring Variables and Breakpoints
Keil5 also allows monitoring variable values. You can right-click on a variable and choose "Add Watch" to add it to the watch list. When the value of a variable changes, the watch list will be updated.
Additionally, you can set watchpoint breakpoints that trigger only when the watched variable's value changes. This is very useful for debugging errors related to specific variables.
## 3. Keil5 Debugging Practices
### 3.1 Hardware Debugging Interfaces
#### 3.1.1 JTAG Interface and SWD Interface
Keil5 supports two common hardware debugging interfaces: JTAG (Joint Test Action Group) and SWD (Serial Wire Debug).
- **JTAG Interface:** A parallel debugging interface that communicates using four signal lines (TCK, TMS, TDI, TDO). The JTAG interface is typically used for larger chips and offers more comprehensive debugging capabilities.
- **SWD Interface:** A serial debugging interface that communicates using only two signal lines (SWDIO, SWCLK). The SWD interface is generally used for smaller chips and offers the advantages of low cost and low power consumption.
#### ***
***mon debuggers include:
- **Emulator:** Provides the most comprehensive debugging capabilities, allowing real-time code execution and inspection of registers and memory.
- **Simulator:** Offers similar functionality to an emulator but at a lower cost.
- **JTAG/SWD Adapter:** Supports basic debugging features, such as setting breakpoints and step-by-step debugging.
The connection of the debugger to the target board depends on the debugging interface.
- **JTAG Interface:** Connect the debugger to the target board's JTAG interface using a JTAG connection cable.
- **SWD Interface:** Connect the debugger to the target board's SWD interface using an SWD connection cable.
### 3.2 Common Hardware Issues Troubleshooting

 百万级
高质量VIP文章无限畅学
百万级
高质量VIP文章无限畅学
 千万级
优质资源任意下载
千万级
优质资源任意下载
 C知道
免费提问 ( 生成式Al产品 )
C知道
免费提问 ( 生成式Al产品 )
0
0
相关推荐

专栏目录
最低0.47元/天 解锁专栏
买1年送3月
百万级
高质量VIP文章无限畅学
千万级
优质资源任意下载
C知道
免费提问 ( 生成式Al产品 )
最新推荐
专家指南:Origin图表高级坐标轴编辑技巧及实战应用
# 摘要
Origin是一款强大的科学绘图和数据分析软件,广泛应用于科学研究和工程领域。本文首先回顾了Origin图表的基础知识,然后深入探讨了高级坐标轴编辑技巧,包括坐标轴类型选择、刻度与标签调整、标题与单位设置以及复杂数据处理。接着,通过实战应用案例,展
【MATLAB 3D绘图专家教程】:meshc与meshz深度剖析与应用案例
# 摘要
本文系统介绍了MATLAB中用于3D数据可视化的meshc与meshz函数。首先,本文概述了这两
【必看】域控制器重命名前的系统检查清单及之后的测试验证
# 摘要
本文详细阐述了域控制器重命名的操作流程及其在维护网络系统稳定性中的重要性。在开始重命名前,本文强调了进行域控制器状态评估、制定备份策略和准备用户及应用程序的必要性。接着,介绍了具体的重命名步骤,包括系统检查、执行重命名操作以及监控整个过程。在重命名完成后,文章着重于如何通过功能性测试
HiLink SDK高级特性详解:提升设备兼容性的秘籍

# 摘要
本文对HiLink SDK进行全面介绍,阐述其架构、组件、功能以及设备接入流程和认证机制。深入探讨了HiLink SDK的网络协议与数据通信机制,以及如何提升设备的兼容性和优化性能。通过兼容性问题诊断和改进策略,提出具体的设备适配与性能优化技术。文章还通过具体案例分析了HiL
【ABAQUS与ANSYS终极对决】:如何根据项目需求选择最合适的仿真工具
# 摘要
本文系统地分析了仿真工具在现代工程分析中的重要性,并对比了两大主流仿真软件ABAQUS与ANSYS的基础理论框架及其在不同工程领域的应用。通过深入探讨各自的优势与特点,本文旨在为工程技术人员提供关于软件功能、操作体验、仿真精度和结果验证的全面视角。文章还对软件的成本效益、技术支持与培训资源进行了综合评估,并分享了用户成功案例。最后,展望了仿真技术的未来发展
【备份策略】:构建高效备份体系的关键步骤
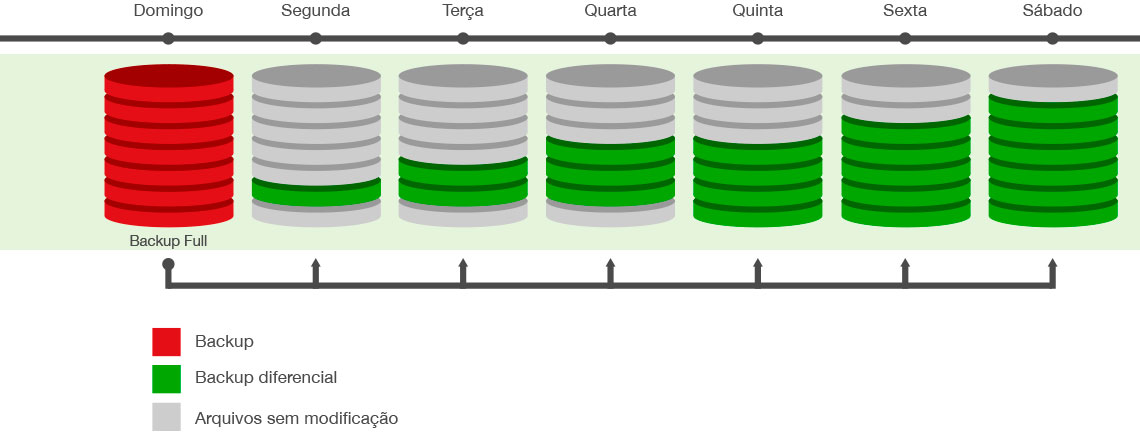
# 摘要
备份策略是确保数据安全和业务连续性的核心组成部分。本文从理论基础出发,详细讨论了备份策略的设计、规划与执行,并对备份工具的选择和备份环境的搭建进行了分析。文章探讨了不同
【脚本自动化教程】:Xshell批量管理Vmware虚拟机的终极武器
# 摘要
本文全面概述了Xshell与Vmware脚本自动化技术,从基础知识到高级技巧再到实践应用,详细介绍了如何使用Xshell脚本与Vmware命令行工具实现高效的虚拟机管理。章节涵盖Xshell脚本基础语法、Vmware命令行工具的使用、自动化脚本的高级技巧、以及脚本在实际环境中的应用案例分析。通过深入探讨条件控制、函数模块化编程、错误处理与日
【增量式PID控制算法的高级应用】:在温度控制与伺服电机中的实践

# 摘要
增量式PID控制算法作为一种改进型的PID控制方法,在控制系统中具有广泛应用前景。本文首先概述了增量式PID控制算法的基本概念、理论基础以及与传统PID控制的比较,进而深入探讨了其在温度控制系统和伺服电机控制系统的具体应用和性能评估。随后,文章介绍了增量式PID控制算法的高级优化技术
【高级应用】MATLAB在雷达测角技术中的创新策略

# 摘要
MATLAB作为一种强大的工程计算软件,其在雷达测角技术领域具有广泛的应用。本文系统地探讨了MATLAB在雷达信号处理、测角方法、系统仿真以及创新应用中的具体实现和相关技术。通过分析雷达信号的采集、预处理、频谱分析以及目标检测算法,揭示了MATLAB在提升信号处理效率和准确性方面的关键作用。进一步,本文探讨了MATLAB在雷达测角建模、算法实现与性能评估中的应用,并提供了基于机器
资源上传下载、课程学习等过程中有任何疑问或建议,欢迎提出宝贵意见哦~我们会及时处理!
点击此处反馈


专栏目录
最低0.47元/天 解锁专栏
买1年送3月
百万级
高质量VIP文章无限畅学
千万级
优质资源任意下载
C知道
免费提问 ( 生成式Al产品 )