Visualizing Model Performance: Plotting ROC Curves and AUC Values
发布时间: 2024-09-15 14:04:34 阅读量: 45 订阅数: 41 

visualizing-git:可视化常见的Git操作如何影响提交图
# Visualizing Model Performance: Plotting ROC Curves and Calculating AUC Values
## 1. The Importance of Model Performance Evaluation
In the process of building machine learning models, evaluating model performance is an indispensable step. Proper performance evaluation helps us understand the model's generalization capability for new data, determine whether the model is overfitting or underfitting, and ultimately choose the most appropriate model. Especially in classification problems, accurately measuring a model's predictive power has become a challenge that data scientists and machine learning engineers must face.
The choice of performance evaluation metrics is crucial for the results of model evaluation. We usually use accuracy, precision, recall, F1 score, and other metrics to evaluate a classification model. These metrics can reflect the performance of the model from different angles, but in some cases, a single metric cannot comprehensively reflect the predictive performance of the model, especially when the class distribution in the dataset is uneven, which limits the application of single metrics. Therefore, ROC curves and AUC values, as comprehensive indicators for measuring the performance of binary classification models, are widely used because they can provide a more comprehensive evaluation perspective.
In this chapter, we will delve into the importance of model performance evaluation, explain why ROC curves and AUC values become indispensable tools in different situations, and their advantages and limitations in different application scenarios. Through in-depth analysis, readers will gain a more comprehensive understanding of model performance evaluation and be able to choose appropriate evaluation methods for different problems.
## 2. The Basic Theory of ROC Curves and AUC Values
ROC curves and AUC values are common tools for evaluating the performance of classification models, especially in binary classification problems with imbalanced datasets. To deeply understand these two concepts, this chapter will start from the basic theory, explain the principles of drawing ROC curves, the statistical significance of AUC values, and their applications in model performance evaluation.
### 2.1 Performance Evaluation Metrics for Binary Classification Problems
In classification problems, the main task of the model is to correctly classify the samples in the dataset into two categories. For binary classification problems, we usually focus on the following performance evaluation metrics.
#### 2.1.1 True Positive Rate and False Positive Rate
The True Positive Rate (TPR) and False Positive Rate (FPR) are basic performance evaluation metrics. They are defined as follows:
- True Positive Rate (TPR): The proportion of correctly predicted positive samples in all positive class samples.
- False Positive Rate (FPR): The proportion of incorrectly predicted positive samples in all negative class samples.
True Positive Rate and False Positive Rate can directly reflect the model's performance in distinguishing between positive and negative classes. The values of these two indicators range from 0 to 1, and the closer to 1, the better the model performs in the corresponding aspect.
#### 2.1.2 Definition and Drawing Principles of ROC Curves
The ROC curve is drawn on the coordinate system of TPR and FPR according to different classification thresholds. Each point represents the TPR and FPR values under a possible classification threshold setting. The specific drawing steps are as follows:
1. Calculate TPR and FPR for each classification threshold;
2. Use FPR as the horizontal coordinate and TPR as the vertical coordinate to plot the corresponding points;
3. Connect these points to form the ROC curve.
The closer the ROC curve is to the upper left corner of the coordinate axis, the better the model performance. The ideal model's ROC curve will present as an abruptly ascending broken line, passing through the point (0, 1).
### 2.2 The Meaning and Calculation Method of AUC Values
The AUC value (Area Under the Curve) is the area under the ROC curve, and its value can measure the average performance of the model under all classification thresholds.
#### 2.2.1 Definition and Statistical Significance of AUC Values
The AUC value represents the probability that a model will rank a positive sample higher than a negative sample when randomly selecting a positive sample and a negative sample. The range of AUC values is [0.5, 1]. When the AUC value is 0.5, it indicates that the model is guessing randomly; when the AUC value is 1, it indicates that the model is perfectly classified.
#### 2.2.2 The Calculation Process of AUC Values
There are various methods to calculate AUC values, such as the trapezoidal rule and interpolation methods. This chapter will introduce the process of calculating AUC values using the trapezoidal rule:
1. Divide the area under the ROC curve into several trapezoids;
2. Calculate the area of each trapezoid and sum them up;
3. The sum of the accumulated areas is the AUC value.
Specifically, in mathematical formula representation, if we take TPR and FPR as the two sides, the area under the ROC curve can be seen as composed of these trapezoids, and then the area of each trapezoid is accumulated to obtain the AUC value.
## 2.3 The Advantages and Disadvantages of ROC Curves and AUC Values
As evaluation metrics, ROC curves and AUC values have a wide range of applications, but they also have some limitations.
### 2.3.1 Comparison with Other Evaluation Metrics
Compared to other evaluation metrics such as accuracy, ROC curves and AUC values perform more stably in imbalanced datasets and can more comprehensively reflect model performance. However, compared to precision and recall, ROC and AUC may not be the ideal choice in certain specific application scenarios, such as situations that require high recall rates.
### 2.3.2 Limitations of ROC Curves and AUC Values
Although ROC curves and AUC values are powerful tools, they still face limitations:
- For multi-class classification problems, ROC curves and AUC values are not directly applicable;
- In some datasets, especially when the sample size is very small, the curve and AUC values may not be stable enough;
- In some cases, the model's predictions may overly rely on data from a particular category.
Understanding these advantages and disadvantages helps us use ROC curves and AUC values more reasonably for model performance evaluation.
In the following chapters, we will delve into how to use Python tools to plot ROC curves and calculate AUC values, and we will also explore the application of these two indicators in different types of problems and imbalanced datasets. This chapter is only the theoretical part, providing a solid theoretical foundation for in-depth application.
# 3. Using Python to Plot ROC Curves and Calculate AUC Values
## 3.1 From Theory to Practice: Preparing Data and Models
### 3.1.1 Data Preprocessing
Before model training, data preprocessing is crucial. Data preprocessing may include data cleaning, missing value handling, data standard

 百万级
高质量VIP文章无限畅学
百万级
高质量VIP文章无限畅学
 千万级
优质资源任意下载
千万级
优质资源任意下载
 C知道
免费提问 ( 生成式Al产品 )
C知道
免费提问 ( 生成式Al产品 )
0
0
相关推荐

专栏目录
最低0.47元/天 解锁专栏
买1年送3月
百万级
高质量VIP文章无限畅学
千万级
优质资源任意下载
C知道
免费提问 ( 生成式Al产品 )
最新推荐
JY01A直流无刷IC全攻略:深入理解与高效应用
# 摘要
本文详细介绍了JY01A直流无刷IC的设计、功能和应用。文章首先概述了直流无刷电机的工作原理及其关键参数,随后探讨了JY01A IC的功能特点以及与电机集成的应用。在实践操作方面,本文讲解了JY01A IC的硬件连接、编程控制,并通过具体
数据备份与恢复:中控BS架构考勤系统的策略与实施指南

# 摘要
在数字化时代,数据备份与恢复已成为保障企业信息系统稳定运行的重要组成部分。本文从理论基础和实践操作两个方面对中控BS架构考勤系统的数据备份与恢复进行深入探讨。文中首先阐述了数据备份的必要性及其对业务连续性的影响,进而详细介绍了不同备份类型的选择和备份周期的制定。随后,文章深入解析了数据恢复的原理与流程,并通过具体案例分析展示了恢复技术的实际应用。接着,本文探讨
【TongWeb7负载均衡秘笈】:确保请求高效分发的策略与实施
.webp)
# 摘要
本文从基础概念出发,对负载均衡进行了全面的分析和阐述。首先介绍了负载均衡的基本原理,然后详细探讨了不同的负载均衡策略及其算法,包括轮询、加权轮询、最少连接、加权最少连接、响应时间和动态调度算法。接着,文章着重解析了TongWeb7负载均衡技术的架构、安装配置、高级特性和应用案例。在实施案例部分,分析了高并发Web服务和云服务环境下负载
【Delphi性能调优】:加速进度条响应速度的10项策略分析

# 摘要
本论文首先概述了信号定位技术的基本概念和重要性,随后深入分析了三角测量和指纹定位两种主要技术的工作原理、实际应用以及各自的优势与不足。通过对三角测量定位模型的解析,我们了解到其理论基础、精度影响因素以及算法优化策略。指纹定位技术部分,则侧重于其理论框架、实际操作方法和应用场
【PID调试实战】:现场调校专家教你如何做到精准控制
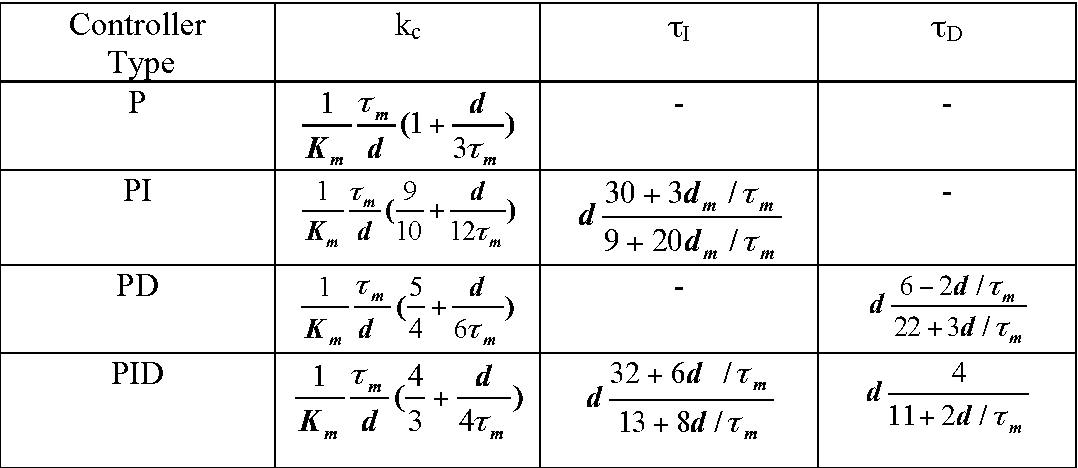
# 摘要
PID控制作为一种历史悠久的控制理论,一直广泛应用于工业自动化领域中。本文从基础理论讲起,详细分析了PID参数的理论分析与选择、调试实践技巧,并探讨了PID控制在多变量、模糊逻辑以及网络化和智能化方面的高级应用。通过案例分析,文章展示了PID控制在实际工业环境中的应用效果以及特殊环境下参数调整的策略。文章最后展望了PID控制技术的发展方
网络同步新境界:掌握G.7044标准中的ODU flex同步技术
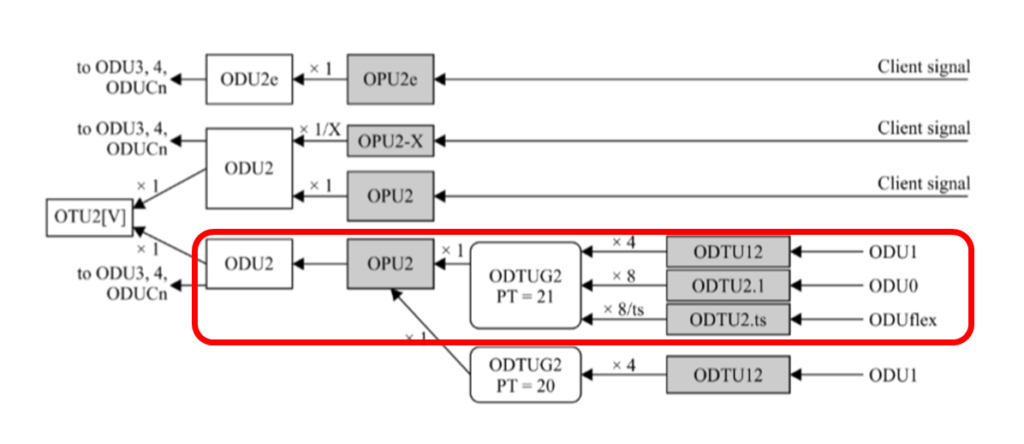
# 摘要
本文详细探讨了G.7044标准与ODU flex同步技术,首先介绍了该标准的技术原理,包括时钟同步的基础知识、G.7044标准框架及其起源与应用背景,以及ODU flex技术
字符串插入操作实战:insert函数的编写与优化
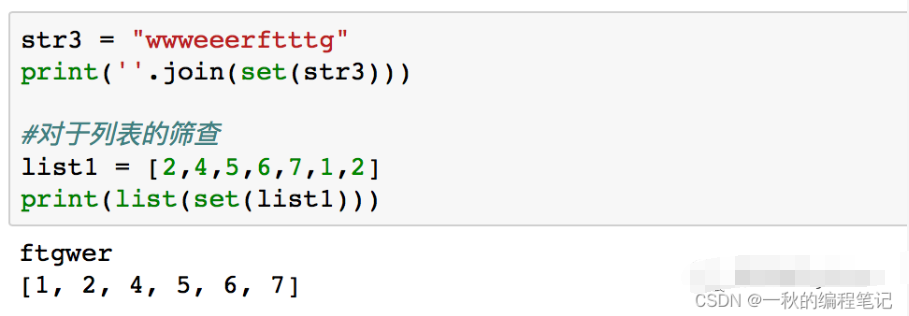
# 摘要
字符串插入操作是编程中常见且基础的任务,其效率直接影响程序的性能和可维护性。本文系统地探讨了字符串插入操作的理论基础、insert函数的编写原理、使用实践以及性能优化。首先,概述了insert函数的基本结构、关键算法和代码实现。接着,分析了在不同编程语言中insert函数的应用实践,并通过性能测试揭示了各种实现的差异。此外,本文还探讨了性能优化策略,包括内存使用和CPU效率提升,并介绍了高级数据结
环形菜单的兼容性处理

# 摘要
环形菜单作为一种用户界面元素,为软件和网页设计提供了新的交互体验。本文首先介绍了环形菜单的基本知识和设计理念,重点探讨了其通过HTML、CSS和JavaScript技术实现的方法和原理。然后,针对浏览器兼容性问题,提出了有效的解决方案,并讨论了如何通过测试和优化提升环形菜单的性能和用户体验。本
资源上传下载、课程学习等过程中有任何疑问或建议,欢迎提出宝贵意见哦~我们会及时处理!
点击此处反馈


专栏目录
最低0.47元/天 解锁专栏
买1年送3月
百万级
高质量VIP文章无限畅学
千万级
优质资源任意下载
C知道
免费提问 ( 生成式Al产品 )