Evaluation Strategies for Imbalanced Datasets: Addressing Data Asymmetry Issues
发布时间: 2024-09-15 14:11:05 阅读量: 7 订阅数: 14 
# Evaluation Strategies for Imbalanced Datasets: Addressing Data Asymmetry
## 1. Fundamental Concepts of Imbalanced Datasets
Within the realms of machine learning and data analysis, an imbalanced dataset refers to a phenomenon where there is a significant discrepancy in the number of samples across different classes in a classification problem. Typically, if the number of samples in one class vastly outnumbers the others, it leads to a bias in the learning algorithm during training, favoring the class with more samples. For example, in spam detection, the number of non-spam emails might greatly exceed that of spam emails, causing the algorithm to be overly sensitive to non-spam emails. Imbalanced datasets are a common and critical issue in data mining and pattern recognition, and the way they are handled is crucial for establishing fair and accurate models. This chapter will delve into the basic concepts and characteristics of imbalanced datasets, laying the groundwork for subsequent chapters.
## 2. Impact Analysis of Imbalanced Datasets
In the previous chapter, we introduced the basic concepts of imbalanced datasets and understood their prevalence and importance within the field of machine learning. This chapter will delve into the effects of imbalanced datasets on classification problems, analyze changes in model performance, and introduce key concepts and cases to provide readers with a more comprehensive understanding of the issue at hand.
### 2.1 Imbalance Phenomenon in Classification Problems
#### 2.1.1 Limitations of Classification Accuracy
When facing an imbalanced dataset, traditional classification accuracy metrics become misleading. Suppose we have a spam identification problem where the ratio of spam to non-spam emails is 9:1. If a simple model always predicts all emails as non-spam, its accuracy in the test set would reach 90%. However, this model provides no practical value as it fails to identify any spam emails. Therefore, when discussing imbalanced datasets, we must recognize that simply pursuing high accuracy is insufficient.
Accuracy, though intuitive, is easily influenced by skewed sample distributions. For instance, in a binary classification problem, if one class of samples greatly outnumbers the other, even a model that only predicts the majority class might show good accuracy. This obviously does not meet practical demands, and thus, more nuanced evaluation methods are needed to measure model performance.
#### 2.1.2 Common Cases of Imbalance Issues
In real-world applications, cases of imbalanced datasets are plentiful. Examples include:
- **Credit Card Fraud Detection**: Fraudulent transactions are typically much fewer than non-fraudulent ones. If the model cannot accurately identify fraudulent transactions, it might result in substantial losses for banks.
- **Disease Diagnosis**: Rare diseases appear much less frequently in datasets compared to common ones. If a model cannot effectively identify rare diseases, it might affect patients' health and treatment.
- **Network Intrusion Detection**: In the field of cybersecurity, malicious activities are much fewer than normal ones, and the cost of detection errors is very high.
In these scenarios, data imbalance can lead to machine learning models performing much worse than expected in practical applications. Thus, identifying and addressing data imbalance is key to constructing effective models.
### 2.2 Effects of Imbalanced Datasets on Model Performance
#### 2.2.1 Model Generalization Ability
Imbalanced datasets may cause models to develop biases, thereby affecting their generalization ability. When a model performs well on training data but poorly on unknown data, it is known as overfitting. This often occurs when the model learns too well for the majority class, ignoring the minority class. For instance, in medical image recognition, if the model predominantly classifies images as normal, it might not be able to effectively identify diseases in the real world.
To improve model generalization ability, strategies must be employed to balance the influence of different classes during the model training process. This can be achieved by altering the dataset composition (e.g., using over-sampling or under-sampling techniques) or by designing specific algorithms (such as cost-sensitive learning or ensemble learning).
#### 2.2.2 Bias in Evaluation Metric Selection
Choosing evaluation metrics in imbalanced datasets is crucial. High accuracy does not always indicate good model performance, thus requiring more refined and balanced metrics to evaluate the model. For example, in imbalanced datasets, a model might predict the majority class very well but ignore the minority class. This would lead to biases in metrics such as precision and recall, necessitating the consideration of other metrics that can comprehensively evaluate model performance.
In the next chapter, we will delve into how to choose appropriate evaluation metrics for imbalanced datasets and discuss why these metrics are more effective than traditional accuracy.
In the following section, we will illustrate through specific cases of imbalanced datasets how they affect real-world applications and use visualization tools and code examples to explain this phenomenon.
## 3. Evaluation Metrics for Imbalanced Datasets
### 3.1 Limitations of Traditional Evaluation Metrics
#### 3.1.1 Accuracy, Precision, Recall, and F1 Score
In the context of imbalanced datasets, traditional classification performance evaluation metrics such as accuracy, precision, recall, and F1 score have significant limitations. Although these metrics provide effective performance evaluations in balanced datasets, they might lead to misleading conclusions in imbalanced ones.
- **Accuracy** measures the proportion of correctly predicted samples out of the total sample number. However, in scenarios where classes are extremely imbalanced, for instance, if one class constitutes 99% and the other only 1%, a model predicting all samples as belonging to the majority class would still achieve 99% accuracy, yet it clearly has no predictive power for the minority class.
- **Precision** focuses on the probability of a model correctly identifying the positive class (positive samples), whereas **recall** concerns the proportion of correctly identified positive classes within all positive classes. These two metrics collectively form the key indicators for balancing a model's predictive ability for positive and negative classes. However, in imbalanced datasets, they might be dominated by the predictions for the majority class, thereby neglecting the recognition ability for the minority class.
- **F1 Score** is the harmonic mean of precision and recall, attempting to balance their effects. The F1 score provides a more reliable performance estimate than accuracy in data imbalances, but since it still depends on precision and recall, it is also influenced by imbalanced datasets.
#### 3.1.2 Interpretation of ROC Curve and AUC Value
The **Receiver Operating Characteristic Curve (ROC Curve)** and its **Area Under Curve (AUC)** are common tools for evaluating the performance of binary classification models. The ROC curve provides an overview of model performance under various discrimination conditions by plotting the True Positive Rate (TPR) against the False Positive Rate (FPR) at different thresholds.
- **True Positive Rate (TPR)** is the same as recall, and **False Positive Rate (FPR)** indicates the proportion of negative classes incorrectly identified as positive classes. An ideal classification model would trend toward the top-left corner of the ROC curve, indicating high TPR and low FPR.
- The **AUC value** is the area enclosed by the curve and the x and y axes within the ROC space. The closer the AUC value is to 1, the better the model's performance. The AUC value is often misunderstood as the model's average accuracy across all possible class ratios, but this interp

 百万级
高质量VIP文章无限畅学
百万级
高质量VIP文章无限畅学
 千万级
优质资源任意下载
千万级
优质资源任意下载
 C知道
免费提问 ( 生成式Al产品 )
C知道
免费提问 ( 生成式Al产品 )
0
0
相关推荐

专栏目录
最低0.47元/天 解锁专栏
送3个月
百万级
高质量VIP文章无限畅学
千万级
优质资源任意下载
C知道
免费提问 ( 生成式Al产品 )
最新推荐
【持久化存储】:将内存中的Python字典保存到磁盘的技巧

# 1. 内存与磁盘存储的基本概念
在深入探讨如何使用Python进行数据持久化之前,我们必须先了解内存和磁盘存储的基本概念。计算机系统中的内存指的
Python并发控制:在多线程环境中避免竞态条件的策略

# 1. Python并发控制的理论基础
在现代软件开发中,处理并发任务已成为设计高效应用程序的关键因素。Python语言因其简洁易读的语法和强大的库支持,在并发编程领域也表现出色。本章节将为读者介绍并发控制的理论基础,为深入理解和应用Python中的并发工具打下坚实的基础。
## 1.1 并发与并行的概念区分
首先,理解并发和并行之间的区别至关重要。并发(Concurre
【Python调试技巧】:使用字符串进行有效的调试
# 1. Python字符串与调试的关系
在开发过程中,Python字符串不仅是数据和信息展示的基本方式,还与代码调试紧密相关。调试通常需要从程序运行中提取有用信息,而字符串是这些信息的主要载体。良好的字符串使用习惯能够帮助开发者快速定位问题所在,优化日志记录,并在异常处理时提供清晰的反馈。这一章将探讨Python字符串与调试之间的关系,并展示如何有效地利用字符串进行代码调试。
# 2. P
Python测试驱动开发(TDD)实战指南:编写健壮代码的艺术
# 1. 测试驱动开发(TDD)简介
测试驱动开发(TDD)是一种软件开发实践,它指导开发人员首先编写失败的测试用例,然后编写代码使其通过,最后进行重构以提高代码质量。TDD的核心是反复进行非常短的开发周期,称为“红绿重构”循环。在这一过程中,"红"代表测试失败,"绿"代表测试通过,而"重构"则是在测试通过后,提升代码质量和设计的阶段。TDD能有效确保软件质量,促进设计的清晰度,以及提高开发效率。尽管它增加了开发初期的工作量,但长远来
【Python排序与异常处理】:优雅地处理排序过程中的各种异常情况
# 1. Python排序算法概述
排序算法是计算机科学中的基础概念之一,无论是在学习还是在实际工作中,都是不可或缺的技能。Python作为一门广泛使用的编程语言,内置了多种排序机制,这些机制在不同的应用场景中发挥着关键作用。本章将为读者提供一个Python排序算法的概览,包括Python内置排序函数的基本使用、排序算法的复杂度分析,以及高级排序技术的探
Python索引的局限性:当索引不再提高效率时的应对策略

# 1. Python索引的基础知识
在编程世界中,索引是一个至关重要的概念,特别是在处理数组、列表或任何可索引数据结构时。Python中的索引也不例外,它允许我们访问序列中的单个元素、切片、子序列以及其他数据项。理解索引的基础知识,对于编写高效的Python代码至关重要。
## 理解索引的概念
Python中的索引从0开始计数。这意味着列表中的第一个元素
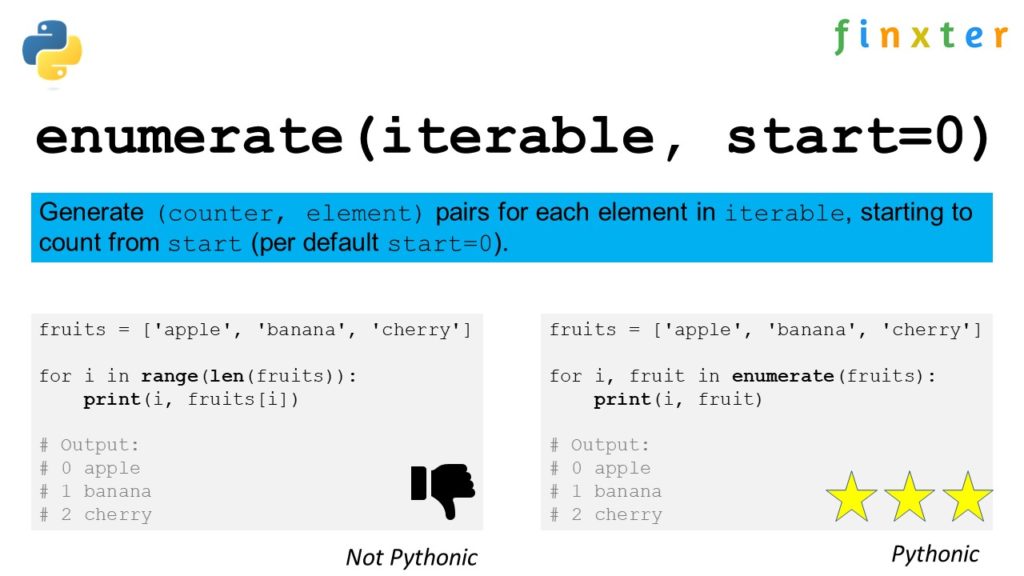
Python列表的函数式编程之旅:map和filter让代码更优雅
# 1. 函数式编程简介与Python列表基础
## 1.1 函数式编程概述
函数式编程(Functional Programming,FP)是一种编程范式,其主要思想是使用纯函数来构建软件。纯函数是指在相同的输入下总是返回相同输出的函数,并且没有引起任何可观察的副作用。与命令式编程(如C/C++和Java)不同,函数式编程
Python字符串编码解码:Unicode到UTF-8的转换规则全解析
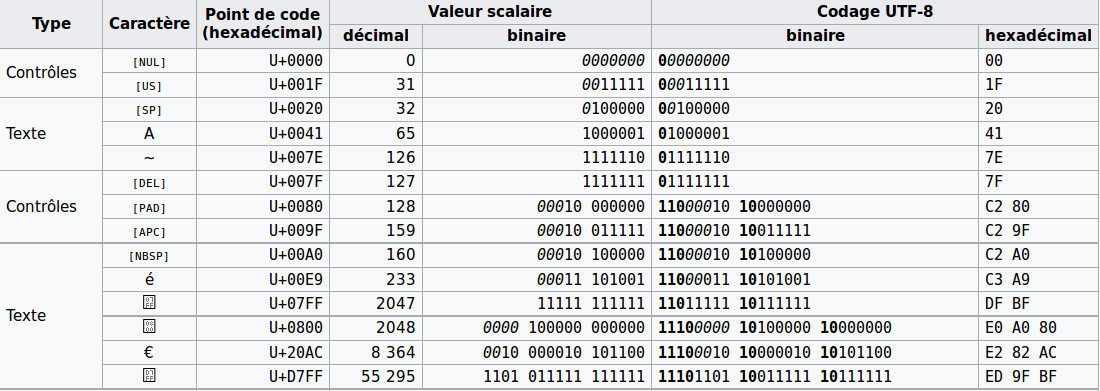
# 1. 字符串编码基础与历史回顾
## 1.1 早期字符编码的挑战
在计算机发展的初期阶段,字符编码并不统一,这造成了很多兼容性问题。由于不同的计算机制造商使用各自的编码表,导致了数据交换的困难。例如,早期的ASCII编码只包含128个字符,这对于表示各种语言文字是远远不够的。
## 1.2 字符编码的演进
随着全球化的推进,需要一个统一的字符集来支持
Python在语音识别中的应用:构建能听懂人类的AI系统的终极指南

# 1. 语音识别与Python概述
在当今飞速发展的信息技术时代,语音识别技术的应用范围越来越广,它已经成为人工智能领域里一个重要的研究方向。Python作为一门广泛应用于数据科学和机器学习的编程语言,因其简洁的语法和强大的库支持,在语音识别系统开发中扮演了重要角色。本章将对语音识别的概念进行简要介绍,并探讨Python在语音识别中的应用和优势。
语音识别技术本质上是计算机系统通过算法将人类的语音信号转换
【掌握Python核心】:字符串转换为列表的切片和类型转换技巧
# 1. 字符串转换为列表的基本概念
在编程的世界里,数据的类型和结构决定了我们可以执行的操作以及如何有效地处理这些数据。字符串和列表是数据处理中常见的两种基本结构。字符串是由字符组成的序列,而列表是一种有序的集合。在实际应用中,我们往往需要将字符串转换为列表,以实现更灵活的数据操作和处理。了解字符串到列表的转换不仅有助于我们更好地掌握数据结构的操作,还能提高我们处
资源上传下载、课程学习等过程中有任何疑问或建议,欢迎提出宝贵意见哦~我们会及时处理!
点击此处反馈


专栏目录
最低0.47元/天 解锁专栏
送3个月
百万级
高质量VIP文章无限畅学
千万级
优质资源任意下载
C知道
免费提问 ( 生成式Al产品 )