From Evaluation Metrics to Model Optimization: How to Select the Optimal Threshold
发布时间: 2024-09-15 14:17:59 阅读量: 51 订阅数: 41 

Evaluation of local community metrics: from an experimental perspective
# From Evaluation Metrics to Model Optimization: How to Choose the Best Threshold
## 1. The Importance of Evaluation Metrics and Threshold Selection
In machine learning and data analysis, evaluation metrics and threshold selection are crucial for ensuring the accuracy and reliability of models. Evaluation metrics quantify model performance, while the correct threshold selection determines how the model performs in real-world applications. This chapter will delve into why evaluation metrics and threshold selection are core to model building, and illustrate how they can be used to optimize model outputs to meet various business requirements.
### 1.1 Definition and Role of Evaluation Metrics
Evaluation metrics are standards for measuring model performance, helping us understand how well a model performs in prediction, classification, or regression tasks. For instance, in classification tasks, metrics such as Precision and Recall can reflect a model's ability to recognize specific categories. Choosing the right evaluation metrics ensures the model's effectiveness and efficiency in practice.
```python
from sklearn.metrics import precision_score, recall_score
# Sample code: Calculate precision and recall for a classification model
precision = precision_score(y_true, y_pred, pos_label='positive')
recall = recall_score(y_true, y_pred, pos_label='positive')
```
### 1.2 The Importance of Threshold Selection
Threshold selection involves converting a model's continuous outputs into specific category decisions. In binary classification problems, choosing an appropriate threshold can balance the ratio of false positives (FPs) and false negatives (FNs), thereby maximizing overall performance. Different application scenarios may focus on different performance indicators, so setting the threshold is crucial.
```python
# Sample code: Make decisions using different thresholds
threshold = 0.5
predictions = [1 if probability > threshold else 0 for probability in probabilities]
```
In the following chapters, we will delve deeper into the theoretical basis of threshold selection and how to apply these theoretical insights in model optimization practice. By understanding the importance of evaluation metrics and threshold selection, we will be better equipped to build and adjust models to suit complex problem domains.
## 2. The Theoretical Foundation of Threshold Selection
### 2.1 Probability Theory and Decision Thresholds
#### 2.1.1 Probability Theory Basics and Its Application in Threshold Selection
Probability theory is a branch of mathematics that studies the probability of random events. In machine learning and data science, probability theory not only helps us understand and model uncertainty and randomness but also plays a crucial role in threshold selection. Thresholds are part of decision rules used to classify predictive outcomes as positive or negative classes. In probability models, each data point is assigned a probability value indicating its likelihood of belonging to the positive class. Threshold selection converts this probability into a hard decision.
For example, in a binary classification problem, a model might predict that a sample has a 0.7 probability of belonging to the positive class. If we set the threshold at 0.5, then the sample will be classified as positive. The choice of threshold directly affects the model's precision and recall, hence requiring careful consideration. In practice, by plotting ROC curves and calculating AUC values, we can better understand performance at different thresholds and make optimal choices accordingly.
Applications of probability theory in threshold selection include but are not limited to:
- **Probability estimation**: Estimating the probability of a sample belonging to a specific category.
- **Decision rules**: Making decisions based on a comparison of probability values with predetermined thresholds.
- **Performance evaluation**: Using probability outputs to calculate performance metrics such as precision, recall, and F1-score.
- **Probability threshold adjustment**: Adjusting the probability threshold based on performance metric feedback to optimize model decision-making.
#### 2.1.2 An Introduction to Decision Theory
Decision theory provides a framework for making choices and decisions under uncertainty. It involves not only probability theory but also principles from economics, psychology, and statistics. In machine learning, decision theory is used to optimize model predictive performance and decision-making processes.
In the context of threshold selection, decision theory helps us:
- **Define loss functions**: Loss functions measure the error or loss of model predictions. Choosing a threshold involves balancing different types of errors, usually with the aim of minimizing expected loss.
- **Risk minimization**: Based on loss functions, decision theory can guide us in selecting a threshold that minimizes expected risk.
- **Bayesian decision-making**: Using prior knowledge and sample data, Bayesian decision rules minimize loss or risk by calculating posterior probabilities.
- **Multi-threshold problems**: In multi-threshold decision-making problems, decision theory helps balance the misclassification costs of different categories.
Using decision theory to select thresholds allows us not only to make decisions based on empirical rules or single indicators but also on a more systematic and comprehensive analysis. By establishing mathematical models to quantify the consequences of different decisions, we can select the optimal threshold.
### 2.2 Detailed Explanation of Evaluation Metrics
#### 2.2.1 Precision, Recall, and F1 Score
Precision, Recall, and F1 Score are the most commonly used performance evaluation metrics for classification problems. They are tools for measuring model performance from different angles and are often used when choosing thresholds.
- **Precision** measures the proportion of actual positive samples among those predicted as positive by the model.
Precision = Number of correctly predicted positive samples / Number of samples predicted as positive
- **Recall** measures the proportion of actual positive samples that the model can correctly predict as positive.
Recall = Number of correctly predicted positive samples / Number of actual positive samples
- **F1 Score** is the harmonic mean of precision and recall, providing a single score for these two indicators. The F1 Score is particularly useful when both precision and recall are important.
F1 Score = 2 * (Precision * Recall) / (Precision + Recall)
When selecting thresholds, a balance needs to be found among these three indicators. High precision means a low false positive rate, while high recall means a low false negative rate. In different application scenarios, the emphasis on precision and recall may vary. For example, in medical diagnosis, recall may be more important than precision because missing a diagnosis (false negative) may be more harmful than a misdiagnosis (false positive).
#### 2.2.2 ROC Curve and AUC Value
The ROC curve (Receiver Operating Characteristic Curve) is a tool for displaying the performance of a classification model, regardless of the class distribution. It graphically shows the True Positive Rate (TPR) and False Positive Rate (FPR) at different thresholds as the threshold changes.
- **True Positive Rate** is equivalent to Recall or Sensitivity.
TPR = Recall = TP / (TP + FN)
- **False Positive Rate** indicates the proportion of negative samples incorrectly classified as positive.
FPR = FP / (FP + TN)
The area under the ROC curve (Area Under the Curve, AUC) is a measure of the model's overall performance, ranging from 0 to 1. An AUC of 0.5 indicates a completely random classifier, while an AUC of 1 indicates a perfect classifier.
The AUC value is particularly useful for imbalanced datasets because it does not depend directly on the threshold but evaluates the model's performance at all possible thresholds. It is generally believed that an AUC value above 0.7 indicates that the model has good classification ability, while a value above 0.9 suggests that the model performs exceptionally well.
#### 2.2.3 Confusion Matrix and Its Interpretation
A confusion matrix is another method for assessing the performance of classification models. It provides detailed information on how well the predictions of a classification model match the actual labels. The confusion matrix contains the following four main components:
- **True Positives (TP)**: The number of positive samples correctly predicted as positive by the model.
- **False Positives (FP)**: The number of negative samples incorrectly predicted as positive by the model.
- **True Negatives (TN)**: The number of negative samples correctly predicted as negative by the model.
- **False Negatives (FN)**: The number of positive samples incorrectly predicted as negative by the model.
Based on these values, we can calculate precision, recall, F1 score, and the precision and recall for specific categories.
A confusion matrix not only helps us understand the model's performance across different categories but can also reveal potential issues with the model. For example, if the FN value is high, it may indicate that the model tends to predict positive classes as negative, while if the FP value is high, the model may tend to incorrectly predict negative classes as positive.
## 2.3 Strategies for Threshold Selection
### 2.3.1 Static Thresholds and Dynamic Thresholds
Strategies for threshold selection can be divided into static thresholds and dynamic thresholds.
- **Static Thresholds**: Once a static threshold is chosen, the model uses the same threshold in all situations. Static thresholds are easy to implement and understand and are suitable for stable data distributions.
- **Dynamic Thresholds**: Dynamic thresholds depend on the characteristics of the data or the distribution of model prediction probabilities. For example, thresholds determined by statistical methods, such as those based on distribution quantiles, or thresholds adjusted in specific situations, such as changing the threshold according to the characteristics of the sample.
Dynamic threshold strategies can provide more flexible decision boundaries, especially in cases where the data distribution is uneven or the application scenario changes. However, the calculation of dynamic thresholds may be more complex, requiring more data information, and may need to be updated in real-time to adapt to new data distributions.
### 2.3.2 Methodologies for Threshold Optimization
The goal of threshold optimization is to find a threshold that maximizes model performance. Here are some commonly used methodologies for threshold optimization:
- **Performance Indicator-Based Methods**: Choose a balance point based on indicators such as precision, recall, F1 score, and AUC value.
- **Cost Function-Based Methods**: Introduce a cost matrix to quantify different types of errors and then choose a threshold that minimizes expected costs.
- **Cross-Validation**: Use cross-validation methods to assess model performance on multiple different subsets and select the optimal threshold.
- **Bayesian Optimization**: Use Bayesian optimization algorithms to find the optimal threshold, which is particularly effective in high-dimensional spaces and models with a large number of hyperparameters.
In practice, threshold optimization often requires adjustments based on specific problems and available data. The optimization process may include multiple iterations and experiments to find the threshold that best suits business needs and model performance.
## 3. Practical Tips for Model Optimization
Model optimization is one of the key steps to success in machine learning projects. In this chapter, we will delve into the basic methods of model tuning, practical applications of threshold optimization, and case studies of model performance improvement. These contents are of great practical value to IT professionals aspiring to delve deeply into model development.
### 3.1 Basic Methods of Model Tuning
Model tuning is the process of ensuring that machine learning models achieve optimal performance. To achieve this, developers typically use hyperparameter tuning and model evaluation techniques. We will explore two important practices: hy

 百万级
高质量VIP文章无限畅学
百万级
高质量VIP文章无限畅学
 千万级
优质资源任意下载
千万级
优质资源任意下载
 C知道
免费提问 ( 生成式Al产品 )
C知道
免费提问 ( 生成式Al产品 )
0
0
相关推荐

专栏目录
最低0.47元/天 解锁专栏
买1年送3月
百万级
高质量VIP文章无限畅学
千万级
优质资源任意下载
C知道
免费提问 ( 生成式Al产品 )
最新推荐
JY01A直流无刷IC全攻略:深入理解与高效应用
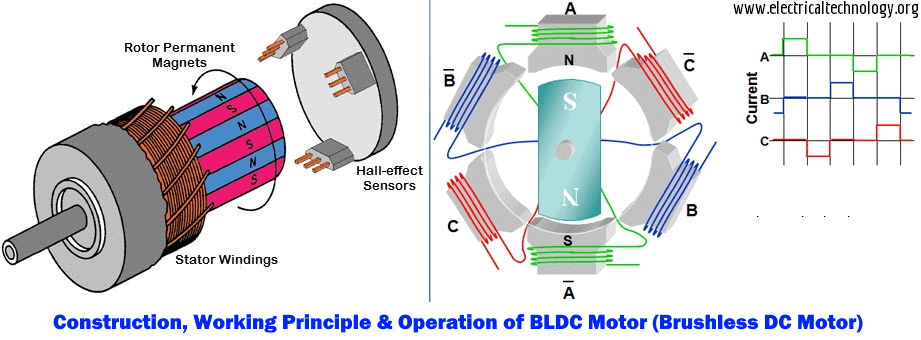
# 摘要
本文详细介绍了JY01A直流无刷IC的设计、功能和应用。文章首先概述了直流无刷电机的工作原理及其关键参数,随后探讨了JY01A IC的功能特点以及与电机集成的应用。在实践操作方面,本文讲解了JY01A IC的硬件连接、编程控制,并通过具体
【S参数转换表准确性】:实验验证与误差分析深度揭秘
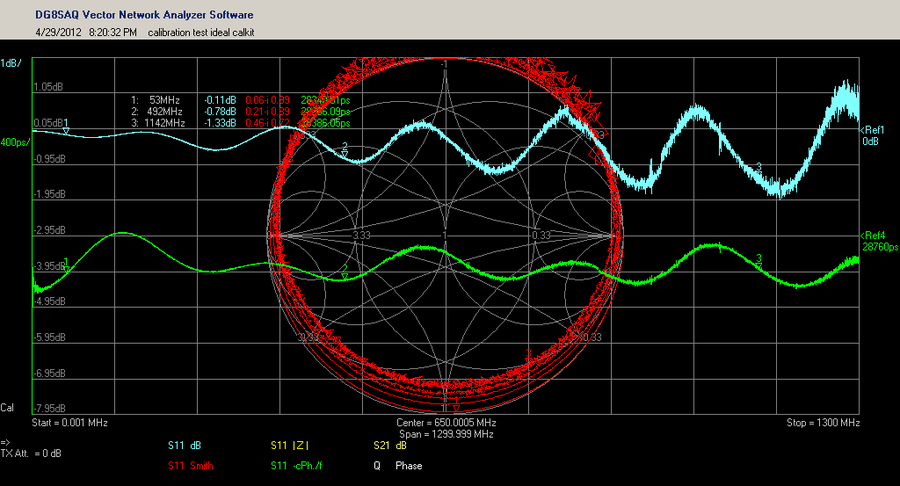
# 摘要
本文详细探讨了S参数转换表的准确性问题,首先介绍了S参数的基本概念及其在射频领域的应用,然后通过实验验证了S参数转换表的准确性,并分析了可能的误差来源,包括系统误差和随机误差。为了减小误差,本文提出了一系列的硬件优化措施和软件算法改进策略。最后,本文展望了S参数测量技术的新进展和未来的研究方向,指出了理论研究和实际应用创新的重要性。
# 关键字
S参
【TongWeb7内存管理教程】:避免内存泄漏与优化技巧
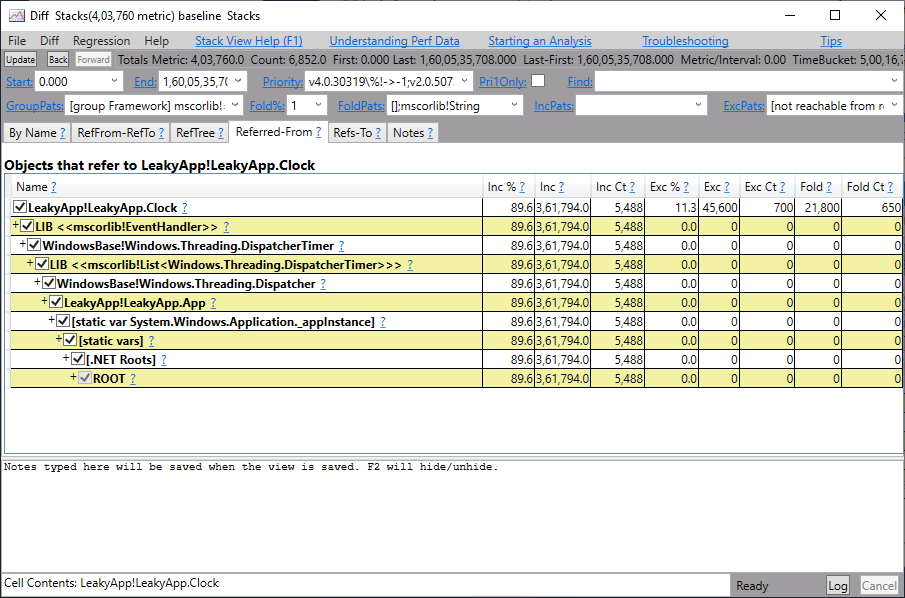
# 摘要
本文旨在深入探讨TongWeb7的内存管理机制,重点关注内存泄漏的理论基础、识别、诊断以及预防措施。通过详细阐述内存池管理、对象生命周期、分配释放策略和内存压缩回收技术,文章为提升内存使用效率和性能优化提供了实用的技术细节。此外,本文还介绍了一些性能优化的基本原则和监控分析工具的应用,以及探讨了企业级内存管理策略、自动内存管理工具和未来内存管理技术的发展趋
无线定位算法优化实战:提升速度与准确率的5大策略
# 摘要
本文综述了无线定位技术的原理、常用算法及其优化策略,并通过实际案例分析展示了定位系统的实施与优化。第一章为无线定位技术概述,介绍了无线定位技术的基础知识。第二章详细探讨了无线定位算法的分类、原理和常用算法,包括距离测量技术和具体定位算法如三角测量法、指纹定位法和卫星定位技术。第三章着重于提升定位准确率、加速定位速度和节省资源消耗的优化策略。第四章通过分析室内导航系统和物联网设备跟踪的实际应用场景,说明了定位系统优化实施
成本效益深度分析:ODU flex-G.7044网络投资回报率优化
# 摘要
本文旨在介绍ODU flex-G.7044网络技术及其成本效益分析。首先,概述了ODU flex-G.7044网络的基础架构和技术特点。随后,深入探讨成本效益理论,包括成本效益分析的基本概念、应用场景和局限性,以及投资回报率的计算与评估。在此基础上,对ODU flex-G.7044网络的成本效益进行了具体分析,考虑了直接成本、间接成本、潜在效益以及长期影响。接着,提出优化投资回报
【Delphi编程智慧】:进度条与异步操作的完美协调之道

# 摘要
本文旨在深入探讨Delphi编程环境中进度条的使用及其与异步操作的结合。首先,基础章节解释了进度条的工作原理和基础应用。随后,深入研究了Delphi中的异步编程机制,包括线程和任务管理、同步与异步操作的原理及异常处理。第三章结合实
C语言编程:构建高效的字符串处理函数
# 摘要
字符串处理是编程中不可或缺的基础技能,尤其在C语言中,正确的字符串管理对程序的稳定性和效率至关重要。本文从基础概念出发,详细介绍了C语言中字符串的定义、存储、常用操作函数以及内存管理的基本知识。在此基础上,进一步探讨了高级字符串处理技术,包括格式化字符串、算法优化和正则表达式的应用。
【抗干扰策略】:这些方法能极大提高PID控制系统的鲁棒性
# 摘要
PID控制系统作为一种广泛应用于工业过程控制的经典反馈控制策略,其理论基础、设计步骤、抗干扰技术和实践应用一直是控制工程领域的研究热点。本文从PID控制器的工作原理出发,系统介绍了比例(P)、积分(I)、微分(D)控制的作用,并探讨了系统建模、控制器参数整定及系统稳定性的分析方法。文章进一步分析了抗干扰技术,并通过案例分析展示了PID控制在工业温度和流量控制系统中的优化与仿真。最后,文章展望了PID控制系统的高级扩展,如
业务连续性的守护者:中控BS架构考勤系统的灾难恢复计划

# 摘要
本文旨在探讨中控BS架构考勤系统的业务连续性管理,概述了业务连续性的重要性及其灾难恢复策略的制定。首先介绍了业务连续性的基础概念,并对其在企业中的重要性进行了详细解析。随后,文章深入分析了灾难恢复计划的组成要素、风险评估与影响分析方法。重点阐述了中控BS架构在硬件冗余设计、数据备份与恢复机制以及应急响应等方面的策略。
自定义环形菜单
# 摘要
本文探讨了环形菜单的设计理念、理论基础、开发实践、测试优化以及创新应用。首先介绍了环形菜单的设计价值及其在用户交互中的应用。接着,阐述了环形菜单的数学基础、用户交互理论和设计原则,为深入理解环形菜单提供了坚实的理论支持。随后,文章详细描述了环形菜单的软件实现框架、核心功能编码以及界面与视觉设计的开发实践。针对功能测试和性能优化,本文讨论了测试方法和优化策略,确保环形菜单的可用性和高效性。最后,展望了环形菜单在新兴领域的
资源上传下载、课程学习等过程中有任何疑问或建议,欢迎提出宝贵意见哦~我们会及时处理!
点击此处反馈


专栏目录
最低0.47元/天 解锁专栏
买1年送3月
百万级
高质量VIP文章无限畅学
千万级
优质资源任意下载
C知道
免费提问 ( 生成式Al产品 )