【Advanced Chapter】MATLAB Multiple Plots Creation, Adjustment, and Annotation
发布时间: 2024-09-13 16:04:22 阅读量: 29 订阅数: 43 
# Quick Start Tutorial Collection for MATLAB Multi-Plot Drawing
## 1. Basics of Multi-Plot Drawing in MATLAB
Multi-plot drawing in MATLAB refers to the creation of multiple graphs within a single figure window, useful for comparing different datasets, presenting various perspectives, or creating interactive visualizations. MATLAB offers a wide range of plotting functions that enable users to easily generate various types of graphs, including line plots, bar graphs, scatter plots, and surface plots.
To draw multiple plots, the `subplot` function can be used to divide the figure window into multiple sub-plot areas. Each sub-plot area can independently draw a graph. The syntax for `subplot` is `subplot(m,n,p)`, where `m` and `n` specify the size of the sub-plot grid and `p` specifies the position of the current sub-plot within the grid. For example, `subplot(2,2,1)` creates a 2x2 grid of sub-plots and selects the top-left sub-plot area.
## 2. Tips for Multi-Plot Drawing in MATLAB
### 2.1 Setting Properties of Graphical Objects
#### 2.1.1 Line Styles, Colors, and Markers
MATLAB provides a variety of line styles, colors, and marker options for customizing the visual appearance of graphical objects.
- **Line styles:** `'-'` for solid line, `'--'` for dashed line, `':'` for dotted line, `'-.'` for dash-dot line, etc.
- **Colors:** Specify using color names (e.g., `'red'`, `'blue'`) or RGB values (e.g., `[0.5, 0.5, 0.5]`).
- **Markers:** `'o'` for circle, `'x'` for cross, `'*'` for star, `'+'` for plus, etc.
```matlab
% Creating line plots with different styles, colors, and markers
figure;
x = 1:10;
y1 = sin(x);
y2 = cos(x);
y3 = tan(x);
plot(x, y1, 'r--o', 'LineWidth', 2); % Red dashed line with circle markers
hold on;
plot(x, y2, 'b-.x', 'LineWidth', 1.5); % Blue dash-dot line with cross markers
plot(x, y3, 'g:', 'MarkerSize', 10); % Green dotted line with star markers
xlabel('x');
ylabel('y');
legend('sin(x)', 'cos(x)', 'tan(x)');
grid on;
```
#### 2.1.2 Coordinate Axes and Tick Settings
MATLAB allows for flexible settings of coordinate axes and ticks to enhance the readability and aesthetics of the graph.
- **Coordinate axis labels:** Use `xlabel()` and `ylabel()` to set coordinate axis labels.
- **Tick range:** Use `xlim()` and `ylim()` to set the range of the coordinate axes.
- **Tick intervals:** Use `xticks()` and `yticks()` to set tick intervals.
- **Grid lines:** Use `grid on` or `grid off` to show or hide grid lines.
```matlab
% Setting coordinate axis labels, tick range, and grid lines
figure;
x = 0:0.1:10;
y = exp(-x);
plot(x, y);
xlabel('x');
ylabel('y');
xlim([0, 10]);
ylim([0, 1]);
xticks(0:2:10);
yticks(0:0.2:1);
grid on;
```
#### 2.1.3 Customizing Legends and Titles
Legends and titles help explain the content and purpose of the graph.
- **Legend:** Use `legend()` to add a legend, specifying the meaning of each line or marker.
- **Title:** Use `title()` to set the graph's title.
```matlab
% Adding a legend and title
figure;
x = 1:10;
y1 = sin(x);
y2 = cos(x);
plot(x, y1, 'r-', 'LineWidth', 2);
hold on;
plot(x, y2, 'b--', 'LineWidth', 1.5);
legend('sin(x)', 'cos(x)');
title('Trigonometric Functions');
```
## 3.1 Scientific Data Visualization
#### 3.1.1 Drawing Line, Bar, and Scatter Plots
Drawing line, bar, and scatter plots in MATLAB is fundamental for scientific data visualization. These charts can be used to show the relationship between different variables, compare different datasets, or identify trends and patterns in the data.
**Line Plot**
A line plot connects data points with line segments to display how data changes over time or another independent variable. It is typically used to show continuous data, such as time series or experimental results.
```matlab
% Creating time series data
t = 0:0.1:10;
y = sin(t);
% Drawing a line plot
plot(t, y);
xlabel('Time (s)');
ylabel('Amplitude');
title('Sinusoidal Wave');
```
**Bar Plot**
A bar plot uses vertical or horizontal bars to display data for different categories or groups. It is commonly used to compare values between different groups or to show data distribution.
```matlab
% Creating category data
categories = {'A', 'B', 'C', 'D'
```

 百万级
高质量VIP文章无限畅学
百万级
高质量VIP文章无限畅学
 千万级
优质资源任意下载
千万级
优质资源任意下载
 C知道
免费提问 ( 生成式Al产品 )
C知道
免费提问 ( 生成式Al产品 )
0
0
相关推荐

专栏目录
最低0.47元/天 解锁专栏
买1年送3月
百万级
高质量VIP文章无限畅学
千万级
优质资源任意下载
C知道
免费提问 ( 生成式Al产品 )
最新推荐
WinRAR CVE-2023-38831漏洞快速修复解决方案

# 摘要
本文详细阐述了WinRAR CVE-2023-38831漏洞的技术细节、影响范围及利用原理,并探讨了系统安全防护理论,包括安全防护层次结构和防御策略。重点介绍了漏洞快速检测与响应方法,包括使用扫描工具、风险评估、优先级划分和建立应急响应流程。文章进一步提供了WinRAR漏洞快速修复的实践
【QWS数据集实战案例】:深入分析数据集在实际项目中的应用
# 摘要
数据集是数据科学项目的基石,它在项目中的基础角色和重要性不可小觑。本文首先讨论了数据集的选择标准和预处理技术,包括数据清洗、标准化、特征工程等,为数据分析打下坚实基础。通过对QWS数据集进行探索性数据分析,文章深入探讨了统计分析、模式挖掘和时间序列分析,揭示了数据集内在的统计特性、关联规则以及时间依赖性。随后,本文分析了QWS数据集在金融、医疗健康和网络安全等特定领域的应用案例,展现了其在现实世界问题中
【跨平台远程管理解决方案】:源码视角下的挑战与应对
# 摘要
随着信息技术的发展,跨平台远程管理成为企业维护系统、提升效率的重要手段。本文首先介绍了跨平台远程管理的基础概念,随后探讨了在实施过程中面临的技术挑战,包括网络协议的兼容性、安全性问题及跨平台兼容性。通过实际案例分析,文章阐述了部署远程管理的前期准备、最佳实践以及性能优化和故障排查的重要性。进阶技术章节涵盖自动化运维、集群管理与基于云服务的远程管理。最后
边缘检测技术大揭秘:成像轮廓识别的科学与艺术

# 摘要
边缘检测技术是图像处理和计算机视觉领域的重要分支,对于识别图像中的物体边界、特征点以及进行场景解析至关重要。本文旨在概述边缘检测技术的理论基础,包括其数学模型和图像处理相关概念,并对各种边缘检测方法进行分类与对比。通过对Sobel算法和Canny边缘检测器等经典技术的实战技巧进行分析,探讨在实际应用中如何选择合适的边缘检测算法。同时,本文还将关注边缘检测技术的
Odroid XU4性能基准测试

# 摘要
Odroid XU4作为一款性能强大且成本效益高的单板计算机,其性能基准测试成为开发者和用户关注的焦点。本文首先对Odroid XU4硬件规格和测试环境进行详细介绍,随后深入探讨了性能基准测试的方法论和工具。通过实践测试,本文对CPU、内存与存储性能进行了全面分析,并解读了测试
TriCore工具使用手册:链接器基本概念及应用的权威指南

# 摘要
本文深入探讨了TriCore工具与链接器的原理和应用。首先介绍了链接器的基本概念、作用以及其与编译器的区别,然后详细解析了链接器的输入输出、链接脚本的基础知识,以及链接过程中的符号解析和内存布局控制。接着,本文着重于TriCore链接器的配置、优化、高级链
【硬件性能革命】:揭秘液态金属冷却技术对硬件性能的提升
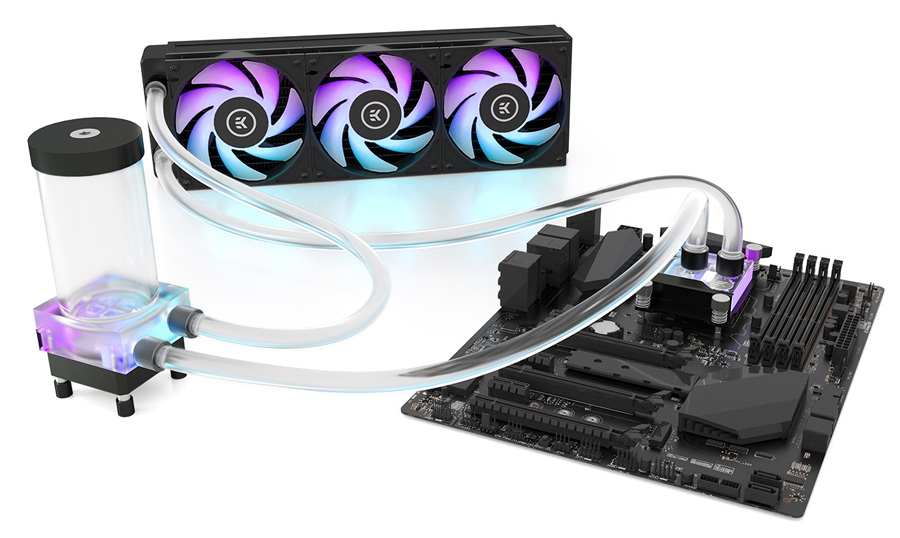
# 摘要
液态金属冷却技术作为一种高效的热管理方案,近年来受到了广泛关注。本文首先介绍了液态金属冷却的基本概念及其理论基础,包括热传导和热交换原理,并分析了其与传统冷却技术相比的优势。接着,探讨了硬件性能与冷却技术之间的关系,以及液态金属冷却技术在实践应用中的设计、实现、挑战和对策。最后,本文展望了液态金属冷却技术的未来,包括新型材料的研究和技术创新的
【企业级测试解决方案】:C# Selenium自动化框架的搭建与最佳实践
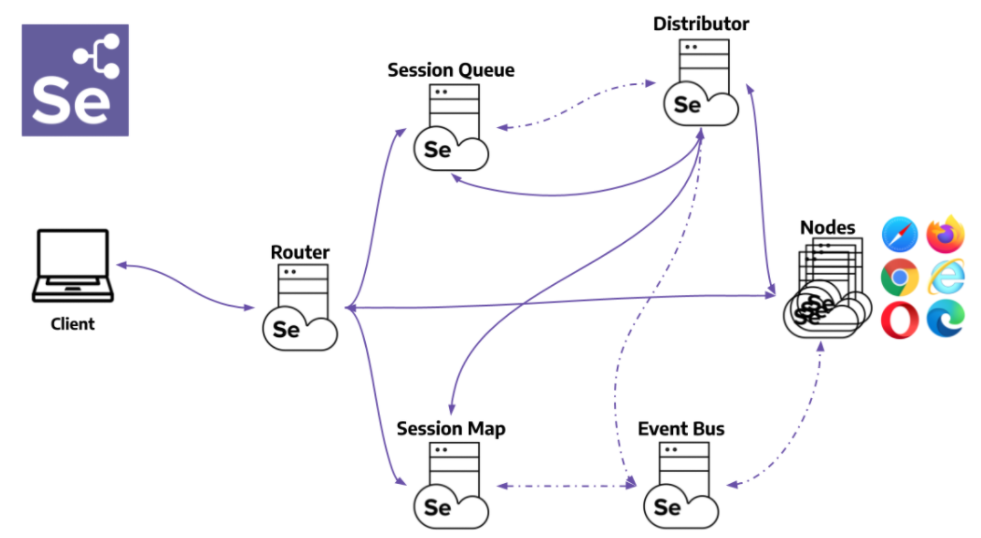
# 摘要
随着软件开发与测试需求的不断增长,企业级测试解决方案的需求也在逐步提升。本文首先概述了企业级测试解决方案的基本概念,随后深入介绍了C#与Selenium自动化测试框架的基础知识及搭建方法。第三章详细探讨了Selenium自动化测试框架的实践应用,包括测试用例设计、跨浏览器测试的实现以及测试数据的管理和参数化测试。第四章则聚焦于测试框架的进阶技术与优化,包括高级操作技巧、测试结果的分析与报告生成以及性能和负
三菱PLC-FX3U-4LC高级模块应用:详解与技巧

# 摘要
本论文全面介绍了三菱PLC-FX3U-4LC模块的技术细节与应用实践。首先概述了模块的基本组成和功能特点,接着详细解析了其硬件结构、接线技巧以及编程基础,包括端口功能、
【CAN总线通信协议】:构建高效能系统的5大关键要素
# 摘要
CAN总线作为一种高可靠性、抗干扰能力强的通信协议,在汽车、工业自动化、医疗设备等领域得到广泛应用。本文首先对CAN总线通信协议进行了概述,随后深入分析了CAN协议的理论基础,包括数据链路层与物理层的功能、CAN消息的传输机制及错误检测与处理机制。在实践应用方面,讨论了CAN网络的搭建、消息过滤策略及系统集成和实时性优化。同时,本文还探讨了CAN协议在不同行业的具体应用案例,及其在安全性和故障诊断方面的
资源上传下载、课程学习等过程中有任何疑问或建议,欢迎提出宝贵意见哦~我们会及时处理!
点击此处反馈


专栏目录
最低0.47元/天 解锁专栏
买1年送3月
百万级
高质量VIP文章无限畅学
千万级
优质资源任意下载
C知道
免费提问 ( 生成式Al产品 )