【Advanced】MATLAB Statistics Toolbox: Statistics Toolbox User Guide
发布时间: 2024-09-13 16:26:40 阅读量: 6 订阅数: 26 
# 2.1 Types of Probability Distributions and Parameter Estimation
Probability distributions describe the probability of possible outcomes of random variables. MATLAB's Statistics Toolbox provides a variety of probability distribution functions, including normal, t, and chi-square distributions.
### 2.1.1 Normal Distribution
The normal distribution, also known as the Gaussian distribution, is a symmetric bell-shaped distribution. Its probability density function is:
```
f(x) = (1 / (σ√(2π))) * exp(-(x - μ)² / (2σ²))
```
where:
- x is the random variable
- μ is the mean
- σ is the standard deviation
### 2.1.2 t Distribution
The t distribution is a generalization of the normal distribution and is used for smaller sample sizes. Its probability density function is:
```
f(x) = (Γ((ν + 1) / 2) / (Γ(ν / 2) * √(πν))) * (1 + (x² / ν))^(-(ν + 1) / 2)
```
where:
- x is the random variable
- ν is the degrees of freedom
### 2.1.3 Chi-Square Distribution
The chi-square distribution is a non-negative distribution used to assess goodness of fit of data. Its probability density function is:
```
f(x) = (1 / (2^(ν / 2) * Γ(ν / 2))) * x^(ν / 2 - 1) * exp(-x / 2)
```
where:
- x is the random variable
- ν is the degrees of freedom
# 2. Probability Distributions and Statistical Inference
### 2.1 Types of Probability Distributions and Parameter Estimation
Probability distributions describe the probability of possible outcomes of random variables. MATLAB's Statistics Toolbox offers a variety of probability distribution functions for fitting data and estimating their parameters.
#### 2.1.1 Normal Distribution
The normal distribution, also known as the Gaussian distribution, is one of the most commonly used distributions in statistics. It features a symmetrical bell-shaped curve defined by two parameters: the mean and the standard deviation.
```matlab
% Generate normal distribution data
data = normrnd(0, 1, 1000);
% Estimate normal distribution parameters
params = normfit(data);
mean_est = params(1);
std_est = params(2);
% Plot the normal distribution curve
figure;
histogram(data, 50);
hold on;
x = linspace(-5, 5, 100);
y = normpdf(x, mean_est, std_est);
plot(x, y, 'r', 'LineWidth', 2);
legend('Data', 'Fitted Normal Distribution');
title('Normal Distribution Fit');
xlabel('Value');
ylabel('Frequency');
```
#### 2.1.2 t Distribution
The t distribution is an extension of the normal distribution, used when sample sizes are small. It shares a similar shape with the normal distribution but has heavier tails.
```matlab
% Generate t distribution data
data = trnd(5, 1000);
% Estimate t distribution parameters
params = tfit(data);
mu_est = params(1);
sigma_est = params(2);
nu_est = params(3);
% Plot t distribution curve
figure;
histogram(data, 50);
hold on;
x = linspace(-5, 5, 100);
y = tpdf(x, nu_est, mu_est, sigma_est);
plot(x, y, 'r', 'LineWidth', 2);
legend('Data', 'Fitted t Distribution');
title('t Distribution Fit');
xlabel('Value');
ylabel('Frequency');
```
#### 2.1.3 Chi-Square Distribution
The chi-square distribution is a non-negative distribution used to test the difference between two probability distributions. It has a skewed shape and is defined by the degrees of freedom parameter.
```matlab
% Generate chi-square distribution data
data = chi2rnd(5, 1000);
% Estimate chi-square distribut
```

 百万级
高质量VIP文章无限畅学
百万级
高质量VIP文章无限畅学
 千万级
优质资源任意下载
千万级
优质资源任意下载
 C知道
免费提问 ( 生成式Al产品 )
C知道
免费提问 ( 生成式Al产品 )
0
0
相关推荐

专栏目录
最低0.47元/天 解锁专栏
送3个月
百万级
高质量VIP文章无限畅学
千万级
优质资源任意下载
C知道
免费提问 ( 生成式Al产品 )
最新推荐
Python列表的函数式编程之旅:map和filter让代码更优雅
# 1. 函数式编程简介与Python列表基础
## 1.1 函数式编程概述
函数式编程(Functional Programming,FP)是一种编程范式,其主要思想是使用纯函数来构建软件。纯函数是指在相同的输入下总是返回相同输出的函数,并且没有引起任何可观察的副作用。与命令式编程(如C/C++和Java)不同,函数式编程
【Python调试技巧】:使用字符串进行有效的调试
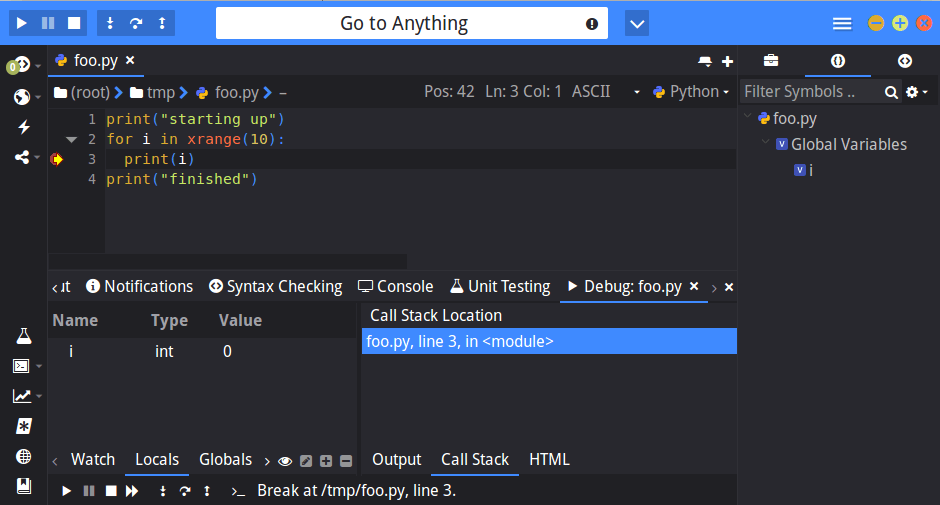
# 1. Python字符串与调试的关系
在开发过程中,Python字符串不仅是数据和信息展示的基本方式,还与代码调试紧密相关。调试通常需要从程序运行中提取有用信息,而字符串是这些信息的主要载体。良好的字符串使用习惯能够帮助开发者快速定位问题所在,优化日志记录,并在异常处理时提供清晰的反馈。这一章将探讨Python字符串与调试之间的关系,并展示如何有效地利用字符串进行代码调试。
# 2. P
Python在语音识别中的应用:构建能听懂人类的AI系统的终极指南

# 1. 语音识别与Python概述
在当今飞速发展的信息技术时代,语音识别技术的应用范围越来越广,它已经成为人工智能领域里一个重要的研究方向。Python作为一门广泛应用于数据科学和机器学习的编程语言,因其简洁的语法和强大的库支持,在语音识别系统开发中扮演了重要角色。本章将对语音识别的概念进行简要介绍,并探讨Python在语音识别中的应用和优势。
语音识别技术本质上是计算机系统通过算法将人类的语音信号转换
Python进阶秘籍:str()函数背后的8个转换黑科技
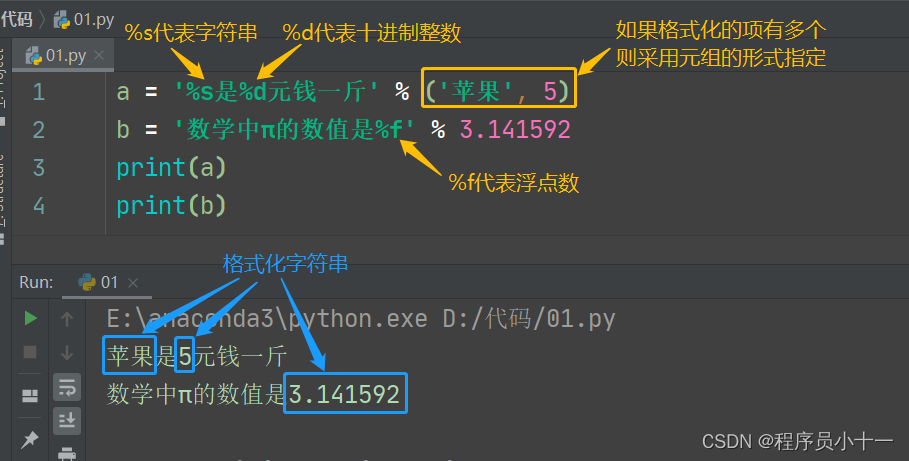
# 1. str()函数的基础知识
在Python编程中,`str()`函数是一个不可或缺的基础工具,它用于将给定对象转换成字符串类型。这个函数非常简单,但是它背后的概念和使用场景却十分广泛。让我们先来了解`str()`函数的基本用法和特性。
`str()`函数可以接收任何类型的对象作为参数,并尝试将其转换为字符串。这在需要对不同类型的数据进行打印、存储或在某些需要字符串格式的操作中非常有用。例如
【持久化存储】:将内存中的Python字典保存到磁盘的技巧

# 1. 内存与磁盘存储的基本概念
在深入探讨如何使用Python进行数据持久化之前,我们必须先了解内存和磁盘存储的基本概念。计算机系统中的内存指的
Python测试驱动开发(TDD)实战指南:编写健壮代码的艺术
# 1. 测试驱动开发(TDD)简介
测试驱动开发(TDD)是一种软件开发实践,它指导开发人员首先编写失败的测试用例,然后编写代码使其通过,最后进行重构以提高代码质量。TDD的核心是反复进行非常短的开发周期,称为“红绿重构”循环。在这一过程中,"红"代表测试失败,"绿"代表测试通过,而"重构"则是在测试通过后,提升代码质量和设计的阶段。TDD能有效确保软件质量,促进设计的清晰度,以及提高开发效率。尽管它增加了开发初期的工作量,但长远来
Python索引的局限性:当索引不再提高效率时的应对策略

# 1. Python索引的基础知识
在编程世界中,索引是一个至关重要的概念,特别是在处理数组、列表或任何可索引数据结构时。Python中的索引也不例外,它允许我们访问序列中的单个元素、切片、子序列以及其他数据项。理解索引的基础知识,对于编写高效的Python代码至关重要。
## 理解索引的概念
Python中的索引从0开始计数。这意味着列表中的第一个元素
【Python排序与异常处理】:优雅地处理排序过程中的各种异常情况
# 1. Python排序算法概述
排序算法是计算机科学中的基础概念之一,无论是在学习还是在实际工作中,都是不可或缺的技能。Python作为一门广泛使用的编程语言,内置了多种排序机制,这些机制在不同的应用场景中发挥着关键作用。本章将为读者提供一个Python排序算法的概览,包括Python内置排序函数的基本使用、排序算法的复杂度分析,以及高级排序技术的探
Python并发控制:在多线程环境中避免竞态条件的策略

# 1. Python并发控制的理论基础
在现代软件开发中,处理并发任务已成为设计高效应用程序的关键因素。Python语言因其简洁易读的语法和强大的库支持,在并发编程领域也表现出色。本章节将为读者介绍并发控制的理论基础,为深入理解和应用Python中的并发工具打下坚实的基础。
## 1.1 并发与并行的概念区分
首先,理解并发和并行之间的区别至关重要。并发(Concurre
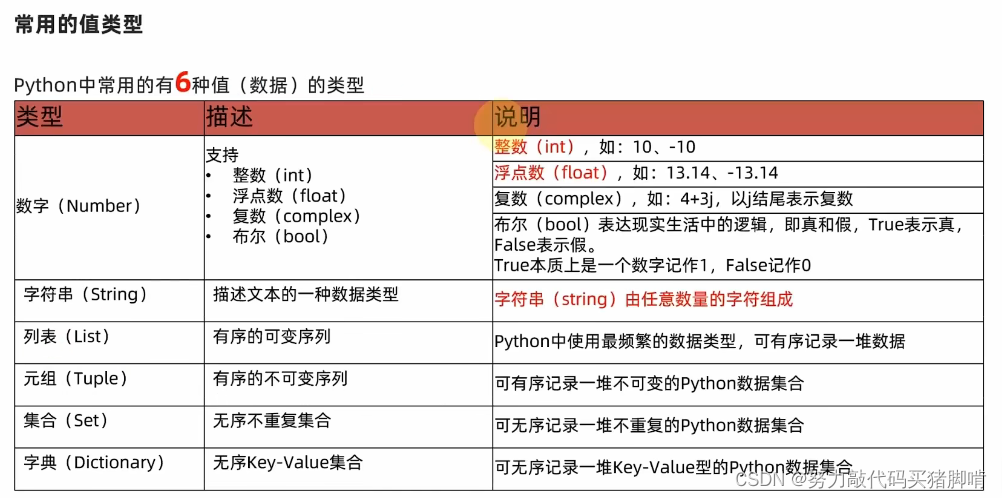
索引与数据结构选择:如何根据需求选择最佳的Python数据结构
# 1. Python数据结构概述
Python是一种广泛使用的高级编程语言,以其简洁的语法和强大的数据处理能力著称。在进行数据处理、算法设计和软件开发之前,了解Python的核心数据结构是非常必要的。本章将对Python中的数据结构进行一个概览式的介绍,包括基本数据类型、集合类型以及一些高级数据结构。读者通过本章的学习,能够掌握Python数据结构的基本概念,并为进一步深入学习奠
资源上传下载、课程学习等过程中有任何疑问或建议,欢迎提出宝贵意见哦~我们会及时处理!
点击此处反馈


专栏目录
最低0.47元/天 解锁专栏
送3个月
百万级
高质量VIP文章无限畅学
千万级
优质资源任意下载
C知道
免费提问 ( 生成式Al产品 )