Feature Selection: Master These 5 Methodologies to Revolutionize Your Models
发布时间: 2024-09-15 11:15:15 阅读量: 25 订阅数: 26 
# Feature Selection: Master These 5 Methodologies to Transform Your Models
## 1. Theoretical Foundations of Feature Selection
### 1.1 Importance of Feature Selection
Feature selection is a critical step in machine learning and data analysis, aimed at choosing a subset of features from the original dataset that most aid in the construction of predictive models. In this process, we not only eliminate irrelevant or redundant features to reduce model complexity but also retain those that have predictive power for the target variable, thereby enhancing model performance.
### 1.2 Objectives of Feature Selection
Effective feature selection can reduce data dimensions, decrease model training time, enhance model interpretability, prevent overfitting, and improve the generalization ability of the model. It helps us find an optimal balance point in the vast feature space.
### 1.3 Challenges of Feature Selection
Despite the many benefits of feature selection, challenges arise in practical operations. Determining the relationship between features and the target variable, evaluating the importance of features, and handling inter-feature dependencies are all issues that need to be addressed during feature selection.
In this chapter, we will explore the theoretical foundations of feature selection, providing the necessary theoretical support for specific feature selection methods in subsequent chapters.
# 2. Feature Selection Methods Based on Statistical Tests
## 2.1 Univariate Statistical Tests
In feature selection, univariate statistical tests are a simple yet effective method that evaluates the relationship between a single feature and the target variable. This method assumes that features are independent and attempts to identify those with significant statistical relationships to the target variable.
### 2.1.1 Chi-Square Test
The Chi-square test is a commonly used hypothesis testing method in statistics, used to determine if there is a statistically significant correlation between two categorical variables. In feature selection, the Chi-square test can be used to select categorical features.
#### Applying the Chi-square Test for Feature Selection
```python
from sklearn.feature_selection import SelectKBest, chi2
from sklearn.datasets import load_iris
# Load dataset
iris = load_iris()
X, y = iris.data, iris.target
# Select top 5 features using Chi-square test
select = SelectKBest(chi2, k=5)
X_kbest = select.fit_transform(X, y)
# Output selected features
selected_features = iris.feature_names[select.get_support()]
print(selected_features)
```
In the above code, we use the `SelectKBest` class, select the Chi-square test (`chi2`) as the scoring function, and specify selecting the top 5 features. The `fit_transform` method performs feature selection, and the `get_support` method returns a boolean array indicating which features are selected.
### 2.1.2 T-test
The T-test is used to compare the mean differences of two independent samples. In feature selection, the T-test is commonly used for continuous features to identify which features have a significant difference from the target variable's mean.
#### Applying the T-test for Feature Selection
```python
from sklearn.feature_selection import SelectKBest, f_classif
# Select top 5 features using ANOVA F-value
select = SelectKBest(f_classif, k=5)
X_kbest = select.fit_transform(X, y)
# Output selected features
selected_features = iris.feature_names[select.get_support()]
print(selected_features)
```
Here, we use ANOVA F-value (`f_classif`) as the scoring function, which is applicable to classification tasks and can identify features that impact the target variable.
### 2.1.3 ANOVA
Analysis of variance (ANOVA) is a statistical technique used to test if there are statistically significant differences between the means of three or more samples. In feature selection, ANOVA can be used to identify features that show different means across different categories.
#### Applying ANOVA for Feature Selection
```python
from scipy.stats import f_oneway
# Assume X and y are the features and labels obtained from the dataset
feature_groups = []
for feature in range(len(iris.feature_names)):
f_value, p_value = f_oneway(X[:, feature], y)
feature_groups.append((iris.feature_names[feature], f_value, p_value))
# Sort features by ANOVA F-values
feature_groups = sorted(feature_groups, key=lambda x: x[1], reverse=True)
print("Top features by ANOVA F-values:")
for feature in feature_groups[:5]:
print(f"{feature[0]} F-value: {feature[1]} P-value: {feature[2]}")
```
With the above code, we perform ANOVA testing on each feature and sort them by F-values. Note that ANOVA is a more complex statistical testing method used in feature selection to identify features that differentiate between different categories.
## 2.2 Multivariate Statistical Tests
Multivariate statistical tests differ from univariate tests as they evaluate the relationship between multiple features and the target variable. These methods are better suited to address issues of inter-feature dependencies.
### 2.2.1 Correlation Analysis
Correlation analysis is a statistical tool used to study the linear relationship between two continuous variables. In feature selection, common correlation coefficients include the Pearson correlation coefficient and the Spearman's rank correlation coefficient.
#### Applying Pearson Correlation Coefficient for Feature Selection
```python
import pandas as pd
import seaborn as sns
# Convert data to DataFrame for correlation analysis
df = pd.DataFrame(X, columns=iris.feature_names)
corr_matrix = df.corr()
# Plot heatmap of the correlation matrix
plt.figure(figsize=(10, 8))
sns.heatmap(corr_matrix, annot=True, cmap='coolwarm')
plt.title("Correlation Matrix Heatmap")
plt.show()
```
By plotting the heatmap of the correlation matrix, we can visually see the correlations between different features. In feature selection, we tend to remove features that are highly correlated with others to avoid multicollinearity issues.
### 2.2.2 Partial Correlation Analysis
Partial correlation analysis measures the linear relationship between two variables while controlling for the influence of other variables. This is particularly useful in feature selection as it helps identify features that are still related to the target variable after eliminating the effects of other variables.
#### Steps of Partial Correlation Analysis
1. Calculate the correlation of all features with the target variable.
2. For each pair of features, compute a conditional correlation, i.e., the correlation between the two variables when controlling for a third variable.
3. Perform feature selection based on conditional correlations.
Due to the complexity of partial correlation analysis, specialized statistical software or packages are often required. In Python, the advanced functions of the `numpy` and `scipy` libraries can be used to calculate it.
### 2.2.3 Path Analysis
Path analysis is an extended regression analysis method aimed at evaluating causal relationships between variables. In feature selection, path analysis can help us identify features that have a direct impact on the target variable.
#### Steps of Path Analysis
1. Determine potential causal relationship models.
2. Fit the model using structural equation modeling (SEM).
3. Assess the paths between variables through model fit goodness.
In Python, the `sem` module in the `statsmodels` library can be used to perform path analysis. However, path analysis usually requires domain knowledge to design a reasonable model structure.
The above introduces feature selection methods based on statistical tests, including univariate and multivariate statistical tests. In the next chapter, we will explore feature selection methods based on machine learning, a more proactive approach that utilizes the predictive power of machine learning models for feature selection.
# 3. Feature Selection Methods Based on Machine Learning
In machine learning, feature selection plays a significant role as it not only reduces model complexity and avoids overfitting but also improves the predictive performance of models. This chapter will detail feature selection methods based on machine learning, including model-based and penalty-based feature selection.
## 3.1 Model-Based Feature Selection
Model-based feature selection methods rely on the inherent feature selection capabilities of algorithms. These algorithms can evaluate the importance of features while building the model. A primary advantage of this method is that it takes into account the correlations between features, thus identifying and retaining more useful feature combinations.
### 3.1.1 Decision Tree Methods
Decision trees are one of the commonly used machine learning methods, classifying data through a series of judgment rules. Decision tree models not only provide an intuitive explanation of the data but also automatically perform feature selection.
```python
from sklearn.datasets import load_iris
from sklearn.tree import DecisionTreeClassifier
from sklearn.model_selection import train_test_split
# Load Iris dataset
iris = load_iris()
X = iris.data
y = iris.target
# Split the dataset into training and testing sets
X_train, X_test, y_train, y_test = train_test_split(X, y, test_size=0.2, random_state=42)
# Build decision tree model
clf = DecisionTreeClassifier(random_state=42)
clf.fit(X_train, y_train)
# Print feature importance
importances = clf.feature_importances_
indices = np.argsort(importances)[::-1]
# Output feature importance
for f in range(X_train.shape[1]):
```

 百万级
高质量VIP文章无限畅学
百万级
高质量VIP文章无限畅学
 千万级
优质资源任意下载
千万级
优质资源任意下载
 C知道
免费提问 ( 生成式Al产品 )
C知道
免费提问 ( 生成式Al产品 )
0
0
相关推荐

专栏目录
最低0.47元/天 解锁专栏
买1年送3月
百万级
高质量VIP文章无限畅学
千万级
优质资源任意下载
C知道
免费提问 ( 生成式Al产品 )
最新推荐
Pandas数据转换:重塑、融合与数据转换技巧秘籍
# 1. Pandas数据转换基础
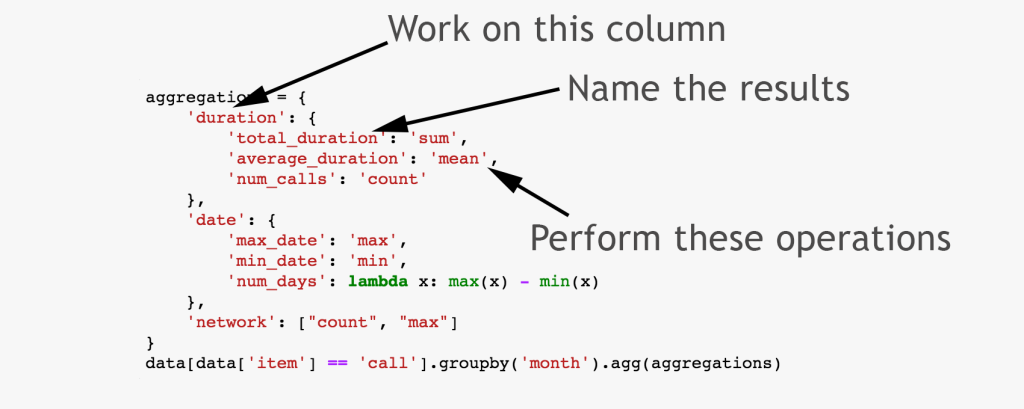
在这一章节中,我们将介绍Pandas库中数据转换的基础知识,为读者搭建理解后续章节内容的基础。首先,我们将快速回顾Pandas库的重要性以及它在数据分析中的核心地位。接下来,我们将探讨数据转换的基本概念,包括数据的筛选、清洗、聚合等操作。然后,逐步深入到不同数据转换场景,对每种操作的实际意义进行详细解读,以及它们如何影响数
正态分布与信号处理:噪声模型的正态分布应用解析
# 1. 正态分布的基础理论
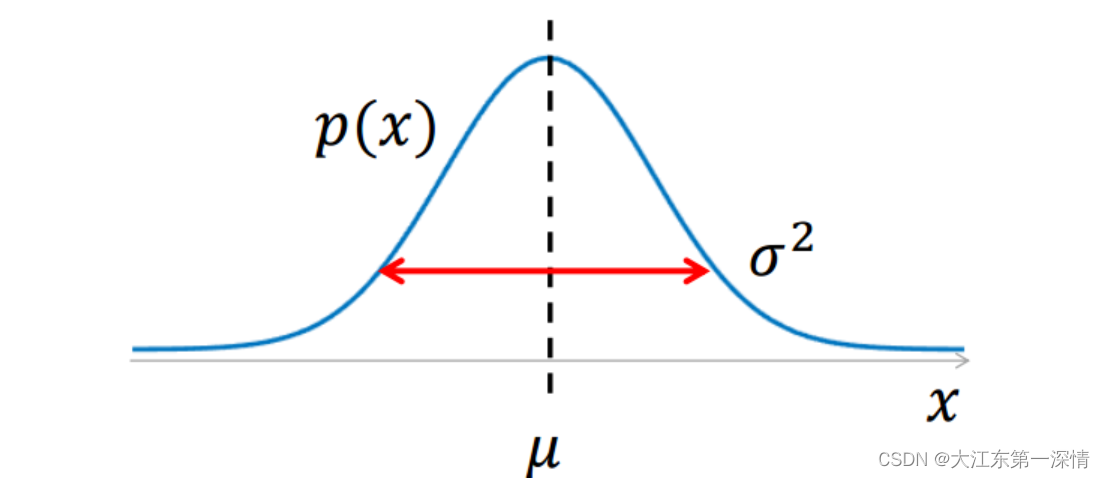
正态分布,又称为高斯分布,是一种在自然界和社会科学中广泛存在的统计分布。其因数学表达形式简洁且具有重要的统计意义而广受关注。本章节我们将从以下几个方面对正态分布的基础理论进行探讨。
## 正态分布的数学定义
正态分布可以用参数均值(μ)和标准差(σ)完全描述,其概率密度函数(PDF)表达式为:
```math
f(x|\mu,\sigma^2) = \frac{1}{\sqrt{2\pi\sigma^2}} e
数据清洗的概率分布理解:数据背后的分布特性

# 1. 数据清洗的概述和重要性
数据清洗是数据预处理的一个关键环节,它直接关系到数据分析和挖掘的准确性和有效性。在大数据时代,数据清洗的地位尤为重要,因为数据量巨大且复杂性高,清洗过程的优劣可以显著影响最终结果的质量。
## 1.1 数据清洗的目的
数据清洗
【线性回归优化指南】:特征选择与正则化技术深度剖析

# 1. 线性回归基础与应用场景
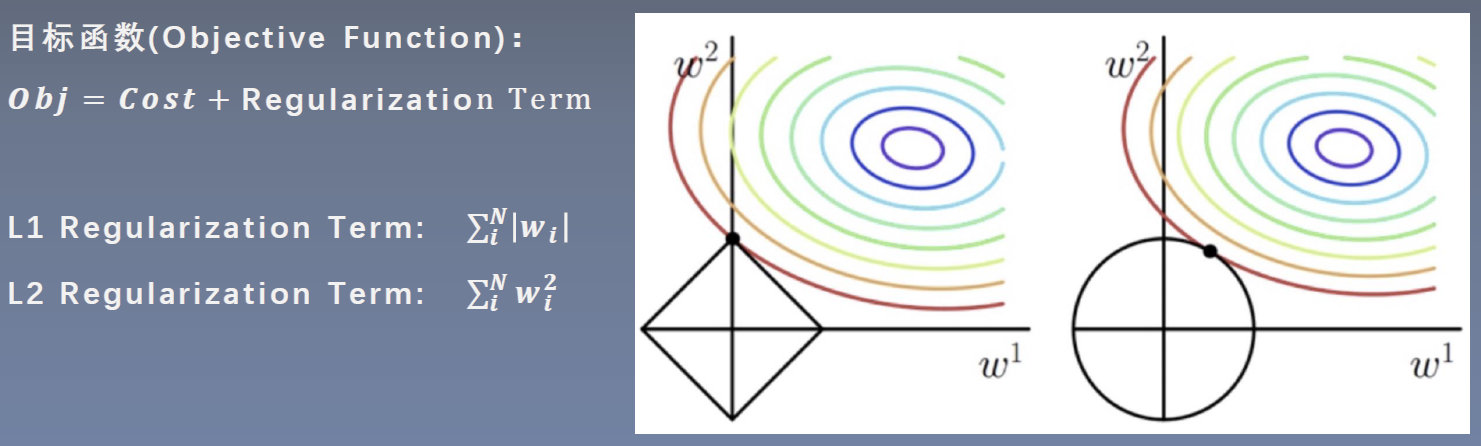
线性回归是统计学中用来预测数值型变量间关系的一种常用方法,其模型简洁、易于解释,是数据科学入门必学的模型之一。本章将首先介绍线性回归的基本概念和数学表达,然后探讨其在实际工作中的应用场景。
## 线性回归的数学模型
线性回归模型试图在一组自变量 \(X\) 和因变量 \(Y\) 之间建立一个线性关系,即 \(Y = \beta_0 + \beta_
NumPy在金融数据分析中的应用:风险模型与预测技术的6大秘籍

# 1. NumPy基础与金融数据处理
金融数据处理是金融分析的核心,而NumPy作为一个强大的科学计算库,在金融数据处理中扮演着不可或缺的角色。本章首先介绍NumPy的基础知识,然后探讨其在金融数据处理中的应用。
## 1.1 NumPy基础
NumPy(N
从Python脚本到交互式图表:Matplotlib的应用案例,让数据生动起来

# 1. Matplotlib的安装与基础配置
在这一章中,我们将首先讨论如何安装Matplotlib,这是一个广泛使用的Python绘图库,它是数据可视化项目中的一个核心工具。我们将介绍适用于各种操作系统的安装方法,并确保读者可以无痛地开始使用Matplotlib
【品牌化的可视化效果】:Seaborn样式管理的艺术

# 1. Seaborn概述与数据可视化基础
## 1.1 Seaborn的诞生与重要性
Seaborn是一个基于Python的统计绘图库,它提供了一个高级接口来绘制吸引人的和信息丰富的统计图形。与Matplotlib等绘图库相比,Seaborn在很多方面提供了更为简洁的API,尤其是在绘制具有多个变量的图表时,通过引入额外的主题和调色板功能,大大简化了绘图的过程。Seaborn在数据科学领域得
【数据集加载与分析】:Scikit-learn内置数据集探索指南

# 1. Scikit-learn数据集简介
数据科学的核心是数据,而高效地处理和分析数据离不开合适的工具和数据集。Scikit-learn,一个广泛应用于Python语言的开源机器学习库,不仅提供了一整套机器学习算法,还内置了多种数据集,为数据科学家进行数据探索和模型验证提供了极大的便利。本章将首先介绍Scikit-learn数据集的基础知识,包括它的起源、
Keras注意力机制:构建理解复杂数据的强大模型
# 1. 注意力机制在深度学习中的作用
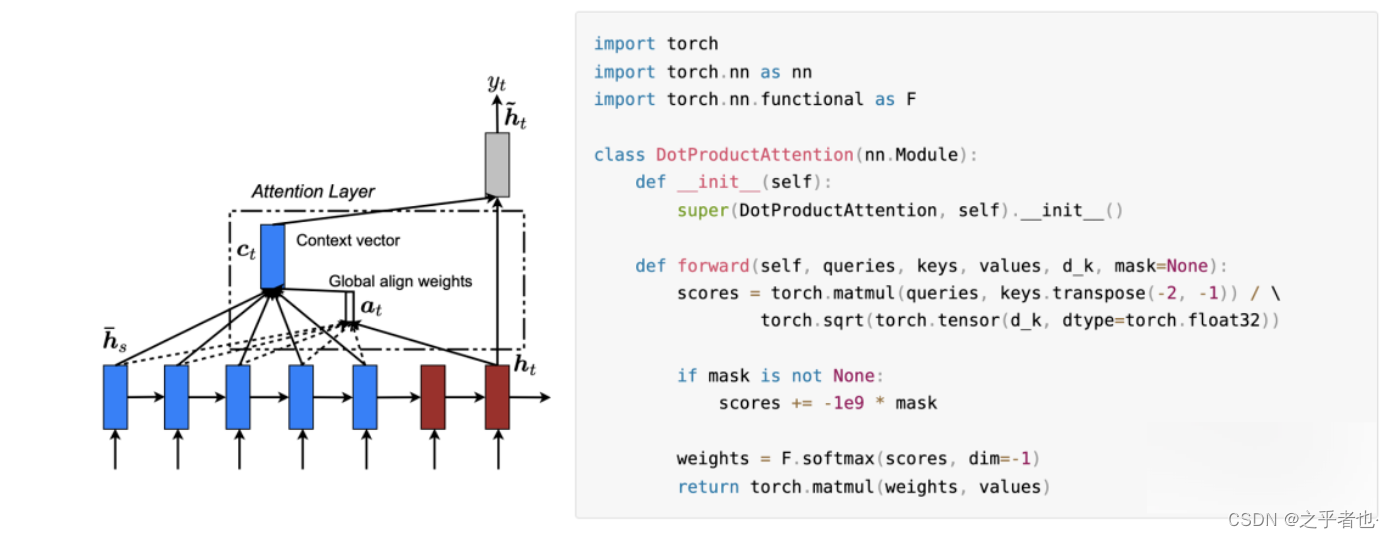
## 1.1 理解深度学习中的注意力
深度学习通过模仿人脑的信息处理机制,已经取得了巨大的成功。然而,传统深度学习模型在处理长序列数据时常常遇到挑战,如长距离依赖问题和计算资源消耗。注意力机制的提出为解决这些问题提供了一种创新的方法。通过模仿人类的注意力集中过程,这种机制允许模型在处理信息时,更加聚焦于相关数据,从而提高学习效率和准确性。
## 1.2
PyTorch超参数调优:专家的5步调优指南
# 1. PyTorch超参数调优基础概念
## 1.1 什么是超参数?
在深度学习中,超参数是模型训练前需要设定的参数,它们控制学习过程并影响模型的性能。与模型参数(如权重和偏置)不同,超参数不会在训练过程中自动更新,而是需要我们根据经验或者通过调优来确定它们的最优值。
## 1.2 为什么要进行超参数调优?
超参数的选择直接影响模型的学习效率和最终的性能。在没有经过优化的默认值下训练模型可能会导致以下问题:
- **过拟合**:模型在
资源上传下载、课程学习等过程中有任何疑问或建议,欢迎提出宝贵意见哦~我们会及时处理!
点击此处反馈


专栏目录
最低0.47元/天 解锁专栏
买1年送3月
百万级
高质量VIP文章无限畅学
千万级
优质资源任意下载
C知道
免费提问 ( 生成式Al产品 )