MATLAB Toolbox Detailed Explanation: Statistics and Machine Learning Toolbox
发布时间: 2024-09-14 03:34:01 阅读量: 88 订阅数: 39 

Statistics and Machine Learning Toolbox
# Introduction to the MATLAB Statistics and Machine Learning Toolbox
The MATLAB Statistics and Machine Learning Toolbox is a powerful suite of functions and tools for statistical analysis and machine learning, designed to provide MATLAB users with extensive capabilities for data preprocessing, statistical modeling, and the development and deployment of machine learning algorithms. This toolbox is essential for data scientists, researchers, and engineers who need to harness MATLAB's robust computational power to tackle complex data analysis and machine learning challenges.
# Theoretical Foundations of the Statistics and Machine Learning Toolbox
### Statistical Fundamentals
#### Probability Theory
Probability theory is the foundation of statistics; it studies the likelihood of random events occu***mon probability distributions include the normal, binomial, and Poisson distributions.
```matlab
% Generating normal distribution data
data = normrnd(0, 1, 1000);
% Plotting a histogram of the normal distribution
histogram(data);
xlabel('Data Value');
ylabel('Frequency');
title('Normal Distribution Histogram');
% Calculating the mean and standard deviation of the normal distribution
mean_data = mean(data);
std_data = std(data);
% Printing the mean and standard deviation
fprintf('Mean: %.2f\n', mean_data);
fprintf('Standard Deviation: %.2f\n', std_data);
```
#### Statistical I***
***mon methods of statistical inference include hypothesis testing and confidence interval estimation.
```matlab
% Hypothesis testing: comparing the means of two normal distributions
[h, p] = ttest2(data1, data2);
% If p < 0.05, reject the null hypothesis, indicating that the means of the two distributions are different
if p < 0.05
fprintf('Reject null hypothesis: The means of the two distributions are different.\n');
else
fprintf('Fail to reject null hypothesis: The means of the two distributions are not different.\n');
end
% Confidence interval estimation: estimating the mean of a normal distribution
[mu, sigma] = normfit(data);
ci = normconfint(0.95, mu, sigma);
% Printing the confidence interval
fprintf('95%% Confidence Interval: [%.2f, %.2f]\n', ci(1), ci(2));
```
### Machine Learning Fundamentals
#### Supervised Learning
Supervised ***mon supervised learning algorithms include linear regression, logistic regression, and support vector machines.
```matlab
% Linear regression: predicting house prices
data = load('house_prices.mat');
% Feature variable: area
X = data.area;
% Label variable: house price
y = data.price;
% Training a linear regression model
model = fitlm(X, y);
% Predicting the house price for a new area
new_area = 2000;
predicted_price = predict(model, new_area);
% Printing the predicted house price
fprintf('Predicted Price for Area = 2000: %.2f\n', predicted_price);
```
#### Unsupervised Learning
Unsupervised learn***mon unsupervised learning algorithms include clustering, dimensionality reduction, and anomaly detection.
```matlab
% Clustering: grouping customers into different segments
data = load('customer_data.mat');
% Feature variables: age, income, expenditure
X = data.features;
% Training a K-Means clustering model
model = kmeans(X, 3);
% Predicting the segment for a new customer
new_customer = [30, 50000, 20000];
predicted_cluster = predict(model, new_customer);
% Printing the predicted segment
fprintf('Predicted Segment for New Customer: %d\n', predicted_cluster);
```
# Data Preprocessing
Data preprocessing is a crucial step in the machine learning workflow, as it can enhance the accuracy and efficiency of models. The Statistics and Machine Learning Toolbox offers a broad range of data preprocessing functionalities, including data cleaning and transformation.
#### Data Cleaning
Data cleaning involves identifying and addressing errors, missing values, and outliers within the data. The data cleaning functions provided in the Toolbox include:
- `findmissing()`: Identifies the locations of missing values in a dataset.
- `ismissing()`: Checks if a specific data point is missing.
- `replacemissing()`: Replaces missing values with a specified value, such as the mean or median.
- `outliers()`: Identifies potential outliers in a dataset.
- `removeoutliers()`: Removes identified outliers.
```matlab
% Importing data
data = importdata('data.csv');
% Finding missing values
missing_values = findmissing(data);
% Replacing missing values with the mean
data(missing_values) = mean(data, 1);
% Identifying outliers
outliers = outliers(data);
% Removing outliers
data(outliers, :) = [];
```
#### Data Transformation
Data transformation involves converting data from one format to another to better suit modeling purposes. The data transformation functions in the Toolbox include:
- `normalize()`: Normalizes data to a range between 0 and 1.
- `standardize()`: Standardizes data to have a mean of 0 and a standard deviation of 1.
- `pca()`: Performs Principal Component Analysis (PCA) to reduce data dimensionality.
- `lda()`: Performs Linear Discriminant Analysis (LDA) to project data into a subspace that best separates different classes.
```matlab
% Normalizing data
normalized_data = normalize(data);
% Standardizing data
standardized_data = standardize(data);
% Executing PCA
[coeff, score, latent] = pca(data);
% Executing LDA
[lda_coeff, lda_score] = lda(data, labels);
```
# Advanced Applications of the Statistics and Machine Learning Toolbox
### Time Series Analysis
#### Features of Time Series Data
Time series data is a sequence of observations collected over time. It possesses the following characteristics:
- **Trend**: The long-term pattern of data values gradually increasing or decreasing.
- **Seasonality**: The pattern of data values repeating at specific time intervals, such as daily, weekly, or annually.
- **Cyclicity**: The pattern of data values that repeat over longer intervals, typically longer than seasonality.
- **Randomness**: Variations in data values that cannot be explained by trend, seasonality, or cyclicity.
#### Time Series Models
The MATLAB Statistics and Machine Learning Toolbox provides various time series models, including:
- **Autoregressive Moving Average (ARMA) model**: Combines autoregressive (AR) and moving average (MA) models to capture trends and randomness in the data.
- **Autoregressive Integrated Moving Average (ARIMA) model**: An extension of the ARMA model that includes differencing operations to handle non-stationary data.
- **Exponential smoothing models**: Used for forecasting data with exponential decay trends.
- **State space models**: For handling time series data with underlying state variables.
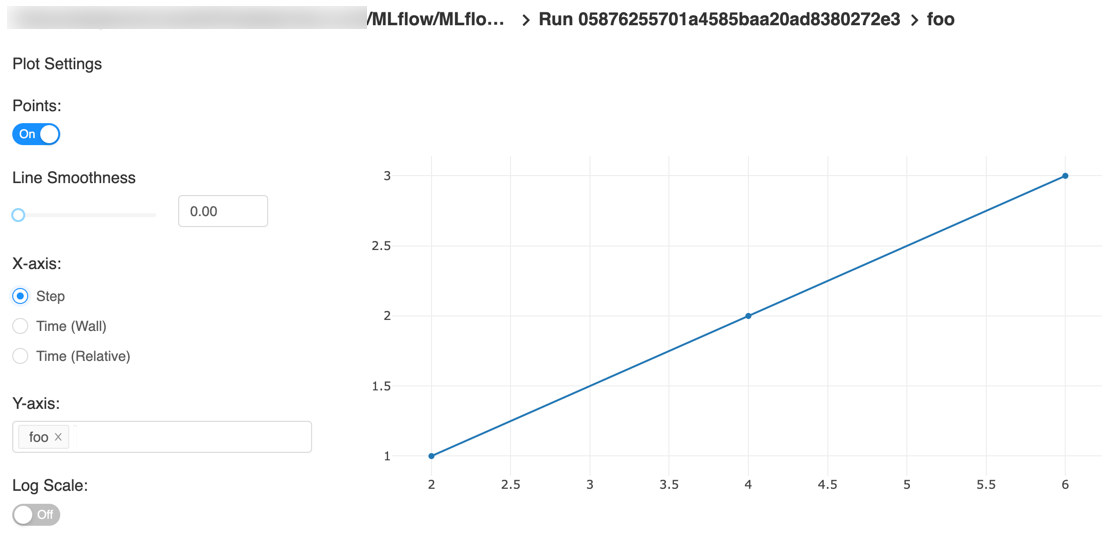
**Code Block:**
```matlab
% Importing time series data
data = load('timeseries_data.mat');
data = data.timeseries_data;
% Creating an ARIMA model
model = arima(data, [1, 1, 1]);
% Predicting future values
forecast = forecast(model, 10);
% Plotting actual data and predicted values
figure;
plot(data, 'b', 'LineWidth', 2);
hold on;
plot(forecast, 'r--', 'LineWidth', 2);
legend('Actual Data', 'Predicted Data');
xlabel('Time');
ylabel('Value');
title('Time Series Prediction');
```
**Logical Analysis:**
- The `arima` function creates an ARIMA model with the order specified by `[1, 1, 1]`.
- The `forecast` function predicts the next 10 values using the model.
- Plotting code visualizes the actual data and predictions for comparison.
### Natural Language Processing
#### Text Preprocessing
Text preprocessing is a key step in natural language processing, involving tasks such as:
- **Tokenization**: Breaking text into words or phrases.
- **Stemming**: Reducing words to their base or root form.
- **Removing stop words**: Eliminating common, non-informative words like "the", "and", "of".
- **Normalization**: Converting text to lowercase, removing punctuation, etc.
#### Text Classification
The MATLAB Statistics and Machine Learning Toolbox provides algorithms for text classification, including:
- **Naive Bayes classifier**: A simple classifier based on Bayes' theorem, which assumes feature independence.
- **Support Vector Machine (SVM)**: Uses a hyperplane to separate data points into different categories.
- **Decision tree**: Recursively assigns data points to categories through a series of rules.
**Code Block:**
```matlab
% Importing text data
data = readtable('text_data.csv');
% Text preprocessing
data.text = lower(data.text);
data.text = removePunctuation(data.text);
data.text = removeStopWords(data.text);
% Creating a text classifier
classifier = fitcnb(data.text, data.category);
% Predicting the category of new text
new_text = 'This is a new text to classify.';
predicted_category = predict(classifier, new_text);
```
**Logical Analysis:**
- The `readtable` function imports text data from a CSV file.
- The text preprocessing code performs tokenization, punctuation removal, and stop word removal.
- The `fitcnb` function creates a Naive Bayes classifier.
- The `predict` function classifies the new text using the classifier.
### Image Processing
#### Image Enhancement
Image enhancement techniques are used to improve the visual quality of images, including:
- **Contrast enhancement**: Adjusting the brightness range of pixels in an image.
- **Histogram equalization**: Redistributing the brightness values of pixels in an image to enhance contrast.
- **Sharpening**: Increasing the clarity of edges in an image.
#### Image Segmentation
Image segmentation divides an image into regions with different characteristics, including:
- **Thresholding segmentation**: Segregating an image into a binary image based on pixel brightness.
- **Region growing segmentation**: Grouping similar pixels into a region starting from a seed point.
- **Edge detection**: Identifying edges in an image where there are changes in brightness.
**Code Block:**
```matlab
% Importing an image
image = imread('image.jpg');
% Image enhancement
enhanced_image = imadjust(image, [0.2, 0.8], []);
% Image segmentation
segmented_image = im2bw(enhanced_image, 0.5);
% Displaying images
figure;
subplot(1, 3, 1);
imshow(image);
title('Original Image');
subplot(1, 3, 2);
imshow(enhanced_image);
title('Enhanced Image');
subplot(1, 3, 3);
imshow(segmented_image);
title('Segmented Image');
```
**Logical Analysis:**
- The `imread` function imports an image.
- The `imadjust` function enhances the image's contrast.
- The `im2bw` function converts the image into a binary image using a threshold of 0.5 for segmentation.
- The plotting code displays the original image, the enhanced image, and the segmented image.
# Model Optimization
### Hyperparameter Tuning
Hyperparameter tuning is a key step in optimizing the performance of machine learning models. Hyperparameters are parameters set during the model training process that are not learned from the data, such as learning rate, regularization parameters, etc.
**Grid Search for Hyperparameter Tuning**
Grid search is a widely used method for hyperparameter tuning. It involves systematically traversing a predefined grid of hyperparameter values and selecting the combination that yields the best performance.
```matlab
% Defining the hyperparameter grid
param_grid = {
'LearningRate', [0.01, 0.001, 0.0001],
'Regularization', [0.1, 0.01, 0.001]
};
% Performing grid search
[best_params, best_score] = gridSearch(model, param_grid, data);
```
### Regularization
Regularization is a technique used to prevent machine learning models from overfitting. Overfitting occurs when a model performs well on the training data but poorly on new data.
**L1 Regularization**
L1 regularization adds a term to the loss function that penalizes the absolute value of model weights, encouraging a sparse solution.
```matlab
% L1 Regularization
model = trainModel(data, 'L1Regularization', 0.1);
```
**L2 Regularization**
L2 regularization adds a term to the loss function that penalizes the square of model weights, encouraging a smooth solution.
```matlab
% L2 Regularization
model = trainModel(data, 'L2Regularization', 0.1);
```

 百万级
高质量VIP文章无限畅学
百万级
高质量VIP文章无限畅学
 千万级
优质资源任意下载
千万级
优质资源任意下载
 C知道
免费提问 ( 生成式Al产品 )
C知道
免费提问 ( 生成式Al产品 )
0
0
相关推荐

专栏目录
最低0.47元/天 解锁专栏
买1年送3月
百万级
高质量VIP文章无限畅学
千万级
优质资源任意下载
C知道
免费提问 ( 生成式Al产品 )
最新推荐
Linux服务器管理:wget下载安装包的常见问题及解决方案,让你的Linux运行更流畅

# 摘要
本文全面介绍了Linux服务器管理中wget工具的使用及高级技巧。文章首先概述了wget工具的安装方法和基本使用语法,接着深入分析了在下载过程中可能遇到的各种问题,并提供相应的解决策略和优化技巧。文章还探讨了wget的高级应用,如用户认证、网站下载技
【Origin图表高级教程】:独家揭秘,坐标轴与图例的高级定制技巧
# 摘要
本文详细回顾了Origin图表的基础知识,并深入探讨了坐标轴和图例的高级定制技术。通过分析坐标轴格式化设置、动态更新、跨图链接以及双Y轴和多轴图表的创建应用,阐述了如何实现复杂数据集的可视化。接着,文章介绍了图例的个性化定制、动态更新和管理以及在特定应用场景中的应用。进一步,利用模板和脚本在Origin中快速制作复杂图表的方法,以及图表输出与分享的技巧,为图表的高级定制与应用提供了实践指导
SPiiPlus ACSPL+命令与变量速查手册:新手必看的入门指南!
# 摘要
SPiiPlus ACSPL+是一种先进的编程语言,专门用于高精度运动控制应用。本文首先对ACSPL+进行概述,然后详细介绍了其基本命令、语法结构、变量操作及控制结构。接着探讨了ACSPL+的高级功能与技巧,包括进阶命令应用、数据结构的使用以及调试和错误处理。在实践案例分析章节中,通过具体示例分析了命令的实用性和变量管理的策略。最后,探
【GC4663电源管理:设备寿命延长指南】:关键策略与实施步骤

# 摘要
电源管理在确保电子设备稳定运行和延长使用寿命方面发挥着关键作用。本文首先概述了电源管理的重要性,随后介绍了电源管理的理论基础、关键参数与评估方法,并探讨了设备耗电原理与类型、电源效率、能耗关系以及老化交互影响。重点分析了不同电源管理策略对设备寿命的影响,包括动态与静态策略、负载优化、温度管理以及能量存储与回收技术。
EPLAN Fluid版本控制与报表:管理变更,定制化报告,全面掌握

# 摘要
EPLAN Fluid作为一种高效的设计与数据管理工具,其版本控制、报告定制化、变更管理、高级定制技巧及其在集成与未来展望是提高工程设计和项目管理效率的关键。本文首先介绍了EPLAN Fluid的基础知识和版本控制的重要性,详细探讨了其操作流程、角色与权限管理。随后,文章阐述了定制化报告的理论基础、生成与编辑、输出与分发等操作要点
PRBS序列同步与异步生成:全面解析与实用建议

# 摘要
本论文详细探讨了伪随机二进制序列(PRBS)的定义、重要性、生成理论基础以及同步与异步生成技术。PRBS序列因其在通信系统和信号测试中模拟复杂信号的有效性而具有显著的重要性。第二章介绍了PRBS序列的基本概念、特性及其数学模型,特别关注了生成多项式和序列长度对特性的影响。第三章与第四章分别探讨了同步与异步PRBS序列生成器的设计原理和应用案例,包括无线通信、信号测试、网络协议以及数据存储测试。第五
【打造个性化企业解决方案】:SGP.22_v2.0(RSP)中文版高级定制指南
# 摘要
本文对SGP.22_v2.0(RSP)中文版进行详尽概述,深入探讨其核心功能,包括系统架构设计原则、关键组件功能,以及个性化定制的理论基础和在企业中的应用。同时,本文也指导读者进行定制实践,包括基础环境的搭建、配置选项的使用、高级定制技巧和系统性能监控与调优。案例研究章节通过行业解决方案定制分析,提供了定制化成功案例和特定功能的定制指南。此外,本文强调了定制过程中的安
【解决Vue项目中打印小票权限问题】:掌握安全与控制的艺术

# 摘要
本文详细探讨了Vue项目中打印功能的权限问题,从打印实现原理到权限管理策略,深入分析了权限校验的必要性、安全风险及其控制方法。通过案例研究和最佳实践,提供了前端和后端权限校验、安全优化和风险评估的解决方案。文章旨在为Vue项目中打印功能的权限管理提供一套完善的理论与实践框架,促进Vue应用的安全性和稳定性。
# 关键字
Vue项目;权限问题;打印功能;权限校验;安全优化;风
小红书企业号认证:如何通过认证强化品牌信任度

# 摘要
本文以小红书企业号认证为主题,全面探讨了品牌信任度的理论基础、认证流程、实践操作以及成功案例分析,并展望了未来认证的创新路径与趋势。首先介绍了品牌信任度的重要性及其构成要素,并基于这些要素提出了提升策略。随后,详细解析了小红书企业号认证的流程,包括认证前的准备、具体步骤及认证后的维护。在实践操作章节中,讨论了内容营销、用户互动和数据分析等方面的有效方法。文章通过成功案例分析,提供了品牌建设的参考,并预测了新媒体环境下小红书企业号认证的发展
【图书馆管理系统的交互设计】:高效沟通的UML序列图运用
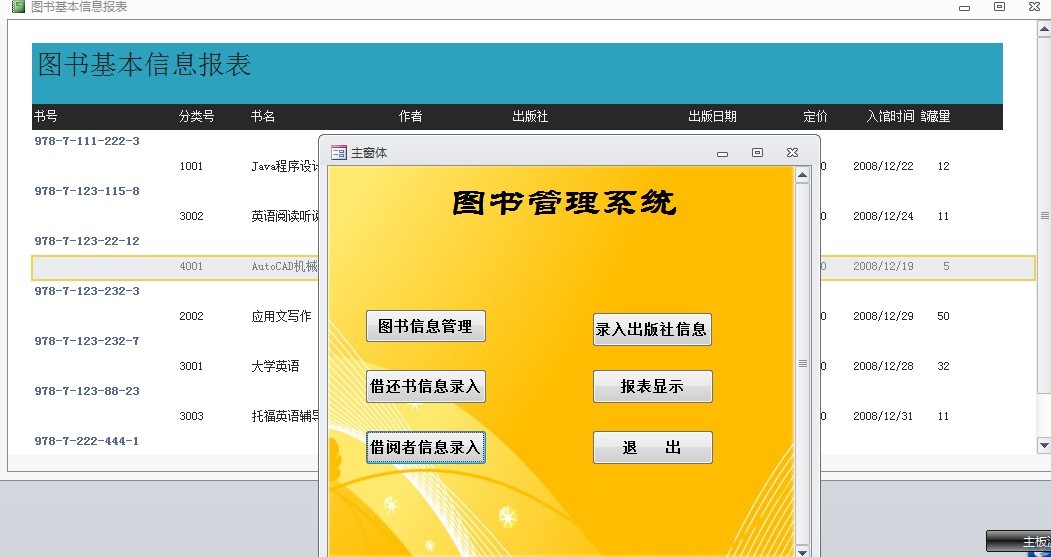
# 摘要
本文首先介绍了UML序列图的基础知识,并概述了其在图书馆管理系统中的应用。随后,详细探讨了UML序列图的基本元素、绘制规则及在图书馆管理系统的交互设计实践。章节中具体阐述了借阅、归还、查询与更新流程的序列图设计,以及异常处理、用户权限管理、系统维护与升级的序列图设计。第五章关注了序列图在系统优化与测试中的实际应用。最后一章展望了图书馆管理系统的智能化前景以及序列图技术面临
资源上传下载、课程学习等过程中有任何疑问或建议,欢迎提出宝贵意见哦~我们会及时处理!
点击此处反馈


专栏目录
最低0.47元/天 解锁专栏
买1年送3月
百万级
高质量VIP文章无限畅学
千万级
优质资源任意下载
C知道
免费提问 ( 生成式Al产品 )